Electromotive Force and Measurement in Several Systems Part 12 pps
Bạn đang xem bản rút gọn của tài liệu. Xem và tải ngay bản đầy đủ của tài liệu tại đây (1.08 MB, 15 trang )
Electromotive Force and Measurement in Several Systems
154
new perspectives in electromagnetic theory, as formalisms to develop new type of
transformers, others explanations about resonance theory, analysis of energy transfer
through resonance on coils, generation of high energy from low power sources, analysis
about parasitic capacitances and others characteristics at coils and transformers, and others.
This chapter treats of this problem, checking some experimental results, and mathematical
formalisms that explain some properties and phenomena that occurs at secondary coil when
the resonance frequency is reached in the coupled circuit (transformer), due to induced EMF
generated by the excitation of the primary coil with square wave or sinusoidal wave.
2. Experimental methodology and data analysis of Induced EMF at coils
Several experiments were realized in special transformers built in planar coils versus ring
coils, to found interesting results about resonance. In all cases, an excitation of square and
sinusoidal alternating current were put as entry in primary transformers directly of the
wave generator output, to verify the response at secondary coils of the transformers. The
analysis of the results shown phenomena at resonance which are analysed here, showing
high gains not expected in circuit theory.
2.1 Experimental methodology
In present work were utilized some coils to prepare the transformers where the experiments
were realized. These coils are built in copper wire with diameter d = 2.02 x 10
-4
m (32 AWG) or
d = 1.80 x 10
-4
m (36 AWG). Were built several planar coils with diameter of D = 4.01 x 10
-2
m,
with turn numbers of 20, 50, 200, 500 and 1600, and the ring coils with diameter of D = 4.65 x
10
-2
m, with turn numbers of 2, 5, 7, 9, 10, 12, 15, 20, 30 and 50. All coils were built so that
their height are h = 1.8 x 10
-4
m (case of 20 and 50 turns) and h = 5 x 10
-4
m. In this way, the
transformers present a planar coil inner ring coil, always based on crossing of the described
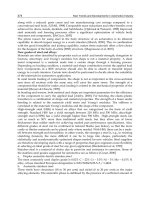
coils, where this configuration is shown in Fig. 1.
Fig. 1. Basic layer of the studied transformer: Planar coil inner Ring coil.
The measurement of the capacitance between two coils (planar vs ring) presented the value
of C
pr
= 3.1 x 10
-11
F.
The used equipments were: a digital storage oscilloscope Agilent Technologies DSO3202A
with passive probe N2862A (input resistance = 10 MΩ and input capacitance ≃12pF), a
function generator Rigol DG2021A and a digital multimeter Agilent Technologies U1252A.
Initially, the experiments were realized exciting primary (being the planar coil) with a
square wave of 5 V
pp
(2.5 V
max
), and frequencies ranging from 1 kHz and 25 MHz, and
observing the responses of the secondary open circuit (being the ring coil). Also, with this
Resonance Analysis of Induced EMF on Coils
155
same waveform of excitation, the system was inverted, considering ring coil as primary
(input of square wave) and planar coil as secondary (output analyzed). A posteriori, the
excitation was changed by a sinusoidal waveform with the same amplitude, realizing the
extraction of the data in direct system and inverted system.
Considering the effects of parasitic capacitances (C
gi
the parasitic capacitances in relation to
a ground, and C
ci
turn to turn parasitic capacitances, i = 1,2), self (L
i
, i = 1,2) and mutual (M)
inductances and resistances (r
i
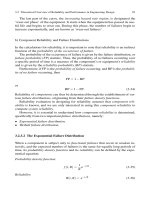
, i = 1,2) of coils, the system can be analyzed as equivalent
circuit shown in Fig. 2.
Fig. 2. Equivalent circuit to analysis of the system.
Inductances and mutual inductances of the coils (Hurley and Duffy, 1997; Su, Liu and Hui,
2009) are calculated using procedure presented in (Babic and Akyel, 2000; Babic et al., 2002;
Babic and Akyel, 2006; Babic and Akyel, 2008), where some of obtained magnitudes of self
inductances are shown in Table 1 as follows:
Turn number Self inductance (H)
10 4.33 x 10
-7
20 1.85 x 10
-6
30 4.07 x 10
-6
50 1.10 x 10
-5
200 1.67 x 10
-4
500 9.48 x 10
-4
1600 1.07 x 10
-2
Table 1. Computed self inductances for planar coils.
The experimental data obtained with this configuration, a priori, were sufficient to determine
several effects not common in literature, especially in relation to resonance described as the
sum of system responses (when the input is a square waveform), as the high gain that
contradicts theory of ideal transformers (in both waveform excitations).
2.1.1 Data analysis for excitation with square wave on direct system
When the primary of the transformer was excited with square wave, the response of the
system presented as a second order system, presenting a sinusoidal response with
exponential dumping (Costa, 2009d). In this case, considering excitation of the planar coil
(as the primary of the transformer), response at secondary is seen in the oscilloscope in time
division of 100 s/div we observe that the system response is verified in accordance with
Faraday’s law emf = -d
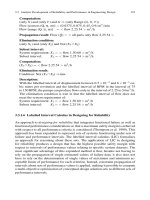
/dt. This result may be seen in Fig. 3, where the signal of the output is
Electromotive Force and Measurement in Several Systems
156
inverted to simplify the observations. In this case, this response is referred to a 200 turns
planar coil as primary and a 10 turns ring coil as secondary in input square wave frequency f
= 1 kHz. However, when inceasing time division of the oscilloscope for 500 ns/div, in this
specific case of the system which generates the response seen in Fig. 3(a), the effects of
parasitic capacitances may be observed as attenuated sine wave, as shown in Fig. 3(b). In
this case we observe a double sinusoidal (modulated response) with exponential drop. This
case is formally observed as effect of the values of the system transfer function, that can be
observed only 15 < n
p
/n
r
<25, being n
p
is the turn number planar coil and n
r
is the turn
number ring coil (Costa, 2009; Costa, 2009a).
(a) (b)
Fig. 3. (a) Oscilloscope image of input (upper) and output (lower) of the analyzed system
with time division 100 s/div, (b) System response with increasing oscilloscope time
division.
When we observe the system responses in other configurations, is observed that the increase
of turns in planar coil reduces the lower frequency (that modulates the higher frequency or
the main response shown in Fig. 3(b)), as we can see in Fig. 4.
In Fig. 4, we observe that the system response follows equally the rise and the fall of the
square wave. Because these effects, when increasing the frequency of square wave applied
on primary of the system, we observe that the total system response is presented as the sum
of these responses separately. Clearly, the accumulated energy on system (in inductances
and parasitic capacitances) is added with the new response when the excitation rises or falls.
It is shown in Fig. 5(a), as simulation for 3 attenuated sine wave responses, and at Fig. 5(b) is
shown the same effect based on experimental results.
In the case of Fig. 6, we observe that the results have a DC component in response for each
rise and fall of the square wave, which is observed in Fig. 7. Consequently this sum of
responses is presented as:
0
(1)( sin exp( ( )) )
n
p
o
p
vt
p
bt
p
a
(1)
where is a constant referring to peak response of the sine wave, a is a constant referring to
DC level in response, b is a constant referring to exponential attenuation and p is the time
Resonance Analysis of Induced EMF on Coils
157
when occur each change in the square wave, as we can see in (Costa, 2009c; Costa, 2010a) for
some aspects of resonance on coils.
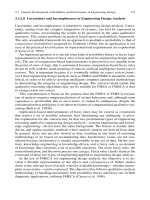
Fig. 4. Responses of the system excited with square wave of f = 1kHz in configurations: (a)
20 turns planar coil vs 9 turns ring coil; (b) 50 turns planar coil vs 12 turns ring coil; (c) 500
turns planar coil vs 7 turns ring coil and (d) 1600 turns planar coil vs 5 turns ring coil.
Fig. 5. (a) Simulation showing the sum of attenuated sine wave responses in some rises and
falls of the applied square wave on system. (b) Response of the system defined with 200
turns planar coil and 12 turns ring coil, where we observe the sum of individual responses
for each rise and fall of the square wave.
Electromotive Force and Measurement in Several Systems
158
Due to the sum of responses, we find that when the responses is in phase with the square
wave, i.e., the relation f
r
= f
s
/n, we find a maximum value in output, which refers to the sum
of the sine waves in phase and their DC components. In this relation, f
r
is the frequency of
the main sine wave of the response in each rise and fall of the square wave, f
s
the frequency
of the square wave and n an integer. Thus, this sum refers to sum of total accumulated
energy on coils. However, the resonance only occurs in specific frequencies, when the
output is a perfect sine wave. In this case, we can see that effect of resonance is verified
when the maximum energy peak is found. This occur in the frequency f
r
= f
s
, which may
have values of voltage greater than peak to peak input voltage of the square wave, although
the turn ratio of the transformer is lower than 1.
This result may be observed in Fig. 5(a), when the responses are added sequentially, i.e.,
when t , with f
r
= f
s
. In this case, the maximum value of the peak to peak voltage on
output is
max
0
(4 1)
2exp (1)
4
k
i
pp
i
Ti
Vba
(2)
where k is the number of cycles of the attenuated sine wave as system response to an input
step voltage and T is the period of this sine wave (oscillatory response). Based on this
example, we note in all experiments that the found problem due to induced EMF at
resonance is that the output is the sum of the responses in each rise and fall of the square
wave step voltage. Consequently, it is a result obtained that explains the high voltage of
Tesla transformer. These results are shown in Fig. 6, for some configurations of the analyzed
system.
In Fig. 6, the obtained data for these configurations are shown in Table 2.
In accordance with these data, we observe that the system response excited with square
wave does not follow the common gain of the circuit theory, defined as turn ratio. In other
words, in usual circuit theory, the turn ratio determines voltage reduction, but in resonance
when is applied square wave as input signal, the response is sinusoidal presenting a visible
inversion (high gain defining increased voltage). Thus, for the same data shown in Table 2,
data in Table 3 shows the gain of the system in resonance and the expected output value in
accordance to circuit theory.
Turn number
Planar (n
p
)/Ring (n
r
)
Turn Ratio
n
r
/n
p
v
pp,max
(V) f (kHz)
20/12 0.6 52.4 8130
50/7 0.14 8.0 13900
200/20 0.1 7.84 4050
500/5 0.01 1.17 18350
1600/30 0.01875 2.02 1570
Table 2. Data of the System Configurations shown in Fig. 8.
Resonance Analysis of Induced EMF on Coils
159
Fig. 6. Resonance of the systems in configurations: (a) 20 turns planar coil vs 12 turns ring
coil on f = 8130 kHz; (b) 50 turns planar coil vs 7 turns ring coil on f = 13900 kHz; (c) 200
turns planar coil vs 20 turns ring coil on f = 4050 kHz; (d) 500 turns planar coil vs 5 turns ring
coil on f = 18350 kHz and (e) 1600 turns planar coil vs 30 turns ring coil on f = 1570 kHz.
Turn number
Planar/Ring
v
pp,max
(V) v
0
/v
i
v
pp
- expected value of
circuit theory (V)
20/12 52.4 10.48 3.0
50/7 8.0 1.6 0.7
200/20 7.84 1.568 0.5
500/5 1.17 0.234 0.05
1600/30 2.02 0.404 0.09375
Table 3. Ratio Output/Input and Expected output for Data at Table 2.
Electromotive Force and Measurement in Several Systems
160
These effects are clearly visible when using Equations (1) and (2), which show why the
system at resonance can get high energy.
The same effect is observed for the inverted system, i.e., when ring coil is the primary of the
transformer and the planar coil is the secondary. This case is presented in the next section.
2.1.2 Data analysis for excitation with square wave with inverted system
Considering the inversion of the system, i.e., ring coil as primary and planar coil as secondary,
the response appears similarly to initial configuration. But due to the inversion of the values
(parasitic capacitances, self inductances and resistances in the equivalent system shown in Fig.
2, and consequently changes in value of mutual inductance (Babic and Akyel, 2000; Babic et al.,
2002; Babic and Akyel, 2006; Babic and Akyel, 2008) changes in transfer function are made,
such that the output presents features similar to the cases where n
p
/n
r
>25. In these cases, the
inversion of the values in transfer function also generates a lower frequency on oscillatory
response. Consequently, the system response presents resonance in lower frequencies than the
initial configuration, as we see in (Costa, 2009d).
Observing Fig. 7, we see the system responses for some configurations when the input
signal is a low frequency square wave (similarly to input step voltage). In this figure, we
clearly observe that the frequencies are lower than frequencies of system response in initial
configuration. Also, we observe that the input square wave is presented with effects of RL
circuit, due to passive probe of oscilloscope be in parallel to primary coil (Babic and Akyel,
2000; Babic et al., 2002; Babic and Akyel, 2006; Babic and Akyel, 2008).
When the frequency is increased, the same effect of sum of responses to each rise and fall of
the square wave defined in Equation (1) is observed, as shown in Fig. 8. In the same way,
when the relation f
r
= f
s
/n is verified, the output voltage reaches the maximum value,
although this response is not a perfect sine wave.
However, in accordance to Equations (1) and (2), when the relation f
r
= f
s
is verified, the
resonance occurs, and the output reaches the maximum value with a perfect sine wave.
Since that the frequencies of the responses are lower, the resonance occurs in low
frequencies of the square wave, in comparison with the initial configuration. Some results of
this case are shown in Fig. 9.
We observe in this case, that the output voltage (v
pp
) is greater than the initial configuration.
Clearly, this effect is observed because two components are considered: the turn ratio (effect of
the transformer, as circuit theory) and the sum of the sinusoidal responses as (1).
Consequently, the resonance output voltage is greater than the effect of the transformer alone.
For configurations shown in Fig. 7, 8 and 9, the maximum values of the output voltage are
shown in Table 4, with their respective turn ratio and resonance frequency.
However, although in this case occurs an effect of the turn ratio (transformer), in accordance
to results shown in Table 4, this effect defines that this is not always right, as in the case of
the configurations of 2 turns ring coil vs 1600 turns planar coil, 2 turns ring coil vs 50 turns
planar coil, 5 turns ring coil vs 500 turns planar coil and others with turn ratio greater than
100. It is due to impedance of the circuit, which eliminates various sinusoidal components of
the input square wave, reducing total value on output.
In the realized measurements with all coils in the initial configuration and inverted system,
we can see the behavior of the output voltage when varying turn number of the coils (ring
and planar) in Fig. 10, for input square wave of 5 V peak to peak. With this Fig. 10 we can
generate a direct comparison for both cases worked, verifying the gain.
Resonance Analysis of Induced EMF on Coils
161
Fig. 7. Some responses of the inverted system: (a) 12 turns ring coil vs 20 turns planar coil;
(b) 7 turns ring coil vs 50 turns planar coil; (c) 9 turns ring coil vs 200 turns planar coil; (d) 20
turns ring coil vs 500 turns planar coil and (e) 2 turns ring coil vs 1600 turns planar coil.
Electromotive Force and Measurement in Several Systems
162
Fig. 8. Sum of responses on inverted system in configurations: (a) 15 turns ring coil vs 20
turns planar coil; (b) 2 turns ring coil vs 50 turns planar coil; (c) 20 turns ring coil vs 200 turns
planar coil; (d) 10 turns ring coil vs 500 turns planar coil and (e) 7 turns ring coil vs 1600
turns planar coil.
Resonance Analysis of Induced EMF on Coils
163
Fig. 9. Resonance in some inverted systems: (a) 7 turns ring coil vs 20 turns planar coil; (b) 15
turns ring coil vs 50 turns planar coil; (c) 12 turns ring coil vs 200 turns planar coil; (d) 5
turns ring coil vs 500 turns planar coil and (e) 30 turns ring coil vs 1600 turns planar coil.
In case of the initial configuration (direct system), the gain obtained is increased follows
in accordance to turn numbers of the both coils. In the case of the inverted system, the
gain is decreasing to turn number ring coil, and reaches the maximum peak voltage in
configurations defined as low turn number in ring coil and high turn number in planar
coil (in the obtained experimental results this value is 5 turn number ring coil). The
obtained values for turn number in ring coil lower than 5 is decreasing, when it is crossed
with turn number higher than 200 in planar coils. Naturally, this effect is verified as being
the variation of the values of parasitic capacitances, self-inductances and mutual
inductance (Babic and Akyel, 2000; Babic et al., 2002; Babic and Akyel, 2006; Babic and
Akyel, 2008), since that these planar coils are built in more than one layer in the same disk
diameter.
Electromotive Force and Measurement in Several Systems
164
Turn number
Ring (n
r
)/ Planar (n
p
)
Turn Ratio
n
p
/n
r
v
pp,max
(V) f (kHz)
12/20 1.667 21.4 13900
7/50 7.143 96 5920
9/200 22.222 170 1573
20/500 25.0 328 560
2/1600 800.0 322 402
15/20 1.333 17.6 13900
2/50 25.0 99.2 5700
20/200 10.0 174 1580
10/500 50.0 336 540
7/1600 228.571 400 407
7/20 2.857 38.8 14000
15/50 3.333 72.8 5770
12/200 16.667 166 1520
5/500 100.0 362 530
30/1600 53.333 342 442
Table 4. Results to Inverted System in Configurations of Fig. 7, 8 and 9.
Also, other effect observed in inverted system is the output peak voltage for low turn
number in ring coil. When the turn number in planar coil is increased, considering 5 turn
number in ring coil, the graph seen in Fig. 10(b) increases quickly, showing a better
relationship to maximum response in resonance.
Because this relationship between coils, higher sinusoidal voltage is obtained, showing
important results between self inductances and others parameters evaluated on system to
generate high voltages on air-cored transformers, as well how we can built small pulse
transformers [28] with high voltage output based on planar coil inner ring coil and others
applications for energy transfer.
(a) (b)
Fig. 10. Output variations according to turn number coils: (a) Initial configuration; (b)
Inverted System.
Resonance Analysis of Induced EMF on Coils
165
Finally, we observe that these results, in both cases (initial configuration or direct system,
and inverted system) show important effects on resonance in pulsed systems, when they
involve coils, which may be used to analysis on electromagnetic interference and other
problems of power electronics, pulse transformer and computational systems.
2.1.3 Data analysis for excitation with sine wave in direct system and comparison with
square wave excitation
When analysing the response of the system when excitation is a sinusoidal waveform, the
result presented is a sinusoidal wave with phase variation. But, when the resonance is
reached, high gain is noted, however slightly larger than the response of the excitation with
square wave. In both cases, the induced EMF at resonance generates the phenomenon of
that the coupled circuit theory (transformer) and circuit theory is not satisfied, since that the
high gain do not satisfies the ideal gain of the transformers.
Considering direct system, the response at low frequencies (from 1 kHz to 20 ~ 50 kHz) are
generally noise, as shown in Fig. 11. It is due to effect of inductances, mutual inductances,
and parasitic capacitances, which determines a filter which cut these frequencies. For
frequencies above 50 kHz, response of the system appears as lagged sine wave, as we can
see in Fig. 12.
Fig. 11. (a) 10 turns planar coils versus 15 turns ring coil at 30 kHz; (b) 20 turns planar coils
versus 30 turns ring coil at 40 kHz; (c) 30 turns planar coils versus 10 turns ring coil at 5
kHz; (d) 200 turns planar coils versus 10 turns ring coil at 50 kHz;
Electromotive Force and Measurement in Several Systems
166
Fig. 12. (a) 20 turns planar coils versus 10 turns ring coil at 200 kHz; (b) 30 turns planar coils
versus 15 turns ring coil at 1000 kHz; (c) 50 turns planar coils versus 50 turns ring coil at
3500 kHz; (d) 200 turns planar coils versus 30 turns ring coil at 2850 kHz.
Analysing the problem of these frequencies, we can see that the response of the system is:
sin
o
vA t
(3)
where A() is the amplitude and () is the phase, which both depends upon frequency.
Amplitude varies with inductances, mutual inductances, resistances and parasitic
capacitances of the system, presenting similar graph as system excited with square wave,
but with fewer resonance peaks, as view in Fig. 13, which compares output of the system in
some cases excited by sine waves and square waves. The number of resonance peaks in
output of the system when escited by square waves is due to components of the Fourier
series that passes at filter, generating several resonance peaks with increased amplitudes, as
frequency increases,which similarly we find in (Cheng, 2006, Huang et al, 2007) analysis of
problems involving harmonic analysis.
In the case of sine wave excitation, resonance responses are found as higher output as
excitation with square waves. When considering the sinusoidal excitation, the maximum
gain are presented at Table 5, where are seen the gains of some experimented systems,
considering ring coil as primary, and in Table 6 are seen obtained ratio of these two gains for
Resonance Analysis of Induced EMF on Coils
167
direct system (ring coil as primary), where are seen that in resonance with sine wave
excitation, the gain is higher than square wave excitation.
Fig. 13. Graphs of voltage versus frequency of the system built in 20 turns planar coil versus
ring coil excited by: (a) sine wave; (b) square wave; and system built in 500 turns planar coil
versus 12 turns ring coil excited by (c) sine wave; (d) square wave.
Coil 10 20 50 200 500
10 0.14 3.80 12.40 28.40 50.00
12 0. 46 1.84 13.36 13.04 50.80
20 0.22 1.26 11.88 22.80 51.60
30 0.10 1.47 6.12 19.20 5.04
50 1.98 2.20 6.04 5.04 0.16
Table 5. Gains of transformers with sinusoidal excitation (direct system): columns with
planar coil; rows with ring coil.
Electromotive Force and Measurement in Several Systems
168
Coil 10 20 50 200 500
10 0.39 1.58 1.46 1.61 1.49
12 1.68 0.77 1.67 0.82 1.57
20 0.93 0.83 1.95 1.36 1.57
30 1.74 1.84 1.59 1.50 0.15
50 3.17 5.29 3.68 0.60 0.01
Table 6. Ratio of the gain transformers with sinusoidal (sin) and square wave (sw)
excitation: G
sin
/G
sw
(direct system): columns with planar coil; rows with ring coil.
Clearly, the results for sine wave excitation is higher than square wave excitation, due to
square wave can be seen as Fourier series, where the response have several low frequencies
components eliminated. Consequently, the result of the sum is lower than the resonance
response of the system, when excited by a sine wave.
Fig. 14 shows the curve of the gain ratio for direct system, which they shows that the
variation is almost constant in the most cases.
Fig. 14. Graph showing gain ratio for direct system with sine wave excitation (Gsin) and
square wave excitation (Gsq): Gsin/Gsq.
2.1.4 Data analysis for excitation with sine wave with inverted system and comparison
with square wave excitation
Considering inverted system excited by a sine wave, similar problem is found as inverted
system excited by square wave, as well the higher gain of the sine wave excitation.
Considering low frequencies, the response of the system has the behaviour similar as low
frequencies in direct system, what we can see in Fig. 15. When frequency increases,
behaviour appears in similar way as previously cases, as shown in Fig. 16.