báo cáo khoa học: " Transcriptome changes in the phenylpropanoid pathway of Glycine max in response to Pseudomonas syringae infection" ppsx
Bạn đang xem bản rút gọn của tài liệu. Xem và tải ngay bản đầy đủ của tài liệu tại đây (718.47 KB, 18 trang )
BMC Plant Biology
BioMed Central
Open Access
Research article
Transcriptome changes in the phenylpropanoid pathway of Glycine
max in response to Pseudomonas syringae infection
Gracia Zabala1, Jijun Zou1, Jigyasa Tuteja1, Delkin O Gonzalez1,
Steven J Clough1,2 and Lila O Vodkin*1
Address: 1Department of Crop Sciences, University of Illinois, Urbana, Illinois 61801, USA and 2USDA-ARS, Urbana, Il 61801, USA
Email: Gracia Zabala - ; Jijun Zou - ; Jigyasa Tuteja - ;
Delkin O Gonzalez - ; Steven J Clough - ; Lila O Vodkin* -
* Corresponding author
Published: 03 November 2006
BMC Plant Biology 2006, 6:26
doi:10.1186/1471-2229-6-26
Received: 12 May 2006
Accepted: 03 November 2006
This article is available from: />© 2006 Zabala et al; licensee BioMed Central Ltd.
This is an Open Access article distributed under the terms of the Creative Commons Attribution License ( />which permits unrestricted use, distribution, and reproduction in any medium, provided the original work is properly cited.
Abstract
Background: Reports of plant molecular responses to pathogenic infections have pinpointed
increases in activity of several genes of the phenylpropanoid pathway leading to the synthesis of
lignin and flavonoids. The majority of those findings were derived from single gene studies and more
recently from several global gene expression analyses. We undertook a global transcriptional
analysis focused on the response of genes of the multiple branches of the phenylpropanoid pathway
to infection by the Pseudomonas syringae pv. glycinea with or without the avirulence gene avrB to
characterize more broadly the contribution of the multiple branches of the pathway to the
resistance response in soybean. Transcript abundance in leaves was determined from analysis of
soybean cDNA microarray data and hybridizations to RNA blots with specific gene probes.
Results: The majority of the genes surveyed presented patterns of increased transcript
accumulation. Some increased rapidly, 2 and 4 hours after inoculation, while others started to
accumulate slowly by 8 – 12 hours. In contrast, transcripts of a few genes decreased in abundance
2 hours post inoculation. Most interestingly was the opposite temporal fluctuation in transcript
abundance between early responsive genes in defense (CHS and IFS1) and F3H, the gene encoding
a pivotal enzyme in the synthesis of anthocyanins, proanthocyanidins and flavonols. F3H transcripts
decreased rapidly 2 hours post inoculation and increased during periods when CHS and IFS
transcripts decreased. It was also determined that all but one (CHS4) family member genes (CHS1,
CHS2, CHS3, CHS5, CHS6 and CHS7/8) accumulated higher transcript levels during the defense
response provoked by the avirulent pathogen challenge.
Conclusion: Based on the mRNA profiles, these results show the strong bias that soybean has
towards increasing the synthesis of isoflavonoid phytoalexins concomitant with the down
regulation of genes required for the synthesis of anthocyanins and proanthocyanins. Although
proanthocyanins are known to be toxic compounds, the cells in the soybean leaves seem to be
programmed to prioritize the synthesis and accumulation of isoflavonoid and pterocarpan
phytoalexins during the resistance response. It was known that CHS transcripts accumulate in great
abundance rapidly after inoculation of the soybean plants but our results have demonstrated that
all but one (CHS4) member of the gene family member genes accumulated higher transcript levels
during the defense response.
Page 1 of 18
(page number not for citation purposes)
BMC Plant Biology 2006, 6:26
Background
A common bacterial disease of soybean worldwide is the
bacterial blight caused by Pseudomonas syringae pv. glycinea
(Psg). The interactions of compatible and incompatible
races of Psg with different soybean cultivars have been
characterized previously [1]. Compatible interactions
allow bacterial growth within the host and disease development, whereas incompatible interactions restrict bacterial multiplication with minimal symptom development
through the sacrifice of very few cells in the immediate
vicinity of the pathogen by programmed cell death.
Incompatible interactions lead to a cascade of plant
responses triggered by the action of a resistance gene R
and the corresponding avirulent pathogen avr gene, which
is known as the hypersensitive response (HR) [2,3].
The complex resistance response provoked in such incompatible plant-pathogen interactions have been studied
and characterized at the molecular level to a large extent
in the model plant Arabidopsis thaliana (reviewed in [4])
and to a lesser extent in agronomically important crops
[5]. The inducible defense mechanisms may be local or
systemic. Local defenses usually involve necrotic changes
initiated by ion flux in and out of the cell, followed by the
oxidative destruction of cell components by lipid
hydroperoxides and reactive oxygen species, in addition
to the accumulation of toxic metabolites such as phytoalexins and other phenolic compounds. Systemic defenses
result in the accumulation of anti-microbial compounds
in parts of the plant distant from the site of infection.
Among these defenses are pathogenesis related proteins
(PR), defensins, proteinase inhibitors and cell wall components such as hydroxyproline-rich glycoproteins
(HRGP) and lignin and its precursors. Additionally, synthesis of salicylic acid (SA), a signal molecule that regulates systemic and local pathogen-induced defense gene
activation, oxidative burst, and pathogen-induced cell
death, increases [6].
Consequently, many secondary metabolites derived from
multiple branches of the phenylpropanoid pathway,
including lignins, isoflavonoid-phytoalexins, other phenolic compounds and SA are instrumental in the plant's
ability to mount successful defenses to invading pathogens (Figure 1). Most studies of the phenylpropanoid
pathway to date have investigated the molecular response
of individual genes of the pathway. No major systematic
or global analysis focused on the many genes from the
multiple branches of the pathway (Figure 1) has been
reported. Although general, global transcriptome changes
during defense responses of various plants (Arabidopsis,
tomato, Medicago truncatula, soybean) to several pathogens (Pseudomonas spp, Alternaria brassicicola, Xanthomonas,
Phytophthora) have been examined [7-11], none of the
analyses have thoroughly mined the data with specific
/>
emphasis on the overall response of the phenylpropanoid
pathway genes. Nevertheless, those global studies have
shown several groups of up regulated ESTs representing
three main branches of the phenylpropanoid pathway
and it appears that all plants examined respond to infection with the induction of phenylalanine ammonia-lyase
(PAL) coumarate CoA-ligase (C4H) and cynamyl alcohol
dehydrogenase (CAD) genes. Chalcone synthase (CHS) a
central enzyme in the pathway is consistently induced in
all plants examined with the exception of Arabidopsis [12].
In addition, four isoflavonoid pathway ESTs were up-regulated in Medicago truncatula and soybean [9,10] and four
putative anthocyanin pathway ESTs in tomato [8].
CHS is the key enzyme diverting the substrate, naringenin
chalcone to the flavonoid and isoflavonoid branches of
the phenylpropanoid pathway that synthesizes the precursor of a large number of secondary metabolites, including proanthocyanidins, anthocyanins, flavones, flavonols
and isoflavonoid-phytoalexins among others (Figure 1).
Unlike Arabidopsis where only one chalcone synthase
(CHS) gene exists [13] and the isoflavonoid branch of the
pathway appears to be non-existent [14,15], legumes have
multiple family member genes. Soybean plants have an 8member CHS family and exhibit tissue compartmentalized expression of the isoflavonoid pathway leading to the
synthesis of isoflavones in the roots and cotyledons and
an inducible isoflavonoid-phytoalexins synthesis in the
leaves of pathogen stressed plants [16,17].
Here we report our findings on the levels of transcript
abundance of 19 phenylpropanoid pathway genes and
the identification of stress-responsive CHS gene family
member(s) in leaves of soybean (cultivar Williams 82)
challenged with Pseudomonas syringae pv. glycinea with or
without the avrB gene. Transcript abundance patterns
obtained using RNA from infected leaves in hybridizations to soybean cDNA microarrays [11] were, supported
and extended further by single gene RNA gel blots for five
genes of key phenylpropanoid pathway enzymes (CAD,
CHS, IFS, F3'H and F3H). Real time quantitative RT-PCR
was also used to measure the relative transcript levels of
the individual CHS gene family members in leaf tissues 8
hrs after inoculation.
An increase in transcript abundance was observed for
most of the analyzed genes with the exception of transcripts of genes whose products function downstream of
chalcone isomerase (CHI) and are required for the synthesis of flavonols, anthocyanins and proanthocyanidins
(F3H, DFR, LDOX, UFGT and FLS). These decreased in
abundance as early as 2 hrs post-inoculation. The more
frequent transcript measurements along the 53 hrs post
inoculation period in RNA gel blots detected temporal
fluctuation in transcript abundance for three genes CHS,
Page 2 of 18
(page number not for citation purposes)
BMC Plant Biology 2006, 6:26
/>
Phenylpropanoid Metabolic Pathway
L-phenylalanine
PAL
BA2H
Benzoic Acid
Salicylic Acid
C4H
P-coumarate
4CL
CHI/ CHR/ CHS
4-coumaroyl- CoA
IFS1
IFS2
ISOFLAVANONES
Pterocarpan
Glyceollin II
C3H
LIGNIN
CAD
CCR
3 malonyl-CoA
CHS
Naringenin chalcone
ISOFLAVONES
Daidzein
Genistein
IOMT
PHYTOALEXINS
IFR1
IFR2
COMT
COMT
F5H
Caffeic acid
Ferulate
5-OH ferulate
Sinapate
Cinnamate
CHI
FSI, FS2
5’ OH Eriodictyol F3’5’H Naringenin F3’H Eriodictyol
F3H
F3H
F3H
FLS
F3’H
F3’5’H
Dihydrokaempferol
Dihydromyricetin
Dihydroquercetin
DFR
DFR
FLAVONES
FLAVONOLS
DFR
LAR
Leucodelphinidin
LDOX ANS
Leucopelargonidin
LDOX ANS
Delphinidin
UFGT
Pelargonidin
Leucocyanidin
LDOX ANS
ANR
Flavan-3-ols
epicatechin
Condensing
enzyme
Delphinidin-3 glycoside Pelargonidin-3-glycoside Cyanidin-3-glycoside
TANNINS
PROANTHOCYANIDINS
ANTHOCYANINS
UFGT
cyanidin
UFGT
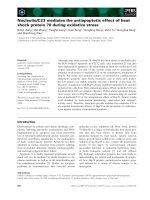
Figure 1
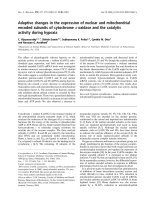
Phenylpropanoid metabolic pathway
Phenylpropanoid metabolic pathway. Enzymes are indicated in uppercase letters. In purple are the enzymes for which
cDNAs were printed in the soybean microarrays and their RNA profiles were determined in the microarray experiments. In
red are the enzymes which RNA profiles were measured by microarrays and RNA blots using specific cDNA probes. In gray
are enzymes for which no annotated EST exists in soybean public databases. PAL, phenylalanine ammonia-lyase; C4H, cinnamate 4-hydroxylase; 4CL, 4-coumarate: CoA ligase; CHS, chalcone synthase; CHI, chalcone isomerase; IFS, isoflavone synthase;
F3'H, flavonoid 3'-hydroxylase; F3', 5'H, flavonoid 3',5'-hydroxylase; F3H, flavanone 3-hydroxylase; DFR, dihydroflavonol-4reductase; ANS, anthocyanidin synthase also called LDOX, leucoanthocyanidin dioxygenase); UFGT, UDP-flavonoid glucosyltransferase; BA2H, benzoic acid 2-hydroxylase; C3H, p-coumarate 3 hydroxylase; COMT, caffeic O-methyltransferase; F5H,
ferulic acid 5-hydroxylase; CCR, cynnamoyl CoA reductase; CAD, cynnamyl alcohol dehydrogenase.
IFS and F3H. A significant finding was the opposite fluctuation in F3H transcript accumulation compared to that
of CHS and IFS transcripts, revealing that F3H and other
downstream genes in the anthocyanin/proanthocyanidin/flavonol pathways are underexpressed during pathogen challenge. Thus, our data suggests that flavonols,
proanthocyanidins and anthocyanins are not recruited to
mount the hypersensitive response in soybean leaves and
that their synthesis is in competitive disadvantage with
that of the isoflavonoid-phytoalexins. Interestingly, F3'H
transcripts accumulate continuously 12 hrs post inoculation suggesting that this branch of the pathway is participating in the reaction cascade elicited by the defense
response and possibly shifting the pathway towards the
synthesis of flavones. Finally, we also found that all genes
of the CHS family (CHS1, CHS2, CHS3, CHS5, CHS6 and
Page 3 of 18
(page number not for citation purposes)
BMC Plant Biology 2006, 6:26
/>
CHS7/8) except CHS4 accumulated higher transcript levels during the hypersensitive defense response (HR) triggered by the avirulent pathogen.
TIGR database. The different TCs for a given gene annotation possibly represent different family members or perhaps, different regions of the same gene.
Results
The majority of ESTs representing 13 of the genes (PAL,
C4H, 4CL, CHS, CHR, CHI, IFS, IOMT, IFR, CCR, CAD,
COMT and CCoAMT) hybridized complementary RNAs at
increasing amounts from 2 to 8 hrs post inoculation in
concurrence with the HR as indicated by the ratios marked
in bold type. The highest transcript level increases were
detected for the ESTs of CHS, CHR, CHI, IFS1&2, IOMT
and IFR1 genes, all involved in the synthesis of isoflavanone-phytoalexins as shown in Figure 1. Significant but
more moderate increases were measured for PAL, C4H,
4CL, CCR, CAD, COMT and CCoAMT ESTs. Enzymes
encoded by the corresponding genes function upstream of
CHS, and CCR, CAD, COMT and CCoAMT drive the synthesis of lignin. In contrast, transcripts of genes encoding
enzymes that function downstream of CHI, directing the
synthesis of flavonols, anthocyanins and proanthocyanidins (F3H, DFR, LDOX and FLS) decreased in abundance
significantly prior to 8 hrs post inoculation. This is indicated by hybridization ratios lower than 0.67x (1.5
decrease) (in italics) which reflect a decrease in transcript
accumulation due to the response to the avirulent pathogen. Interestingly, F3'H transcripts appeared to accumulate significantly by 24 hrs after inoculation according to
the microarray data. RNA blots, to be presented later, confirm the observation that F3'H transcripts accumulate
much later during the HR response.
Transcript profiles of eighteen soybean phenylpropanoid
pathway genes during the early response to Pseudomonas
syringae pv glycinea infection
In an earlier study undertaken to analyze a global differential gene expression during the resistant (HR) versus
susceptible responses in leaves of soybean plants inoculated with Psg with or without avrB, soybean cDNA microarrays [18] were used [11]. Among the 27,648 cDNAs
analyzed there was a subset of cDNAs representing 19
genes of the phenylpropanoid pathway in soybean as diagramed in Figure 1. The resulting transcript profiles of this
cDNA subset were examined here in further detail and
compared to one another to gain an understanding of the
timing in transcript accumulation changes occurring during the early hours post inoculation.
Table 1 summarizes the hybridization ratios resulting
from comparisons between dual hybridizations of RNAs
extracted from leaves of plants infiltrated with Psg carrying
avrB (HR) and compared to those RNAs from plants infiltrated with MgCl2 at three time points post inoculations
(2, 8 and 24 hrs) and labeled as T2HR, T8HR, and T24HR
respectively. Hybridization ratios greater than 1.5 fold are
written in bold type indicating an increase in transcript
accumulation due to the plant's hypersensitive response
to the avirulent pathogen (Psg) (rather than to the stress
provoked by the infiltration process itself) while those in
italics indicate a 1.5 fold or greater decrease (<0.67x) in
the transcript abundance between the two treatments. The
hybridization ratios resulting from comparing RNAs of
leaves infiltrated with Psg lacking avrB (virulent strain) to
RNAs from plants infiltrated with MgCl2 also at three time
points post inoculation (2, 8, and 24 hrs) are labeled as
T2VIR, T8VIR, and T24VIR (Table 1). With some exceptions, increases in transcript abundance were found in
both conditions, but were generally more robust in plants
undergoing the HR mediated by the avirulent pathogen
than in those showing the susceptible response to the virulent pathogen strain.
For most of the 19 genes (Table 1, 1st column) multiple
ESTs representing a given gene or gene family were printed
in the soybean microarrays. The gene description of each
EST was based on GenBank assignments [18] and TIGR
(The Institute for Genomic Research) databases annotations as well as sequence analysis and gene identification
in our laboratory [19-21]. The 3' and 5' clone IDs of the
EST's are listed in Table 1, columns, 2 and 3 respectively.
Those representing a given gene have been grouped in the
same or different TC (Table 1, column 4) according to the
The benzoic acid 2-hydroxylase (BA2H) gene is predicted
to exist in plants such as tobacco, cucumber and potato
and encode an enzyme that leads to the synthesis of salicylic acid (SA) from benzoic acid (Figure 1) [22,23]. However, a BA2H gene has yet to be identified and cloned from
any plant. Consequently, no soybean EST has been annotated as BA2H and therefore we could not analyze the
overall response of this putative gene during pathogen
infection. In Arabidopsis it has been shown that SA is synthesized in the chloroplast from chorismate by means of
isochorismate synthase (ICS) [24]. Because only one
cDNA from this branch of the phenylpropanoid pathway
(clone Gm-r1088-2662 annotated as a possible ICS gene)
was present on the arrays used in this study and its expression did not significantly change (fdr p-value ranged from
0.37 to 0.97) during the course of the experiment, we were
unable to analyze categorically the transcript profiles of
this possible SA branch of the phenylpropanoid pathway.
Overall, considerable rapid transcript increases occurred
for those genes working in the pathway leading to the synthesis of isoflavones/isoflavanones-phytoalexins. These
were followed, with lower transcript ratio increments, by
those genes involved in lignin biosynthesis. The F3'H
Page 4 of 18
(page number not for citation purposes)
3'-Clone ID
5'-Clone ID
5' or 3' TIGR TC
Phenylalanine ammonia-lyase (PAL)
Phenylalanine ammonia-lyase (PAL)
Phenylalanine ammonia-lyase (PAL)
Phenylalanine ammonia-lyase (PAL)
Phenylalanine ammonia-lyase (PAL)
Phenylalanine ammonia-lyase (PAL)
Gm-r1088-2170
Gm-r1070-3081
Gm-r1021-3996
Gm-b10BB-2
Gm-r1083-3853
Gm-r1070-4771
Gm-c1027-2831
Gm-c1015-4781
Gm-c1004-9203
Gm-c1062-1285
Gm-c1028-6208
Gm-c1016-5168
Cinnamate 4 hydroxylase (C4H)
Cinnamate 4 hydroxylase (C4H)
Cinnamate 4 hydroxylase (C4H)
Cinnamate 4 hydroxylase (C4H)
Gm-r1021-162
Gm-r1021-1649
Gm-r1021-3590
Gm-r1083-1942
4-coumarate:CoA ligase (4CL)
4-coumarate:CoA ligase (4CL)
4-coumarate:CoA ligase (4CL)
4-coumarate:CoA ligase (4CL)
4-coumarate:CoA ligase (4CL)
4-coumarate:CoA ligase (4CL)
4-coumarate:CoA ligase (4CL)
4-coumarate:CoA ligase (4CL)
4-coumarate:CoA ligase (4CL)
4-coumarate:CoA ligase (4CL)
4-coumarate:CoA ligase (4CL)
4-coumarate:CoA ligase (4CL)
4-coumarate:CoA ligase (4CL)
4-coumarate:CoA ligase (4CL)
4-coumarate:CoA ligase (4CL)
4-coumarate:CoA ligase (4CL)
4-coumarate:CoA ligase (4CL)
BMC Plant Biology 2006, 6:26
Gene Description
T2HR
T8HR
T24HR
T2VIR
T8VIR
TC225162
TC216854
TC225162
TC225162
TC225168
NA
2.46
6.23
2.44
3.39
3.39
3.18
1.93
3.81
2.26
2.80
2.62
3.14
1.05
2.67
1.68
2.19
Gm-c1004-446
Gm-c1004-3560
Gm-c1004-8721
Gm-c1028-893
TC204339
TC204341
TC204341
TC204341
4.76
1.97
2.58
3.43
1.67
Gm-r1021-2611
Gm-r1083-3061
Gm-r1083-3414
Gm-r1070-5094
Gm-r1021-2223
Gm-r1021-3419
Gm-r1070-3141
Gm-r1070-7534
Gm-r1083-4331
Gm-r1070-3331
Gm-r1083-2896
Gm-r1083-4078
Gm-r1070-2770
Gm-r1070-2942
Gm-r1083-1803
Gm-r1083-779
Gm-r1070-515
Gm-c1004-5129
Gm-c1028-3891
Gm-c1028-4979
Gm-c1016-6727
Gm-c1004-4431
Gm-c1004-7053
Gm-c1015-4689
Gm-c1029-1150
Gm-c1028-7642
Gm-c1015-4673
Gm-c1028-3421
Gm-c1028-6958
Gm-c1015-4573
Gm-c1015-3925
Gm-c1013-3118
Gm-c1009-3084
Gm-c1008-190
TC205641
TC205641
TC205641
TC216082
TC216190
TC216190
TC216191
TC220028
TC224198
TC225974
TC226636
TC226636
TC226637
NA
TC229241
TC221808
TC223132
2.13
3.20
2.01
1.67
1.75
2.36
‡
3.23
2.93
6.32
2.60
5.28
7.06
1.77
0.13
0.34
0.37
Chalcone synthase (CHS)
Chalcone synthase (CHS)
Chalcone synthase (CHS)
Chalcone synthase (CHS)
Chalcone synthase (CHS)
Chalcone synthase (CHS)
Chalcone synthase (CHS)
Chalcone synthase (CHS)
Chalcone synthase (CHS)
Chalcone synthase (CHS)
Chalcone synthase (CHS)
*Gm-b10BB-5
Gm-b10BB-6
Gm-r1021-84
Gm-b10BB-7
Gm-r1083-83
Gm-r1088-5931
Gm-b10BB-4
Gm-r1070-3019
Gm-b10BB-3
Gm-r1083-556
Gm-r1083-853
Genomic clone
Gm-c1004-1721
Gm-c1004-874
Gm-c1004-2866
Gm-c1009-670
Gm-c1065-3606
Gm-c1028-2741
Gm-c1015-4593
Gm-c1013-1524
Gm-c1009-2808
Gm-c1009-4010
NA
TC203259
TC203259
TC203319
TC209602
TC209886
TC214314
TC214387
TC214443
TC226663
NA
Chalcone reductase (CHR)
Gm-r1021-1257
Gm-c1004-2376
TC225256
1.07
4.92
2.16
1.59
1.93
T24VIR
2.07
2.25
1.25
1.89
1.84
1.97
2.50
1.49
1.61
9.45
2.89
1.57
2.17
1.65
1.80
1.54
1.88
2.53
2.20
2.13
4.96
2.36
0.43
0.36
0.29
36.35
48.80
30.70
34.39
48.84
20.25
60.58
36.76
44.57
23.10
30.91
13.22
63.70
37.53
50.20
33.82
15.56
23.88
17.75
17.35
20.97
31.56
11.39
31.12
1.28
1.84
1.87
1.60
1.45
1.85
0.61
1.83
3.31
1.49
2.07
1.61
2.16
1.56
1.53
0.54
12.47
20.48
9.06
14.32
10.48
3.25
17.92
6.77
10.28
7.36
5.24
7.15
16.68
7.21
15.41
11.39
3.36
3.48
9.59
2.91
6.15
8.40
4.41
Page 5 of 18
Ratio treatment vs MgCl2 controla
(page number not for citation purposes)
/>
Table 1: Soybean phenylpropanoid pathway genes responsive to infection by Pseudomonas syringae with (HR) or without (VIR) avrB
Gm-c1004-1818
Gm-c1004-8921
Gm-c1004-5030
Gm-c1004-1771
Gm-c1027-5959
Gm-c1062-753
TC215169
TC215169
TC215169
TC225256
TC203399
TC203399
7.01
12.17
8.94
8.82
0.23
0.11
18.77
23.51
18.25
32.00
0.13
0.10
3.94
3.93
4.82
3.14
Chalcone isomerase (CHI)
Chalcone isomerase (CHI)
Chalcone isomerase (CHI)
Chalcone isomerase (CHI)
Chalcone isomerase (CHI)
Chalcone isomerase (CHI)
Chalcone isomerase (CHI)
Chalcone isomerase (CHI)
Chalcone isomerase (CHI)
Chalcone isomerase (CHI)
Gm-r1021-1566
Gm-r1021-154
Gm-r1083-3171
Gm-r1021-1440
Gm-b10BB-9
Gm-r1083-43
Gm-r1070-1290
Gm-r1083-4382
Gm-r1088-8117
Gm-r1070-3127
Gm-c1004-3954
Gm-c1004-613
Gm-c1028-4494
Gm-c1004-3529
Gm-c1026-2606
Gm-c1009-620
Gm-c1010-653
Gm-c1028-7808
Gm-c1072-871
Gm-c1015-4783
TC205496
TC205496
TC205496
TC205536
TC205536
TC206681
TC216488
TC216488
TC227583
NA
21.11
10.93
6.87
8.63
11.42
12.30
2.89
20.68
5.17
2.14
10.70
6.28
3.20
13.45
12.79
16.45
3.94
7.21
4.23
2.39
1.71
1.41
0.61
Isoflavone synthase (IFS1)
Isoflavone synthase (IFS1)
Isoflavone synthase (IFS1)
Isoflavone synthase (IFS1)
*Gm-10BB-30
Gm-r1088-8309
Gm-r1021-1181
Gm-r1088-1867
Gm-c1059-264
Gm-c1072-1106
Gm-c1004-3075
Gm-c1027-2050
NA
TC204648
TC215321
TC218468
11.09
4.72
7.01
3.94
8.35
1.39
5.82
4.50
1.47
*Gm-b10BB-29
Gm-r1083-3218
Gm-c1027-870
Gm-c1028-4877
TC204612
TC204612
17.30
15.24
13.84
20.97
isoflavone 7-o-methyltransferase (IOMT)
isoflavone 7-o-methyltransferase (IOMT)
isoflavone 7-o-methyltransferase (IOMT)
isoflavone 7-o-methyltransferase (IOMT)
isoflavone 7-o-methyltransferase (IOMT)
Gm-r1021-2837
Gm-r1088-8483
Gm-r1088-8769
Gm-r1021-435
Gm-r1021-2886
Gm-c1004-6344
Gm-c1074-35
Gm-c1074-599
Gm-c1004-1004
Gm-c1004-6334
TC206764
TC206765
TC210019
TC215839
TC215839
53.45
58.89
78.25
5.28
9.06
48.17
112.99
95.67
4.89
10.27
Isoflavone reductase (IFR1)
Isoflavone reductase (IFR1)
Isoflavone reductase (IFR1)
Isoflavone reductase (IFR1)
Isoflavone reductase (IFR1)
Isoflavone reductase (IFR1)
Isoflavone reductase (IFR1)
Isoflavone reductase (IFR1)
Gm-r1021-2052
Gm-r1070-7511
Gm-b10BB-33
Gm-r1088-4139
Gm-r1088-8260
Gm-r1070-6760
Gm-r1021-3760
Gm-r1083-4951
Gm-c1004-4918
Gm-c1023-366
Gm-c1019-3319
Gm-c1027-9301
Gm-c1072-1589
Gm-c1019-3354
Gm-c1004-8266
Gm-c1028-8510
TC206041
TC207832
TC207832
TC215002
TC215002
TC215005
TC226270
TC226270
15.45
16.00
24.67
14.42
15.35
50.21
41.64
28.84
9.58
4.00
31.57
24.76
7.52
55.33
43.11
32.22
Flavonoid 3'-hydroxylase (F3'H)
Flavonoid 3'-hydroxylase (F3'H)
Gm-b10BB-22
*Gm-b10BB-23
Gm-c1053-348
Gm-c1019-10961
TC216289
NA
1.47
0.45
1.96
1.70
Flavanone 3-hydroxylase (F3H)
Flavanone 3-hydroxylase (F3H)
*Gm-b10BB-12
Gm-b10BB-13
Gm-c1012-683
Gm-c1019-2646
TC226020
TC226020
0.06
0.24
0.07
0.18
Dihydroflavonol 4-reductase (DFR)
Dihydroflavonol 4-reductase (DFR)
Dihydroflavonol 4-reductase (DFR)
Dihydroflavonol 4-reductase (DFR)
Dihydroflavonol 4-reductase (DFR)
Dihydroflavonol 4-reductase (DFR)
Gm-r1070-8296
Gm-r1021-3500
Gm-r1083-1327
Gm-r1088-7258
Gm-r1070-7401
Gm-r1083-2198
Gm-r1030-1389
Gm-c1004-8647
Gm-c1013-1350
Gm-c1067-1717
Gm-c1019-4941
Gm-c1028-1633
TC225293
TC225293
TC225294
TC234668
TC210161
TC218842
0.17
0.17
0.16
0.12
4.63
4.92
0.26
0.26
0.14
0.20
9.99
Leucoanthocyanidin dioxygenase (LDOX)
Gm-r1070-1246
Gm-c1010-216
TC217747
9.96
2.20
4.24
3.20
2.38
0.41
5.82
3.68
2.00
4.63
6.30
5.28
2.03
2.51
2.06
3.58
7.47
4.32
1.85
3.23
5.40
2.14
5.03
2.25
3.79
1.61
1.37
8.12
6.41
7.06
6.82
7.16
19.29
1.40
1.84
5.35
8.28
4.14
4.23
4.50
1.47
6.11
5.13
2.81
67.71
49.21
2.89
6.50
5.90
18.64
6.77
4.56
‡
0.76
3.23
4.06
7.89
0.80
0.67
0.50
5.50
Page 6 of 18
Gm-r1021-720
Gm-r1021-4150
Gm-r1021-2517
Gm-r1021-754
Gm-r1088-2718
Gm-b10BB-36
Isoflavone synthase (IFS2)
Isoflavone synthase (IFS2)
BMC Plant Biology 2006, 6:26
Chalcone reductase (CHR)
Chalcone reductase (CHR)
Chalcone reductase (CHR)
Chalcone reductase (CHR)
Chalcone reductase (CHR)
Chalcone reductase (CHR)
(page number not for citation purposes)
/>
Table 1: Soybean phenylpropanoid pathway genes responsive to infection by Pseudomonas syringae with (HR) or without (VIR) avrB (Continued)
Page 7 of 18
Gm-r1070-7484
Gm-r1021-2183
Gm-c1029-932
Gm-c1004-4454
TC214271
TC232276
0.38
1.39
0.35
Flavonol synthase (FLS)
Flavonol synthase (FLS)
Flavonol synthase (FLS)
Gm-b10BB-15
Gm-r1070-4167
Gm-r1083-823
Gm-c1016-13124
Gm-c1016-3181
Gm-c1009-3205
NA
TC208467
TC218780
0.51
0.52
0.51
Cynnamoyl CoA reductase (CCR)
Cynnamoyl CoA reductase (CCR)
Cynnamoyl CoA reductase (CCR)
Cynnamoyl CoA reductase (CCR)
Cynnamoyl CoA reductase (CCR)
Cynnamoyl CoA reductase (CCR)
Cynnamoyl CoA reductase (CCR)
Cynnamoyl CoA reductase (CCR)
Gm-r1021-2461
Gm-r1021-523
Gm-r1021-2593
Gm-r1070-3838
Gm-r1088-8005
Gm-r1070-1367
Gm-r1070-914
Gm-r1070-2653
Gm-c1004-5052
Gm-c1004-1463
Gm-c1004-5056
Gm-c1016-1700
Gm-c1072-6
Gm-c1008-2980
Gm-c1008-1235
Gm-c1015-2660
TC226044
TC204998
TC226045
TC226917
TC233163
TC207664
TC225292
TC225293
4.00
3.63
3.39
7.41
5.82
0.10
0.16
0.19
2.66
2.71
1.56
2.64
3.34
2.14
1.79
Cynnamyl alcohol dehydrogenase (CAD)
Cynnamyl alcohol dehydrogenase (CAD)
Cynnamyl alcohol dehydrogenase (CAD)
Cynnamyl alcohol dehydrogenase (CAD)
Cynnamyl alcohol dehydrogenase (CAD)
Cynnamyl alcohol dehydrogenase (CAD)
Cynnamyl alcohol dehydrogenase (CAD)
Cynnamyl alcohol dehydrogenase (CAD)
Cynnamyl alcohol dehydrogenase (CAD)
Gm-r1083-4523
Gm-r1021-3795
Gm-r1083-2221
Gm-r1021-1331
Gm-r1021-2196
Gm-r1070-5855
Gm-r1083-1322
Gm-r1083-3802
Gm-r1083-4013
Gm-c1028-7532
Gm-c1004-7796
Gm-c1028-695
Gm-c1004-3272
Gm-c1004-5210
Gm-c1019-927
Gm-c1013-1592
Gm-c1028-6101
Gm-c1028-6963
TC225589
TC204437
TC206457
TC225589
TC225589
TC227395
TC230620
TC208568
TC225589
2.13
1.51
12.73
1.99
1.93
0.56
1.52
2.55
0.72
0.56
0.32
0.30
Caffeic acid O methyltransferase (COMT)
Caffeic acid O methyltransferase (COMT)
Caffeic acid O methyltransferase (COMT)
Caffeic acid O methyltransferase (COMT)
Caffeic acid O methyltransferase (COMT)
Caffeic acid O methyltransferase (COMT)
Caffeic acid O methyltransferase (COMT)
Caffeic acid O methyltransferase (COMT)
Caffeic acid O methyltransferase (COMT)
BMC Plant Biology 2006, 6:26
Leucoanthocyanidin dioxygenase (LDOX)
Leucoanthocyanidin dioxygenase (LDOX)
Gm-r1083-548
Gm-r1083-3458
Gm-r1021-973
Gm-r1083-2739
Gm-r1083-3457
Gm-r1083-2949
Gm-r1070-1306
Gm-r1070-1869
Gm-r1070-3522
Gm-c1009-2413
Gm-c1028-5510
Gm-c1004-2186
Gm-c1028-2911
Gm-c1028-5374
Gm-c1028-2922
Gm-c1008-2760
Gm-c1015-70
Gm-c1016-846
TC212974
TC219214
TC226262
TC226263
TC226265
TC226997
TC203610
TC203610
TC203610
2.30
11.31
0.19
0.18
0.14
Caffeoyl Co-A transferase (CCoAMT)
Caffeoyl Co-A transferase (CCoAMT)
Caffeoyl Co-A transferase (CCoAMT)
Caffeoyl Co-A transferase (CCoAMT)
Caffeoyl Co-A transferase (CCoAMT)
Caffeoyl Co-A transferase (CCoAMT)
Caffeoyl Co-A transferase (CCoAMT)
Caffeoyl Co-A transferase (CCoAMT)
Caffeoyl Co-A transferase (CCoAMT)
Caffeoyl Co-A transferase (CCoAMT)
Caffeoyl Co-A transferase (CCoAMT)
Gm-r1021-3573
Gm-r1070-3714
Gm-r1070-6767
Gm-r1083-141
Gm-r1083-4593
Gm-r1021-1921
Gm-r1070-6093
Gm-r1070-5202
Gm-r1088-8678
Gm-r1083-956
Gm-r1021-427
Gm-c1004-7957
Gm-c1016-1000
Gm-c1019-3293
Gm-c1009-796
Gm-c1028-8263
Gm-c1004-4301
Gm-c1019-1156
Gm-c1016-6589
Gm-c1074-1097
Gm-c1009-4174
Gm-c1004-1316
TC204613
TC204614
TC213310
TC215141
TC225342
TC225343
TC228561
TC228561
TC228993
TC225339
TC225339
1.85
1.92
4.79
3.46
1.93
1.67
2.69
2.13
4.69
0.62
0.45
1.48
0.21
2.25
0.73
0.82
0.39
0.24
1.54
3.27
0.10
0.15
0.15
0.61
0.44
0.43
0.56
0.60
0.59
0.76
1.46
1.52
1.52
1.72
1.28
1.65
1.88
1.96
2.41
6.87
2.17
18.13
0.50
0.44
1.32
3.36
1.54
2.73
2.62
0.73
2.25
1.89
2.01
2.07
2.85
9.85
0.09
0.10
0.10
2.06
8.06
1.34
2.07
0.56
1.27
1.14
3.48
0.83
(page number not for citation purposes)
/>
Table 1: Soybean phenylpropanoid pathway genes responsive to infection by Pseudomonas syringae with (HR) or without (VIR) avrB (Continued)
BMC Plant Biology 2006, 6:26
gene that encodes an enzyme involved in the synthesis of
flavones is unique in its response in that it showed a relatively delayed increase in transcript accumulation.
An offshoot of this microarray data analysis was the dual
and opposite response for two subsets of ESTs for many of
the pathway members, where one cDNA subset showed
significant increases in transcript accumulation during the
HR while the second subset showed a decrease (see Table
1). In the case of DFR and CCR, the increasing ratios of
one of the subsets (bold type) and the decreasing ratios of
the second subset (in italics) are so clearly distinct that it
suggests the existence of two genes, perhaps two family
members with diverse functionality, subcellular localization, or tissue specific activation/regulation. In three
instances (CHR, COMT and CCoAMT) ESTs from a specific TC (TC203399, TC203610 and TC225339 respectively) show the reciprocal response setting them apart
from the rest of the ESTs with the same annotations.
Single gene transcript analysis of the phenylpropanoid
pathway over a 53-hour time course post inoculation
For a more in depth analysis of the transcriptional activity
of the soybean pathogen responsive genes of the phenylpropanoid pathway, RNA blots containing RNAs
extracted from inoculated plants at 0, 2, 4, 8, 12, 24, 36,
53 hrs post inoculation were hybridized with single gene
EST probes corresponding to cloned, well characterized
soybean genes encoding key enzymes of the multiple
branches of the phenylpropanoid pathway. An exception
to this was the cynnamyl alcohol dehydrogenase (CAD)
gene that has not been cloned or sequenced in soybean
but for which there are multiple soybean ESTs annotated
as CAD in the GenBank and TIGR databases. These annotations were based on sequence similarities to CAD genes
from Medicago, Arabidopsis, cowpea, Oryza sativa and other
species, with an end result of multiple soybean CAD ESTs
belonging to multiple tentative contigs (TCs). A soybean
EST (AW568106, Gm-r1030-4089, TC 204440) was chosen as a putative representative of a soybean CAD gene
based on the 88.83% identity and 95.13% similarity of its
TC to a Medicago sativa CAD ortholog [25].
1. Cynnamylalcohol dehydrogenase (CAD)
Using the putative CAD cDNA clone described above as a
probe, the relative transcript abundance of this gene and
possibly other CAD family members was determined in
portions of leaf tissue harvested at 0, 2, 4, 8, 12, 24, 36 and
53 hrs after inoculating plants with Psg with or without
avrB. To assess the effect of the physical and metabolic
stress caused by the infiltration protocol itself on CAD
induction, a parallel blot with RNAs extracted from leaf
tissues infiltrated with MgCl2 solution devoid of pathogen
was probed and used as the base line reference.
/>
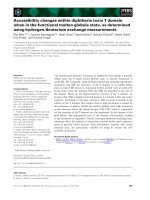
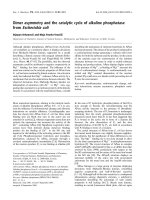
Figure 2 summarizes the hybridization results obtained
with the CAD gene probe. Infiltration with just MgCl2
solution induced CAD transcript accumulation by the 2 hr
time point decreasing rapidly to almost pre-inoculation
(time 0) levels at the 4 hr measurement. In contrast,
higher increases in transcript accumulation were observed
in tissues infiltrated with Psg-avrB. The very high transcript
accumulation observed at the 2 hr measurement may be
in part due to a stress response incited by the vacuum infiltration per se since in the MgCl2 infiltration control treatment considerable amount of transcript was also
measured at 2 hr post infiltration (Figure 2). In Psg-avrB
infected tissues, the initial expression burst (2 hr) was followed by slight decreases from 4 to 12 hr after which a second increase in transcript accumulation was observed at
24, 36 and 53 hrs. The CAD hybridization to RNAs from
tissues infiltrated with the Psg-vir or MgCl2 alone, showed
similar patterns but with slightly higher intensities with
Psg-vir RNAs (Figure 2).
The RNA blot hybridization results shown in Figure 2
agree with those obtained in the microarray analysis for a
subset of CAD cDNAs showing higher hybridization
ratios at 8 and 24 hrs post inoculation relative to values of
MgCl2 infiltrated plants (Table 1).
2. Chalcone synthase (CHS)
A genomic CHS cloned fragment (pC2H2.0, Gm-bBB-5 in
Table 1), [26] with homology to all 8 CHS genes was used
0 2 4
avrB
8 12 24 36 53 hrs
- 1.4 Kb
- 25 S
vir
- 1.4 Kb
- 25 S
MgCl2
- 1.4 Kb
- 25 S
Figure 2
file
Cynnamyl alcohol dehydrogenase (CAD) RNA (1.4 kb) proCynnamyl alcohol dehydrogenase (CAD) RNA (1.4
kb) profile. Measurements made at 8 intervals through a 53
hr period in response to infection by Pseudomonas syringae pv
glycinea with avrB (avrB) or without (vir) (First and second
panels respectively). Third panel is the CAD RNA profile in
response to infiltration with control medium (MgCl2). Dark
background sub-panels are the 25 S ribosomal RNAs from
corresponding ethidium bromide-stained gels prior to membrane transfer and shown to compare sample loading. Gmr1030-4089 soybean cDNA clone was used as probe.
Page 8 of 18
(page number not for citation purposes)
BMC Plant Biology 2006, 6:26
/>
in hybridizations to RNA blots containing RNAs extracted
from plants infiltrated with 1) avirulent pathogen (PsgavrB), 2) virulent pathogen (Psg-vir) and 3) MgCl2 control
solution. As shown in Figure 3, infiltration of leaf tissues
with MgCl2 alone had very little effect on CHS transcript
induction. Plants infiltrated with the virulent pathogen
revealed high levels of CHS induction particularly at the
24 hr time measurement. However, plants infiltrated with
the avirulent Psg-avrB displayed much higher levels of
hybridization starting as early as 4 hrs post inoculation.
These results support the involvement of one or more
CHS genes in the rapid HR mounted by the plant to
defend itself from the invading pathogen, as well as a later
involvement of CHS in efforts to defend against a virulent
pathogen.
The hybridization results obtained for this genomic
(pC2H2.0, Gm-b10BB-5) and other CHS cDNA clones in
the microarray experiments (Table 1) are in accordance
with the RNA blot data, showing very high hybridization
ratios, in some cases, as high as 49 and 64 fold at 8 and 24
hrs post infiltration.
An interesting observation is the lower amounts of CHS
transcripts detected at 12 and 36 hrs data points. In those
two instances, the leaf tissues from which those RNAs
were extracted were harvested at 10:45 and 10:55 PM
0 2 4
avrB
8 12 24 36 53 hrs
- 1.4 Kb
- 25S
vir
- 1.4 Kb
- 25S
MgCl2
- 1.4 Kb
- 25S
Figure 3
Chalcone synthase (CHS) RNA (1.4 kb) profile
Chalcone synthase (CHS) RNA (1.4 kb) profile. Measurements made at 8 intervals through a 53 hr period in
response to infection by Pseudomonas syringae pv glycinea
with avrB (avrB) or without (vir) (First and second panels
respectively). Third panel is the CHS RNA profile in
response to infiltration with control medium (MgCl2). Dark
background sub-panels are the 25 S ribosomal RNAs from
corresponding ethidium bromide-stained gels prior to membrane transfer and shown to compare sample loading. The
soybean CHS genomic clone (pC2H2.0, Gm-b10BB-5) was
used as probe.
respectively. Eleven PM was the time at which the lights in
the growth chamber turned off. This result indicates that
towards the end of the diurnal cycle either there was a
reduction in the amount of transcripts being synthesized
or that certain CHS transcripts were targeted for degradation.
A delayed induction of CHS genes with transcript accumulation that peaked at about 4 hrs after fungal elicitor addition, compared to the more rapid induction of a CAD
gene showing maximum transcript accumulation at 2 hrs,
had been observed also in Phaseolus vulgaris cell cultures
[27,28]. The faster induction of the CAD gene seems to be
due to a transient stress response to the vacuum infiltration per se as was described earlier (Figure 2). On the other
hand, we observed a difference in the sustained high levels
of CHS transcript accumulation up to 53 hrs when compared to what had been observed in alfalfa leaves infected
with P. syringae pv. pisi, where the levels of CHS transcripts
peaked at 6 hr and declined rapidly to about 20% of peak
value by 48 hr post inoculation [29,30].
3. Isoflavone synthase (IFS)
Two soybean IFS genes (IFS1 and IFS2) have been identified, cloned and sequenced [14]. The corresponding EST
clones (Gm-c1059-264 and Gm-c1027-870) from the
soybean EST collection [31] were chosen to be printed on
the soybean cDNA microarrays analyzed in this study and
to be used as probes for study with the RNA blots.
Isoflavone synthase is a key enzyme in the synthesis of
soybean isoflavones (daidzein, genistein, glycitein) and
the defense inducible phytoalexins such as coumestans
and pterocarpans (glyceollins) [32]. IFS genes are
expressed preferentially in the roots and cotyledons of the
soybean plants under normal growing conditions (Figure
4A and 4B). In the cotyledons, the highest level of expression occurs at the time when they transition from the
green (fully expanded, 400–500 mg fresh weight) to the
yellow (dehydrating, 200–300 mg fresh weight) stages of
late cotyledon development during seed maturation (Figure 4B), which precedes the synthesis of isoflavones
found when the seeds mature as measured by Dhaubhadel et al. [17].
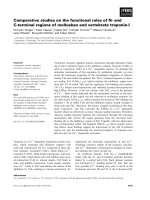
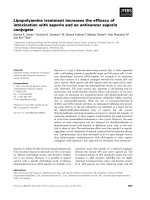
Figure 5 shows a rapid accumulation of IFS transcripts by
2 hrs after inoculation with Psg with or without the avrB
gene. Although the virulent pathogen incites a response of
the IFS gene(s), it is not maintained at the same level as
the one provoked by the avirulent pathogen. Larger
amounts of transcripts were detected after the 4 hr time
point in leaves infiltrated with Psg-avrB (Figure 5). Similar
to what was observed in the CHS transcript accumulation
time course, the amount of IFS transcripts was reduced at
12 and 36 hours post inoculation and as mentioned
Page 9 of 18
(page number not for citation purposes)
0
Cotyle
dons
Seed
coats
Stem
s
Roots
A
/>
Shoo
t tips
Matur
e leav
es
Flowe
r bud
s
BMC Plant Biology 2006, 6:26
avrB
- 1.7 kb
>200
25-50
50-75
50-75
100-200
25-50
- 25 S
Seed fresh weight (mg)
Seed fresh weight (mg)
25
-50
75
-10
0
10
0-2
00
40
0-5
00
20
0-3
0
Dry 0
see
d
IFS
8 12 24 36 53 hrs
- 1.7 Kb
- 25 S
IFS
B
2 4
-1.7 Kb
vir
- 1.7 Kb
- 25 S
Figure 5
Isoflavone synthase (IFS) RNA (1.7 kb) profile
Isoflavone synthase (IFS) RNA (1.7 kb) profile. Measurements made at 8 intervals through a 53 hr period in
response to infection by Pseudomonas syringae pv glycinea
with avrB (avrB) or without (vir) (First and second panels
respectively). Dark background sub-panels are the 25 S
ribosomal RNAs from corresponding ethidium bromidestained gels prior to membrane transfer and shown to compare sample loading. The Gm-c1059-264 soybean cDNA
clone was used as probe.
- 25 S
Green
Yellow
Figure 4 synthase (IFS)
max, cultivar Williams tissue-specific expression in Glycine
Isoflavone
Isoflavone synthase (IFS) tissue-specific expression in
Glycine max, cultivar Williams. (A) IFS transcripts (1.7
kb) detected in a RNA blot containing 10 µg of total RNA
samples purified from roots, stems, shoot tips, mature leaves,
flower buds, seed coats and cotyledons of soybean plants, cv.
Williams 82. Seed coats and cotyledons from three different
stages of seed development were used. Seed fresh weight in
milligrams is shown at bottom. (B) Expression of IFS in the
cotyledon of Glycine max, cv. Williams through seed development. The 25 S ribosomal RNAs from the ethidium bromidestained gel prior to membrane transfer are shown in the dark
background sub-panels to compare RNA sample loading. The
Gm-c1059-264 soybean cDNA clone was used as probe.
above, the tissues used for the RNA extractions of these
two data points were harvested at the end of the diurnal
cycle. These results suggest that transcription or transcript
accumulation/degradation of CHS and IFS genes may be
affected by the diurnal cycle.
The IFS hybridization results obtained with the RNA blots
containing RNAs from plants infected with the avirulent
pathogen (Figure 5) are in agreement with those already
described in the microarrays experiment section (Table 1).
The latter results showed hybridization ratios at 8 and 24
hrs post infiltration much higher than at 2 hrs for those
cDNAs representing both IFS1 and IFS2 genes.
4. Flavonoid 3' hydroxylase (F3'H)
The soybean F3'H gene was identified and its expression
characterized recently in our laboratory [19]. Two of sev-
eral complete cDNA clones from the soybean EST collection, Gm-c1012-683 and Gm-c1019-10961, were chosen
to represent the F3'H gene when printing the microarrays
and to be used as probes for the RNA blot analysis of the
response of this gene to pathogen infection.
The F3'H gene was found to be strongly expressed in seed
coats at early stages of development and very poorly in all
other tissues including the cotyledons [19]. The low level
of expression of this gene in the mature leaves can be seen
also in the RNA blots shown in Figure 6 at the 0 data
points which represent the status of the leaf tissue prior to
infiltration with the pathogen or MgCl2 alone. Leaves
infiltrated with the virulent pathogen showed a slight
accumulation of F3'H transcripts compared to those
treated with MgCl2 alone, but very minimal compared to
the larger amounts accumulated by the leaves of plants
inoculated with the avirulent pathogen. Starting at about
2–8 hours F3'H accumulated increasingly to high levels at
36–53 hrs post inoculation.
These results suggest that F3'H, an enzyme that adds a
hydroxyl group to the 3' position of the B-ring of naringenin and dihydrokaempferol to generate eridictyol and
dihydroquercetin respectively, may play a role in the cascade of reactions elicited during defense. Flavones and flavonols are secondary metabolites derived from eridictyol
and dihydroquercetin by the intervention of flavone synthases (FS1 and FS2) and flavonol synthase (FLS) respectively (Figure 1). Putative soybean flavanol synthase (FLS)
ESTs were printed on the microarrays analyzed in this
study but the hybridization ratios 2, 8 and 24 hrs after PsgavrB infection are very low and appeared to decrease with
time. This decrease may indicate that flavonols have little
Page 10 of 18
(page number not for citation purposes)
BMC Plant Biology 2006, 6:26
0 2 4
avrB
/>
0 2 4
8 12 24 36 53 hrs
-1.8 kb
avrB
-1.8 kb
- 25 S
MgCl2
-1.8 kb
- 25 S
Figure 6
Flavonoid 3'-hydroxylase (F3'H) RNA (1.8 kb) profile
Flavonoid 3'-hydroxylase (F3'H) RNA (1.8 kb) profile.
Measurements made at 8 intervals through a 53 hr period in
response to infection by Pseudomonas syringae pv glycinea
with avrB (avrB) or without (vir) (First and second panels
respectively). Third panel is the F3'H RNA profile in
response to infiltration with control medium (MgCl2). Dark
background sub-panels are the 25 S ribosomal RNAs from
corresponding ethidium bromide-stained gels prior to membrane transfer and shown to compare sample loading. Gmc1019-10961 soybean cDNA clone was used as probe.
or no role in defense. If that were the case in soybean the
apparent increase in F3'H transcripts upon inoculation
may be directed towards increased synthesis of flavones
(apigenin and luteolin). Induction of flavone synthesis
has been observed in soybean cell cultures upon osmotic
stress, which to some extent mimics the effect of a fungal
elicitor [33,34].
5. Flavanone 3 hydroxylase (F3H)
Differential hybridization to soybean microarrays of
flower buds RNAs from a pink flower mutant and a purple
flower isoline was instrumental in the identification of the
Wp locus as a flavanone 3 hydroxylase gene [21]. The two
cDNA clones that were over expressed in the purple
flower, Gm-c1012-683 and Gm-c1019-2646, were used as
tools in the identification and characterization of two very
similar soybean F3H genes (F3H1 and F3H2). F3H1 is
expressed strongly in seed coats of Wp plants, more
weakly in flower buds and shoot tips (meristem and
young leaves) but barely detectable expression by RNA
blots in cotyledons and roots [21]. In contrast, the F3H2
gene does not seem to be expressed, or very weakly, judging by the lack of hybridization to seed coat or flower bud
RNAs in the pink flower mutant where a transposon insertion disrupted F3H1 [21].
Using the Gm-c1012-683 cDNA clone as probe, we determined the transcript profile for the F3H genes during the
53 hrs period after infiltration with the avirulent or virulent Psg (Figure 7). In contrast to the increase in transcript
- 1.4 Kb
- 25 S
- 25 S
vir
8 12 24 36 53 hrs.
vir
- 1.4 Kb
- 25 S
Figure 7
Flavanone 3-hydroxylase (F3H) RNA (1.4 kb) profile
Flavanone 3-hydroxylase (F3H) RNA (1.4 kb) profile.
Measurements made at 8 intervals through a 53 hr period in
response to infection by Pseudomonas syringae pv glycinea
with avrB (avrB) or without (vir) (First and second panels
respectively). Dark background sub-panels are the 25 S
ribosomal RNAs from corresponding ethidium bromidestained gels prior to membrane transfer and shown to compare sample loading. Gm-c1012-683 soybean cDNA clone
was used as probe.
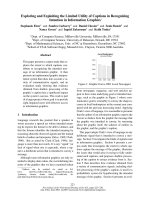
accumulation with time after infection that we had
observed for CAD, CHS, IFS and F3'H genes, the F3H transcripts decreased very rapidly by the 2 hr measurement.
More interesting was the fluctuating amounts of these
transcripts at different times in the course of the 53 hrs
after treatment that is clearly reveled by aligning all 5 RNA
blots as shown in Figure 8. The F3H transcripts in the PsgavrB infected tissues decreased for a period of 4 to 8 hrs
after infection but at 12 hrs there was an increase. This is
also the time at which CHS and IFS transcripts decreased
in abundance. At 24 hrs, F3H transcripts decreased again
which is the time at which CHS and IFS transcripts were
most abundant. This pattern repeats itself at 36 and 53 hrs
measurements. Clearly, the regulation of the F3H gene
expression is different and opposite to that of the CHS
and IFS genes during the defense response.
Further supporting the observation that F3H responds differently than IFS and CHS are the results obtained for the
RNAs extracted from tissues infected with the virulent
pathogen (Figure 7). At the 8, 12, 24 and 36 hr time points
the amount of transcripts hybridizing is higher than in the
corresponding RNA samples extracted from plants
infected with the avirulent pathogen. A possible explanation for this result is the lesser induction of IFS (by the virulent strain) and consequently less IFS competing with
F3H (Figure 1).
In addition to the down regulation of the F3H gene, the
overall abundance of the F3H transcripts was very low.
The hybridization intensities from the RNA blot shown in
Figure 7 resulted after exposing the autoradiographs for a
period of 6 days while the autoradiographs of all other
blots (CAD, CHS, IFS and F3'H) were exposed for 3 days.
Page 11 of 18
(page number not for citation purposes)
BMC Plant Biology 2006, 6:26
0 2 4
/>
8 12 24 36 53 hrs.
- 1.4 Kb
CAD
- 25 S
downstream genes analyzed, DFR and LDOX, also manifested down regulation (Table 1). These results contrast
with the observed up-regulation of four putative anthocyanin biosynthesis related ESTs in tomato plants responding to Psg infection [8].
- 1.4 Kb
CHS
- 25 S
- 1.7 Kb
IFS
- 25 S
- 1.8 Kb
F3’H
- 25 S
-1.4 Kb
F3H
- 25 S
avrB
Figure
profiles 8
Alignment of CAD, CHS, IFS, F3'H and F3H, RNA gel blot
Alignment of CAD, CHS, IFS, F3'H and F3H, RNA
gel blot profiles. The alignment of the RNA profiles from
previous five figures revealed the opposite fluctuation in
RNA accumulation of the F3H RNAs during the plant's
response to Pseudomonas syringae pv. glycinea with avrB infection.
The hybridization ratios for the F3H cDNAs printed in the
microarray also reflect decrease at 8 and 24 hours in HR
samples similar to that observed in the RNA blot (Table
1). The two F3H cDNAs were 'control clones' that had
been printed 8 times in each array providing 54 data
points in the microarray analysis.
To synopsize the results of the RNA blot hybridizations
for the 5 gene families (CAD, CHS, IFS, F3'H and F3H), we
have shown that CAD transcripts accumulated at high levels at an earlier time followed by CHS and IFS. With a 12
hr delay F3'H transcripts also accumulated, presenting the
first demonstration that F3'H may participate in defense.
In contrast, F3H transcripts decreased to the lowest levels
at the time when the up-regulated genes accumulated
transcripts at their peak values (Figure 8; 8 and 24 hr) suggesting a down regulation or relegation of this gene/
enzyme function to those up-regulated HR responders
and consequently predicting a lesser role in the resistant
response in soybean. Because F3H is an enzyme required
for the synthesis of the three classes of anthocyanins and
proanthocyanidins and at an early step in their synthetic
pathway (Figure 1), this flavonoid class most likely does
not play a major role in deterring pathogens in soybean.
In support of this statement are the results obtained in the
microarray hybridization experiments where two F3H
Multiple CHS genes are induced in response to pathogen
infection
As shown in Figure 3, CHS transcripts were strongly upregulated. Though accumulation of total CHS transcripts in
response to pathogen attack has been documented not
only by us but many others [16,29,30,35-38], little is
known about the gene specific expression profile of the
CHS family of genes that exist in most legumes, including
soybean. Our microarray and RNA blot analyses have
demonstrated that there is a significant and rapid increase
in CHS transcript accumulation in the incompatible interaction relative to the interaction with the virulent strain,
and that CHS expression peaks near the 8 hour time point
post-infiltration. However, the CHS probes on the cDNA
arrays represent long coding regions that will not sufficiently differentiate this highly homologous gene family
(>95% sequence identity in the open reading frame for
some members).
In order to identify which CHS gene family member(s)
responded to the pathogen, we investigated the transcript
levels of each individual gene of the eight member gene
family using the gene-specific technique of TaqMan RTPCR. We compared the relative profile of the CHS gene
family in soybean leaves inoculated with the avirulent,
Psg-avrB strain to those inoculated with MgCl2 alone at the
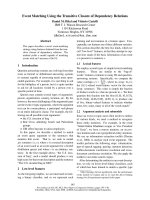
8 hrs post infiltration time point (Figure 9). Our results
indicated that the amount of total CHS mRNA was considerably higher in soybean leaves inoculated with the
Psg-avrB, than in those inoculated with the MgCl2 alone
(Figure 9). These results are consistent with the microarray
data in Table 1, the CHS RNA blot (Figure 3) and previous
reports on increased total CHS expression in soybean
leaves infiltrated with an avirulent strain of Psg [16]. Interestingly, leaves infected with the avirulent pathogen accumulated higher and diverse levels of all CHS gene
transcripts except for CHS4 (Figure 9). Maximal amounts
were detected for CHS2 and CHS1 in leaves experiencing
the incompatible interaction (Figure 9), but expression
was greatly increased for all genes except CHS4.
Discussion
Phenylpropanoids (particularly lignin, the isoflavonoid
phytoalexins, and flavonoids) serve a variety of structural
and metabolic functions and their induction in response
to stress has been studied and documented for a few
model plant systems [39,40]. In vivo labeling has demonstrated marked, but transient increases in rates of synthesis of phytoalexin biosynthetic enzymes concomitant with
Page 12 of 18
(page number not for citation purposes)
BMC Plant Biology 2006, 6:26
/>
Control - Mg
Avirulent Strain
1400
1200
1055.39
1149.55
% CHS/PEPC
1000
800
756.99
660.24
646.66
600
400
203.69
200
5.09
3.89
2.77
0.03
CHS1
CHS2
CHS3
CHS4
0
0.20 1.58
CHS5
0.28
CHS6
10.25
CHS7/CHS8
Figure 9
Expression profile of the CHS gene family members as determined by TaqMan® RT-PCR
Expression profile of the CHS gene family members as determined by TaqMan® RT-PCR. Total RNA from leaves
of Glycine max cv. Williams infiltrated with MgCl2 (gray boxes) or the avirulent (black boxes) strains of Pseudomonas syringae pv.
glycinea was isolated after eight hours of infection, reverse transcribed and subjected to real-time PCR. Relative amounts were
calculated and normalized with respect to PEPC transcript levels (=100%). Data shown represents mean values obtained from
three independent amplification reactions and the error bars indicate the S.E. (standard error) of the mean.
the onset of phytoalexin accumulation [41-43]. The transient increases in enzyme synthesis reflected increases in
the levels of the corresponding mRNA activities [44-46].
In contrast, very little has been concluded regarding gene
activities of enzymes of the flavonoid pathway leading to
the synthesis of anthocyanins, proanthocyanidins, flavones and flavonols in response to pathogen infection.
Transcript levels of some of these genes have been examined independently one at a time and more recently in
global microarray analysis of Arabidopsis, tomato, Medicago truncatula and soybean plants responding to bacterial
and fungal infections. These studies have provided some
hints as to which branches of the phenylpropanoid pathway may be activated during the resistance response in
those and other plants [7-11]. Based on the up-regulation
of a few ESTs reported from those microarray studies it
appears that the lignin/suberin branch of the phenylpropanoid pathway is up-regulated in all the plants examined
but that branches downstream of CHS (flavonoids and
isoflavonoids) appear not to be induced in Arabidopsis
[12]. In contrast, CHS and anthocyanin pathway ESTs
were up-regulated in tomato plants [8] and isoflavonoid
ESTs in Medicago truncatula and soybean [9-11].
In the present study, a combination of two technologies,
cDNA microarrays and RNA gel blot hybridizations, was
used to determine the transcript profiles of a set of genes
encoding key enzymes involved in the synthesis of secondary metabolites derived from several branches of the
soybean phenylpropanoid pathway in response to Psg
infection. All together, the resulting transcript profiles
obtained have shown that lignin/suberin biosyntheis
appears to be the first response of the pathway in the
infected soybean leaves judging by the higher amounts of
CAD transcripts at 2 hrs after Psg-avrB inoculation (Figure
8).
Immediately following CAD was the induction of the isoflavonoid branch of the pathway as reflected by higher
accumulation of CHS, CHR, CHI, IFS, IOMT, and IFR
transcripts 4 hrs post inoculation (Figure 8 and Table 1).
The induction of the isoflavonoid pathway was further
enhanced during the resistance response elicited by the
Psg-avrB infection as compared to the induction in
response to the virulent strain (Figures 3 and 5 and Table
1). These results support previous observations enlisting
CAD, CHS and IFS as early responders [912,29,35,37,44,46-48].
Page 13 of 18
(page number not for citation purposes)
BMC Plant Biology 2006, 6:26
A novel finding was the more delayed increase in F3'H
transcripts starting at approximately 12 hr after infection
with Psg-avrB (Figure 8) and clearly distinct from the
kinetics of transcript accumulation observed upon infection with the virulent Psg (Figure 6). Based on this finding
we could speculate that the flavones branch of the flavonoid pathway also participates in the cascade of reactions
elicited during defense, although at a later time relative to
the isoflavone/phytoalexin branch of the pathway. F3'H
hydroxylates naringenin to eriodictyol a substrate for the
synthesis of flavones, flavonols, cyaniding anthocyanidins and proanthocyanidins (Figure 1, [21]). Since transcripts of enzymes leading to the synthesis of flavonols,
anthocyanidins and proanthocyanidins decreased in
abundance in the course of the resistance response, the
increase in F3'H transcripts during this same time suggest
a potential increase in the synthesis of flavones (i.e. luteolin) and therefore an involvement of these secondary
metabolites 8 hrs into the defense response. No soybean
or any other plant EST has been annotated as flavone synthase 1 or 2 (FS1 and FS2) and it is not currently possible
to determine if transcripts from these genes accumulate in
the same fashion as F3'H to further support an involvement of flavones in defense.
In contrast, three other flavonoid branches leading to the
synthesis of flavonols, anthocyanins, and proanthocyanidins were slowed down judging by the lower amounts of
transcripts hybridizing to the F3H, DFR, LDOX and FLS
cDNAs as early as 2 hrs after infection (Figure 8 and Table
1). The suppression of these branches of the flavonoid
pathway seems to be lifted somehow in the soybean plant
response to infection with the virulent Psg. Transcripts of
the F3H gene encoding the key enzyme feeding all three
branches (Figure 1) accumulated slightly higher amounts
in plants infected with Psg lacking avr-B (Figure 7). In
tomato, microarray data from a one time point (8 hr) after
infection with P. syringae pv. tomato has shown up-regulation of four putative anthocyanin ESTs but no activation
of isoflavonoid ESTs [8].
Even though there have been previous reports describing
increases in CHS and IFS transcripts in tissues of infected
soybean plants, the cyclic nature of the increments, possibly associated with the diurnal cycle, observed in our RNA
gel blot analysis, had not been documented before (Figure
8). Likewise, the increases in F3H transcripts at the times
when CSH and IFS transcripts decrease in abundance is a
novel finding showing that the synthesis of F3H transcripts is opposite correlated to the activity of the IFS
genes during the pathogen stress response. This observation allows us to speculate that the biosynthesis of
anthocyanins, proanthocyanidins and flavonols is relegated to second place compared to that of the isoflavones/
isoflavanones-phytoalexins during the soybean resistance
/>
response to Psg-AvrB infection. We further infer from the
data showing that F3H transcript levels are reciprocally
correlated to those of CHS and IFS, that the entrance into
the flavonol/anthocyanin/proanthocyanin branch of the
pathway is possibly restricted by the low levels of the F3H
and transcripts of genes downstream of F3H, thus giving
preference to the isoflavone/phytoalexin branch of the
pathway during the response to infection. The critical
nature of partitioning the naringenin substrate between
F3H and IFS enzymes has been noted previously in that
F3H must be non-functional in order to permit accumulation of isoflavones in Arabidopsis plants transformed with
an IFS gene [15].
Induction of a key checkpoint enzyme in the pathway,
CHS, in response to a pathogen has been reported previously in many plant systems, including soybean
[16,29,35-37,31]. However, the relative abundance of the
highly homologous eight gene family transcripts of soybean had not been investigated. By using a highly sensitive and gene specific technique, TaqMan RT-PCR, we
have demonstrated that all CHS gene family transcripts
except one, CHS4, accumulated at varying levels in soybean leaves infiltrated with the avirulent strain of Psg.
Stress metabolite production is often correlated with avirulent responses, but is also observed in response to the
virulent pathogen. A variety of experiments have shown
that genes in the phenylpropanoid pathway, such as PAL
and CHS, are induced to the same extent by virulent and
avirulent strains, but that avirulent strains elicit a much
more rapid response than virulent strains [11,49-51].
However, the RNA gel blots and cDNA microarray analysis on CHS expression in soybean leaves infected with Psg
presented here (Figure 3) and in alfalfa by Esnault et. al.
[29], have shown that the avirulent strain is significantly
more effective at inducing CHS than the virulent strain.
The induction of different CHS gene family members in
Glycine max (as in many other legumes) is in striking contrast to the model species, Arabidopsis, where the expression of the single copy CHS is marginally affected by
inoculation with the virulent or avirulent Psg strains [5255]. Arabidopsis lacks isoflavonoids phytoalexins [56] and
the fact that CHS appears not to be consistently induced
upon infection is a strong indication that in Arabidopsis
the flavonoids (anthocyanins, proanthocyanidins, flavones and flavonols) might not play a role in defense.
However, there is evidence that a rapid activation of cinnamoyl alcohol dehydrogenase (CAD), the branch point
enzyme directed towards lignin biosynthesis, occurs in
Arabidopsis cultivars infected with Psg and Xanthomonas
[48]. The accumulation of transcripts encoding enzymes
in the lignin branch such as CAD seems to be a common
rapid response mechanism in all plants examined, includ-
Page 14 of 18
(page number not for citation purposes)
BMC Plant Biology 2006, 6:26
ing Arabidopsis, tomato, Medicago truncatula and soybean
(Figure 2). Thus, increased CAD expression may be a common early plant response to pathogens, presumably leading to increased deposition of lignin, suberin and callose
into the cell wall to strengthen barriers against further
pathogen ingress.
/>
thesis of those secondary metabolites. Lastly, we conclude
that the large transcript increases measured for CHS, the
gene encoding the central enzyme of the phenylpropanoid pathway, is brought about by the additive up-regulation of seven CHS family member genes.
Methods
In many plant species, including soybean, key phenylpropanoid pathway genes like CHS are encoded by multiple
genes exhibiting greater diversity in their 5' and 3' UTRs
than in the protein coding regions. There has been considerable speculation whether this encoding reflects a means
for temporal, spatial or stimulus specific regulation of
gene expression, or whether it simply allows for increased
enzyme production under stress conditions, when expression of the whole gene family is often superimposed upon
tissue specific selective expression of a subset of family
members [57]. Eight hours after infiltration with the avirulent pathogen, we observed significant accumulation of
CHS transcripts encoded by nearly all the gene family
members (except for CHS4), which potentially correlates
to the different isopeptides being translated. Support for
this hypothesis comes from earlier work on elicitortreated soybean cell cultures wherein six CHS isomers
have been described [58]. De novo synthesis of up to nine
CHS isopeptides has been observed in the elicitor treated
bean cell cultures and hypocotyls [59]. Thus it seems more
likely that in soybean, expression of the whole CHS gene
family is superimposed upon tissue specific selective
expression following pathogen infection.
Plant material and bacterial inoculation
Soybean [Glycine max (L.) Merrill cv Williams 82, RPG1
dominant] plants were grown in an environmentally controlled growth chamber, at constant 22°C and 16 h of
light from 7 AM to 11 PM. Plants with emerging first trifoliolate were inoculated approximately 14 days after germination by vacuum infiltration as described [11]. For the
inoculum, the bacterial strains Pseudomonas syringae pv.
glycinae Race 4 with or without the avirulence gene avrB
on plasmid pVB01 were suspended in 10 mM MgCl2 at a
concentration of 0.02 A600 (corresponding to approximately 2 × 10⁷ colony-forming units ml-1). Control plants
were infiltrated with a 10 mM MgCl2 solution to correct
for the effect of vacuum infiltration on gene expression.
RNA extraction
Unifoliolate-leaves from several infiltrated plants per
treatment were harvested at 0, 2, 4, 8, 12, 24, 36 and 53
hours post-inoculation. The leaves were freeze-dried in a
Multi-dry lyophilizer (FTS systems) and stored at -20°C.
The total RNA samples used in RNA blots were extracted
using a phenol-chloroform and lithium chloride precipitation method [60,61]. RNA was stored at -70°C until
used.
Conclusion
The transcriptional analysis of genes from the multiple
branches of the phenylpropanoid pathway has shown
that in soybean synthesis of lignin/suberin is one of the
early responses to Pseudomonas syringae pv. glycinea infection as deduced by the high accumulation of CAD transcripts 2 hrs after Psg-avrB inoculation. Immediately
following the CAD response was the induction of the isoflavonoid biosynthetic pathway judging by the high accumulation of CHS, CHR, CHI, IFS, IOMT, and IFR
transcripts 4 hrs post inoculation (Figure 8 and Table 1).
The data also allowed us to predict that the synthesis of
flavones may participate in the R gene-mediated defensive
response, as suggested by the higher levels of F3'H transcripts accumulated 24 hours post infiltration. In contrast,
transcripts of genes involved in the synthesis of flavonols,
anthocyanins and proanthocyanidins, also pathogen
deterring compounds, seem to be down regulated during
the periods of time when the genes involved in the synthesis of isoflavonoids are up-regulated. However, it appears
that at times when the activity of IFS genes decrease, synthesis of flavonols, anthocyanins and proanthocyanins
may resume based on the concomitant increases of F3H
transcripts which encode an enzyme required for biosyn-
Microarrays and data analysis
A detailed description of the three soybean slide sets containing 9,216 cDNA clones each totaling 27,648 used for
this study has been presented [18]. Fluorescent labeled
cDNA probes were prepared by reverse transcription of
total RNA in the presence of amino-allyl-dUTP (Sigma, St.
Louis), followed by coupling of either Cy3 or Cy5 dyes
(Amersham Pharmacia Biotech, Piscataway, NJ) as previously detailed [11]. A loop design was used and data from
two biological replicates were statistically analyzed using
R/MAANOVA involving GLOWESS normalization and a
linear mixed effects model [11]. Fluorescent intensities
values for a subset of the cDNAs from the earlier microarray study [11] were evaluated by averaging the ratios and
p-values of all spots whose false discovery rate p-values
were below 0.05 or 0.005 for the 2 hr (T2), 8 hr (T8) and
24 hr (T24) post inoculation, respectively. For genes that
were spotted on multiple slides, the spot values were averaged within slide and then across slides.
RNA gel-blot and DNA probes
RNA (10 µg/sample) was electrophoresed in a 1.2% agarose-3% formaldehyde gel [62]. Size-fractionated RNAs
Page 15 of 18
(page number not for citation purposes)
BMC Plant Biology 2006, 6:26
were transferred to Optitran-supported nitrocellulose
membrane (Midwest Scientific, Valley Park, MO) by capillary action as described in [62] and cross-linked with UV
light (Stratagene, La Jolla, CA). Nitrocellulose RNA blots
were prehybridized, hybridized, washed and exposed to
Hyperfilm (Amersham, Arlington Heights, IL) as
described by [63]. All the RNA blot results presented are
from autoradiographs exposed for 3 days except for those
of blots hybridized with F3H gene probes that were
exposed for 6 days.
Cloned DNAs used as probes were digested from their vectors or PCR amplified, electrophoresed, and purified from
agarose using the QIAquick gel extraction kit (QIAGEN,
Valencia, CA). DNA concentration of the final eluate was
determined with a NanoDrop (NanoDrop Technologies,
Inc. Rockland, DE). Purified DNA fragments (25–250 ng)
were labeled with [α-32P]dATP by random primer reaction
[64].
Real Time Quantitative RT-PCR
The highly sensitive TaqMan RT-PCR assay was used to
measure the relative levels of the CHS gene family members with gene specific probes. Briefly, total RNA was purified using the DNA-free kit (Ambion, Austin, TX) and
reverse transcribed using the Superscript II first strand
cDNA system for RT-PCR (Invitrogen, Carlsbad, CA)
according to the manufacturer's instructions. The resulting cDNA samples were pooled and stored at -20°C.
TaqMan® RT-PCR assays for the target gene were performed in triplicate on cDNA samples or no RT control
samples on an ABI Prism 7700 Sequence Detection System (Applied Biosystems, Foster City, CA). Gene specific
CHS primers and probes were used as listed in [20]. Parallel amplifications using the same cDNA pools were carried out using primers and probes to the endogenous
reference and normalizer, PEPC16, which had shown to
be expressed at similar levels in leaves inoculated with the
two different strains in our earlier optimization experiments (data not presented). From the pooled cDNA, 2 µl
of the RT reaction was used as a template in a 25 µl PCR
reaction containing 1x TaqMan buffer, 0.4 µM forward
and reverse primers, 0.2 µM probe, 0.2 mM dATP, dCTP
and dGTP, 0.4 mM dUTP and 3.5 mM MgCl2 and 0.025
U/µl AmpliTaq Gold DNA polymerase. The PCR thermal
cycling parameters were 50°C for 2 min., 95°C for 10 min
followed by 40 cycles of 95°C for 15 sec., 60°C for 1 min.
This experiment was replicated thrice. Data were captured
as amplification plots. Transcript levels of the CHS gene
family members were measured relative to the endogenous reference PEPC. All calculations and statistical analysis were performed as described in the ABI 7700
Sequence Detection System User Bulletin #2 (Applied
Biosystems, Foster City, CA).
/>
Authors' contributions
GZ identified ESTs of soybean phenylpropanoid genes
printed as the 'control clones' in the soybean cDNA
microarray chips, created list of all ESTs in the soybean
arrays annotated as phenylpropanoid pathway genes, performed the RNA blots, executed the critical analysis of the
combined microarray and RNA blots results and wrote the
manuscript. JZ performed the microarray hybridizations
that generated the microarray data analyzed in this study.
JT selected ESTs to represent all CHS family members in
the arrays and performed, analyzed and described the
TaqMan RT-PCR experiment which determined the CHS
family member genes responding to the pathogen. DOG
contributed to the design, construction, and production
of the soybean cDNA microarray chips. SC directed the
microarray hybridization experiments that generated the
data analyzed in this study, summarized the microarray
data to assemble Table 1, and provided the infected tissues used to extract RNA for the Northern blots and TaqMan experiment. LV directed the development and
construction of the cDNA soybean microarrays, provided
overall project coordination, and edited the manuscript.
All authors critically reviewed the manuscript.
Acknowledgements
We thank Min Li for his assistance in retrieving and summarizing the microarray data. We gratefully acknowledge support from grants of the University of Illinois Soybean Disease Biotechnology Center and USDA-ARS CRIS
3611-21000-018-00D and the Illinois Soybean Program Operating Board
and the National Science Foundation grant DBI9872565.
References
1.
2.
3.
4.
5.
6.
7.
8.
9.
10.
11.
Cross JE, Kennedy BW, Lambert JW, Cooper RL: Pathogenic races
of the bacterial pathogen of soybeans, Pseudomonas glycinea.
Plant Disease Report 1966, 50:557-560.
Klement Z: From hypersensitivity defense reaction of plants
to pathogens. In Phytopathogenic Prokariotes Edited by: Mount MS,
Lacy GH. New York: Academic Press; 1982:149-177.
Jones AM, Dangl JL: Logjam at the Styx: Programed Cell Death
in Plants. Trends in Plant Sciences 1996, 1:114-119.
Quirino BF, Bent AF: Deciphering host resistance and pathogen
virulence: the Arabidopsis/Pseudomonas interaction as a
model. Mol Plant Pathol 2003, 4:517-530.
de Wit PJGM: Pathogen avirulence and plant resistance: A key
role for recognition. Trends Plant Sci 1997, 2:452-458.
Dempsey DA, Shah J, Klessig DF: Salicilic acid and disease resistance in plants. Crit Rev Plant Sci 1999, 18:547-575.
Wan J, Dunning FM, Bent AF: Probin plant-pathogen interactions and downstream defense signaling using DNA microarrays. Funct Integr Genomics 2002, 2:259-27.
Mysore KS, Crasta OR, Tuori RP, Folkerts O, Swirsky PB, Martin GB:
Comprehensive transcript profiling of Pto- and Prf-mediated
host defense responses to infection by Pseudomonas syringae
pv. tomato. The Plant Journal 2002, 32:299-315.
Cluzet S, Torregrosa C, Jacquet C, Lafitte C, Fournier J, Mercier L,
Salamagne S, Briand X, Esquerre-Tugaye MT, Dumas B: Gene
expression profiling and protection of Medicago truncatula
against a fungal infection in response to an elicitor from
green algae Ulva spp. Plant Cell and Environment 2004, 27:917-928.
Moy P, Qutob D, Chapman BP, Atkinson I, Gijzen M: Patterns of
gene expression upon infection of soybean plants by Phytophthora sojae. MPMI 2004, 17:1051-1062.
Zou J, Rodriguez-Zas S, Aldea M, Li M, Zhu J, Gonzalez DO, Vodkin
LO, DeLucia E, Clough SJ: Expression profiling soybean
response to Pseudomonas syringae reveals new defense-
Page 16 of 18
(page number not for citation purposes)
BMC Plant Biology 2006, 6:26
12.
13.
14.
15.
16.
17.
18.
19.
20.
21.
22.
23.
24.
25.
26.
27.
28.
29.
30.
related genes and rapid HR-specific down regulation of photosynthesis. Mol Plant-Microbe Interact 2005, 18:1161-1174.
Scheideler M, Schlaich NL, Fellenberg K, Beissbarth T, Hauser NC,
Vingron M, Slusarenko AJ, Hoheisel JD: Monitoring the switch
from housekeeping to pathogen defense metabolism in Arabidopsis thaliana using cDNA arrays. J Biol Chem 2002,
277:10555-10561.
Feinbaum RL, Ausubel FM: Transcriptional regulation of the Arabidopsis thaliana chalcone synthase gene. Mol Cell Biol 1988,
8:1985-1992.
Jung W, Yu O, Lau SM, O'Keefe DP, Odell J, Fader G, McGonigle B:
Identification and expression of isoflavone synthase, the key
enzyme for biosynthesis of isoflavones in legumes. Nat Biotechnol 2000, 18:208-212.
Liu C, Blount JW, Steele CL, Dixon RA: Bottlenecks for metabolic
engineering of isoflavone glycoconjugates in Arabidopsis. Proc
Natl Acad Sci USA 2002, 99:14578-14583.
Dhawale S, Souciet G, Kuhn DN: Increase of chalcone synthase
mRNA in pathogen-inoculated soybeans with race-specific
resistance is different in leaves and roots. Plant Physiol 1989,
91:911-916.
Dhaubhadel S, McGarvey BD, Williams R, Gijzen M: Isoflavonoid
biosynthesis and accumulation in developing soybean seeds.
Plant Mol Biol 2003, 53:733-743.
Vodkin LO, Khanna K, Shealy R, Clough SJ, Gonzalez DO, Philip R,
Zabala G, Thibaud-Nissen F, Sidarous M, Strömvik MV, Shoop E,
Schmidt C, Retzel E, Erpelding J, Shoemaker RC, Rodriguez-Huete A,
Polacco JC, Coryell V, Keim P, Gong G, Liu L, Pardinas J, Schweitzer
P: Microarrays for global expression constructed with a low
redundancy set of 27,500 sequenced cDNAs representing an
array of developmental stages and physiological conditions
of the soybean plant. BMC Genomics 2004, 5:7.
Zabala G, Vodkin L: Cloning of the pleitropic T locus in soybean
and two recessive alleles that differentially affect structure
and expression of the encoded flavonoid 3' hydroxylase.
Genetics 2003, 163:295-309.
Tuteja JH, Clough SJ, Chan W-C, Vodkin LO: Tissue-specific gene
silencing mediated by a naturally occurring chalcone synthase gene cluster in Glycine max. Plant Cell 2004, 16:819-835.
Zabala G, Vodkin L: The wp mutation of Glycine max carries a
gene-fragment-rich transposon of the CACTA superfamily.
Plant Cell 2005, 17:1-14.
Sticher L, Mauch-Mani B, Metraux JP: Systemic acquired resistance. Ann Rev Phytopathol 1997, 35:235-270.
Leon J, Shulaev V, Yalpani N, Lawton MA, Raskin I: Benzoic acid 2hydroxylase, a soluble oxygenase from tobacco, catalyzes
salicylic acid biosynthesis. Proc Natl Acad Sci USA 1995,
92:10413-10417.
Wildermuth MC, Dewdney J, Wu G, Ausubel M: Isochorismate
synthase is required to synthesize salicylic acid for plant
defense. Nature 2001, 414:562-571.
Brill EM, Abrahams S, Hayes CM, Jenkins CL, Watson JM: Molecular
characterization and expression of a wound-inducible cDNA
encoding a novel cinnamyl-alcohol dehydrogenase enzyme
in Lucerne (Medicago sativa L.). Plant Mol Biol 1999, 41:279-291.
Frank RL, Vodkin L: Identification of chalcone synthase and
phenylalanine ammonia lyase genes in soybean. Soyb Genet
Newsl 1988, 15:181.
Ryder TB, Cramer CL, Bell JN, Robbins MP, Dixon RA, Lamb CJ: Elicitor rapidly induces chalcone synthase mRNA in Phaseolus
vulgaris cells at the onset of the phytoalexin defense
response. Proc Natl Acad Sci USA 1984, 81:5724-5728.
Walter MH, Grima-Pettenati J, Grand C, Boudet AM, Lamb CH: Cinnamyl-alcohol dehydrogenase, a molecular marker specific
for lignin synthesis: cDNA cloning and mRNA induction by
fungal elicitor. Proc Natl Acad Sci USA 1988, 85:5546-5550.
Esnault R, Buffard D, Breda C, Sallaud C, El-Turk J, Kondorosi A:
Pathological and molecular characterizations of alfalfa interactions with compatible and incompatible bacteria, Xanthomonas campestris pv. alfalfae and Pseudomonas syringae pv.
pisi. MPMI 1993, 6:655-664.
Sallaud C, Zuanazzi J, El-Turk J, Leymarie J, Breda C, Buffard D, Kozak
I, Ratet P, Husson P, Kondorosi A, Esnault R: Gene expression is
not systematically linked to phytoalexin production during
alfalfa leaf interaction with pathogenic bacteria. MPMI 1997,
10:257-267.
/>
31.
32.
33.
34.
35.
36.
37.
38.
39.
40.
41.
42.
43.
44.
45.
46.
47.
48.
49.
Shoemaker R, Keim P, Vodkin L, Retzel E, Clifton SW, Waterston R,
Smoller D, Coryell V, Khanna A, Erpelding J, Gai X, Brendel V, RaphSchmidt C, Shoop EG, Vielweber CJ, Schmatz M, Pape D, Bowers Y,
Theising B, Martin J, Dante M, Wylie T, Granger: A compilation of
soybean ESTs: generation and analysis.
Genome 2002,
45:329-338.
Ebel J: Phytoalexin synthesis: the biochemical analysis of the
induction process. Annu Rev Phytopathol 1986, 24:235-264.
Kochs G, Grisebach H: Induction and characterization of a
NADPH-dependent flavone synthase from cell cultures of
soybean. Z Naturforsch 1987, 42c:343-348.
Kochs G, Welle R, Grisebach H: Differential induction of
enzyme in soybean cultures by elicitor or osmotic stress.
Planta 1987, 171:519-524.
Schmelzer E, Borner H, Grisebach H, Ebel J, Hahlbrock K: Phytoalexin synthesis in soybean (Glycine max): Similar time
courses of mRNA induction in hypocotyls infected with a
fungal pathogen and in cell cultures treated with fungal elicitor. FEBS Letters 1984, 172:59-63.
Bonhoff A, Loyal R, Ebel J, Grisebach H: Race: cultivar-specific
induction of enzymes related to phytoalexin biosynthesis in
soybean roots following infection with Phytophthora megasperma f. sp. glycinea. Archives of Bichem and Biophysics 1986,
246:149-154.
Esnault R, Chibbar RN, Lee D, van Huystee RB, Ward EWB: Early
differences in production of mRNAs for phenylalanine
ammonia-lyase and chalcone synthase in resistant and susceptible cultivars of soybean inoculated with Phytophthora
megasperma f. sp. glycinea.
Physil Mol Plant Pathol 1987,
30:293-297.
Wingender R, Rohrig H, Horicke C, Wing D, Schell J: Differential
regulation of soybean chalcone synthase genes in plant
defense, symbiosis and upon environmental stimuli. Mol Gen
Genet 1989, 218:315-322.
Dixon RA, Paiva NL: Stress-induced phenylpropanoid metabolism. Plant Cell 1995, 7:1085-1097.
Dixon RA, Achnine L, Kota P, Liu CJ, Reddy MSS, Wang L: The phenylpropanoid pathway and plant defense – a genomics perspective. Mol Plant Pathol 2002, 3:371-390.
Dixon RA, Lamb CJ: Stimulation of the novo synthesis of L-phenylalanine ammonia-lyase in relation to phytoalexin accumulation in Colletotrichum lindemuthianum elicitor-treated
cell ssuspension cultures of French bean (Phaseolus vulgaris).
Biochimica Biophysica Acta 1979, 586:453-463.
Lawton MA, Dixon RA, Lamb CJ: Elicitor modulation of the turnover of L-phenylalanine ammonia-lyase in French bean cell
suspension cultures. Biochimica Biophysica Acta 1980, 633:162-175.
Lawton MA, Dixon RA, Hahlbrock K, Lamb CJ: Rapid induction of
the synthesis of phenylalanine ammonia-lyase and of chalcone synthase in elicitor-treated plant cells. European J of Biochem 1983, 129:593-601.
Hahlbrock K, Lamb CJ, Purwin C, Ebel J, Fautz E, Schafer E: Rapid
response of suspension-cultured parsley cells to the elicitor
from Phytophthora megasperma var. sojae – Induction of the
enzymes of general phenylpropanoid metabolism. Plant Physiol 1981, 67:768-773.
Ragg H, Kuhn DN, Hahlbrock K: Coordinated regulation of 4coumarate: CoA ligase and phenylalanine ammonia-lyase
mRNAs in cultured plant cells.
J Biol Chem 1981,
256:10061-10065.
Lawton MA, Dixon RA, Hahlbrock K, Lamb CJ: Elicitor induction
of mRNA activity. Rapid effects of elicitor on phenylalanine
ammonia-lyase and chalcone synthase mRNA activities in
bean cells. European J of Biochem 1983, 130:131-139.
Hahlbrock K, Scheel D: Physiology and molecular biology of
phenylpropanoid metabolism. Annu Rev Plant Physiol Plant Mol Biol
1989, 40:347-369.
Buell CR, Somerville SC: Expression of defense-related and
putative signaling genes during tolerant and susceptible
interactions of Arabidopsis with Xanthomonas campestris pv.
campestri. Mol Plant-Microbe Interact 1995, 8:435-443.
Bell JN, Ryder TB, Wingate VP, Bailey JA, Lamb CJ: Differential
accumulation of plant defense gene transcripts in a compatible and an incompatible plant-pathogen interaction. Mol and
Cellular Biol 1986, 6:1615-1623.
Page 17 of 18
(page number not for citation purposes)
BMC Plant Biology 2006, 6:26
50.
51.
52.
53.
54.
55.
56.
57.
58.
59.
60.
61.
62.
63.
64.
/>
Lawton MA, Lamb CJ: Transcriptional activation of plant
defense genes by fungal elicitor, wounding, and infection. Mol
and Cellular Biol 1987, 7:335-341.
Jahnen W, Hahlbrock K: Cellular localization of non-host resistance reactions of parsley (Petroselinum crispum) to fungal
infection. Planta 1988, 173:197-204.
Davis KR, Ausubel FM: Characterization of elicitor-induced
defense responses in suspension-cultured cells of Arabidopsis.
Mol Plant-Microbe Int 1989, 2:363-368.
Dong X, Mindrinos M, Davis KR, Ausubel FM: Induction of Arabidopsis defense genes by virulent and avirulent Pseudomonas
syringae strains and by a cloned avirulent gene. Plant Cell 1991,
3:61-72.
Wanner LA, Mittal S, Davis KR: Recognition of the avirulence
gene avrB from Pseudomonas syringae pv. glycinea by Arabidopsis thaliana. Mol Plant-Microbe Int 1993, 6:582-591.
Scheideler M, Schlaich NL, Fellenberg K, Beissbarth T, Hauser NC,
Vingron M, Slusarenko AJ, Hoheisel JD: Monitoring the switch
from housekeeping to pathogen defense metabolism in Arabidopsis thaliana using cDNA arrays. J Biol Chem 2002,
277:10555-10561.
Tsuji J, Jackson EP, Gage DA, Hammerschmidt R, Somerville SC: Phytoalexin accumulation in Arabidopsis Thaliana during the
hypersensitive reaction to Pseudomonas syringae Pv syringa.
Plant Physiol 1992, 98:1304-1309.
Junghans H, DAlkin K, Dixon RA: Stress responses in alfalfa
(Medicago sativa L.). Characterization and expression patterns of members of a subset of the chalcone synthase multigene family. Plant Mol Biol 1993, 22:239-253.
Grab D, Loyal R, Ebel J: Elicitor-induced phytoalexin synthesis
in soybean cells: changes in the activity of chalcone synthase
mRNA and the total population of translatable mRNA. Arch
Biochem Biphys 1985, 243:523-529.
Ryder TB, Hedrick SA, Bell JN, Liang XW, Clouse SD, Lamb CJ:
Organization and differential activation of a gene family
encoding the plant defense enzyme chalcone synthase in
Phaseolus vulgaris. Mol Gen Genet 1987, 210:219-233.
McCarty D: A simple method for extraction of RNA from
maize tissue. Maize Genet Coop Newsl 1986, 60:61.
Wang C, Todd J, Vodkin LO: Chalcone synthase mRNA and
activity are reduced in yellow soybean seed coats with dominant I alleles. Plant Physiol 1994, 105:739-748.
Sambrook J, Fritsch EF, Maniatis T: Molecular cloning: A laboratory manual Cold Spring Harbor: Cold Spring Harbor Laboratory Press; 1989.
Todd JJ, Vodkin L: Duplications that suppress and deletions
that restore expression from a chalcone synthase multigene
family. Plant Cell 1996, 8:687-699.
Feinberg AP, Vogelstein B: A technique for radiolabeling DNA
restriction fragments to high specific activity. Anal Biochem
1983, 132:6-13.
Publish with Bio Med Central and every
scientist can read your work free of charge
"BioMed Central will be the most significant development for
disseminating the results of biomedical researc h in our lifetime."
Sir Paul Nurse, Cancer Research UK
Your research papers will be:
available free of charge to the entire biomedical community
peer reviewed and published immediately upon acceptance
cited in PubMed and archived on PubMed Central
yours — you keep the copyright
BioMedcentral
Submit your manuscript here:
/>
Page 18 of 18
(page number not for citation purposes)