báo cáo khoa học: " Characterization of expressed sequence tags obtained by SSH during somatic embryogenesis in Cichorium intybus L" pot
Bạn đang xem bản rút gọn của tài liệu. Xem và tải ngay bản đầy đủ của tài liệu tại đây (757.38 KB, 12 trang )
BioMed Central
Page 1 of 12
(page number not for citation purposes)
BMC Plant Biology
Open Access
Research article
Characterization of expressed sequence tags obtained by SSH
during somatic embryogenesis in Cichorium intybus L
Sylvain Legrand, Theo Hendriks, Jean-Louis Hilbert and Marie-
Christine Quillet*
Address: UMR USTL, INRA 1281 Stress Abiotiques et Différenciation des Végétaux Cultivés, Université de Sciences et Technologies de LILLE,
Bâtiment SN2, 59655 Villeneuve d'Ascq, France
Email: Sylvain Legrand - ; Theo Hendriks - ; Jean-Louis Hilbert - jean-
; Marie-Christine Quillet* -
* Corresponding author
Abstract
Background: Somatic embryogenesis (SE) is an asexual propagation pathway requiring a somatic-
to-embryonic transition of differentiated somatic cells toward embryogenic cells capable of
producing embryos in a process resembling zygotic embryogenesis. In chicory, genetic variability
with respect to the formation of somatic embryos was detected between plants from a population
of Cichorium intybus L. landrace Koospol. Though all plants from this population were self
incompatible, we managed by repeated selfing to obtain a few seeds from one highly embryogenic
(E) plant, K59. Among the plants grown from these seeds, one plant, C15, was found to be non-
embryogenic (NE) under our SE-inducing conditions. Being closely related, we decided to exploit
the difference in SE capacity between K59 and its descendant C15 to study gene expression during
the early stages of SE in chicory.
Results: Cytological analysis indicated that in K59 leaf explants the first cell divisions leading to SE
were observed at day 4 of culture. In contrast, in C15 explants no cell divisions were observed and
SE development seemed arrested before cell reactivation. Using mRNAs isolated from leaf explants
from both genotypes after 4 days of culture under SE-inducing conditions, an E and a NE cDNA-
library were generated by SSH. A total of 3,348 ESTs from both libraries turned out to represent
a maximum of 2,077 genes. In silico subtraction analysis sorted only 33 genes as differentially
expressed in the E or NE genotype, indicating that SSH had resulted in an effective normalisation.
Real-time RT-PCR was used to verify the expression levels of 48 genes represented by ESTs from
either library. The results showed preferential expression of genes related to protein synthesis and
cell division in the E genotype, and related to defence in the NE genotype.
Conclusion: In accordance with the cytological observations, mRNA levels in explants from K59
and C15 collected at day 4 of SE culture reflected differential gene expression that presumably are
related to processes accompanying early stages of direct SE. The E and NE library obtained thus
represent important tools for subsequent detailed analysis of molecular mechanisms underlying this
process in chicory, and its genetic control.
Published: 6 June 2007
BMC Plant Biology 2007, 7:27 doi:10.1186/1471-2229-7-27
Received: 10 August 2006
Accepted: 6 June 2007
This article is available from: />© 2007 Legrand et al; licensee BioMed Central Ltd.
This is an Open Access article distributed under the terms of the Creative Commons Attribution License ( />),
which permits unrestricted use, distribution, and reproduction in any medium, provided the original work is properly cited.
BMC Plant Biology 2007, 7:27 />Page 2 of 12
(page number not for citation purposes)
Background
Cells in complex multicellular organisms acquire their
structural and functional attributes by differentiation, a
genetic program specific for a given environment of the
cells. In many higher organisms, differentiation is a unidi-
rectional and irreversible process. In higher plants, how-
ever, most differentiated cells are able to
transdifferentiate, i.e. start a new differentiation pathway.
Somatic embryogenesis (SE) may be considered as the
ultimate form of this plant cell totipotency in that fully
differentiated somatic cells are induced to regenerate new
plants via a developmental pathway that resembles
zygotic embryogenesis [1]. Despite considerable efforts,
the processes underlying the transition from a somatic to
embryogenic cell, i.e. induction, dedifferentiation, and
redifferentiation, are still poorly understood [2].
For twenty years, processes related to the induction of SE
in chicory are being studied in our laboratory at the cyto-
logical, physiological, and molecular level using the inter-
specific hybrid '474' (Cichorium intybus L. × C. endivia L.).
In contrast to many agronomical important varieties of
chicory, somatic embryos are readily and rapidly formed
in large numbers in different explants from the hybrid
'474' when cultured under constant agitation in the dark
at 35°C in a Murashige and Skoog culture medium con-
taining low concentrations of auxin and cytokinin [3]. SE
is direct under these conditions, i.e. without the develop-
ment of a callus, and embryos are formed from single cells
[4].
Using the chicory hybrid '474' SE model system, different
methods have been applied to clone genes that might be
involved in the early phases of SE, or that at least could
serve as markers of SE induction. The genes corresponding
to the cloned cDNAs were differentially expressed in
explants of the hybrid '474' during SE and not or only
weakly expressed in explants of non-embryogenic C. inty-
bus L. varieties cultured under the same conditions, sug-
gesting that the expression of these genes was related to SE
and not to the stress due to the culture conditions [5-8].
However, determination of causal relationships between
the differentially expressed genes and SE is hampered due
to the interspecific status of hybrid '474', and its complete
sterility.
More recently, genetic variability with respect to the for-
mation of somatic embryos was found present in a Hun-
garian landrace of C. intybus L., called 'Koospol', from
which also the C. intybus L. parent of the hybrid '474' orig-
inated (M-C. Quillet, B. Delbreil, and B. Deprez, unpub-
lished results). Upon screening plants from this landrace,
embryogenic and non-embryogenic genotypes were iden-
tified, offering the possibility to introduce genetics as a
tool to study the molecular mechanisms underlying the
induction of SE in chicory. The plant K59 was selected as
a highly embryogenic (E) genotype, and a few seeds were
obtained after repeated selfing of this normally self-
incompatible, and highly heterozygous, genotype.
Amongst the plants grown from these seeds, the plant C15
was found to represent a non-embryogenic (NE) geno-
type, incapable of forming somatic embryos under our SE-
inducing conditions. Sharing a similar genetic back-
ground, the genotypes K59 and its descendant C15 thus
seemed an obvious choice as starting material for detailed
analysis of differential gene expression during the early
stages of SE in chicory.
In this study, we report the generation of an embryogenic
(E) and a non-embryogenic (NE) cDNA library by apply-
ing suppression subtractive hybridization (SSH) [9] using
mRNAs isolated from leaf explants of genotypes K59 and
C15, cultured for 4 days under SE-inducing conditions.
From the libraries 3,500 cDNA-clones were selected,
sequenced, and subjected to database searches to annotate
the putative functions of the representing genes. Differen-
tially expressed genes were identified by in silico subtrac-
tion analysis and real-time RT-PCR. Several genes
preferentially expressed in K59 seem to encode proteins
involved in protein synthesis and cell division, whereas
proteins encoded by genes preferentially expressed in C15
may be involved in defence. The results are discussed with
respect to the quality of the libraries, and their use for
future research on differential gene expression during SE
in chicory.
Results
Cellular events during the induction of somatic
embryogenesis in K59 and C15
When leaf explants from the genotypes K59 and C15 were
cultivated under SE-inducing conditions as developed for
the hybrid '474' [3], somatic embryos were formed in the
explants from K59, but not in those from C15 (Fig. 1).
Following the cellular events in explants from both geno-
types during SE culture by microscopic examination of
semi-thin sections, revealed that SE development in K59
was similar as described previously for the hybrid '474'
[4]. The first visible response in the explants, starting after
one day of culture, was cell reactivation; reactivating cells
being characterized by enlarged nuclei and clearly distin-
guishable nucleoli. At this stage the nucleus is still
oppressed against the cell wall, situated between the plas-
malemma and the tonoplast of the central vacuole, and is
surrounded by chloroplasts. One day later, the first reacti-
vated cells with their nuclei positioned in the middle of
the cell and surrounded by a fragmented vacuole, were
observed. At day 4 of SE culture, in explants of K59 reacti-
vating and reactivated cells were observed, as well as some
first cell divisions preceding somatic embryo formation
(Fig. 1a, b). In contrast, in explants from C15 only cells
BMC Plant Biology 2007, 7:27 />Page 3 of 12
(page number not for citation purposes)
that seemed to have started reactivation were observed
(Fig. 1d, e), albeit in lower numbers as compared to K59.
Observations at day 8 of the culture showed the presence
of many proembryos in the explants of K59 (Fig. 1c),
whereas in the explants from C15 there was still no devel-
opment of reactivated or dividing cells (Fig. 1f). From
these results it was concluded that differences in mRNA
levels in explants from K59 and C15 collected at day 4 of
SE culture are likely to reflect differential gene expression
related to processes accompanying the early stages of SE in
K59.
Generation of SSH from an embryogenic and a non-
embryogenic genotype
Messenger RNAs isolated from leaf explants of K59 and
C15, collected at day 4 of culture under SE inducing con-
ditions, were used to construct two subtractive cDNA-
libraries by applying SSH. The E library, a library sup-
posed to be enriched in cDNAs representing genes prefer-
entially expressed during SE, was obtained by using
cDNAs from K59 mRNAs as 'tester' and cDNAs from C15
mRNAs as 'driver'. The NE library was obtained by revers-
ing 'tester' and 'driver' mRNA.
Sequencing was carried out for about 3,500 cDNAs clones
randomly selected from both libraries: 2,000 from the E
library and 1,500 from the NE library. After removing bad
quality sequences, a total of 1,944 ESTs from the E library
and 1,404 from the NE library were conserved for further
analyses. The average length of the 3,348 ESTs was 456 bp,
and the GC content was equal to 45% (Tab. 1).
A database named E/NE db was generated from all ESTs
from the E and NE library. To generate OCs (O
riginal
C
lusters, regrouping identical ESTs) two successive criteria
were applied. First, all 3,348 sequences from the E/NE db
were submitted to a BlastN search (E-value ≤ E
-30
) against
this database. The sorted sequences were grouped in 2,174
primary OCs (encoded OC0001 – OC2174). Next,
sequences in primary OCs containing more than one EST
were aligned and their mutual sequence identity deter-
mined. OCs containing ESTs that all shared at least 95%
identity over a contiguous sequence of 150 bp retained
their primary code. OCs that contained two or more
groups of ESTs by this criterion were split in 2 or more
OCs, respectively, each identified by the primary code fol-
lowed by a letter (e.g. OC0603_a and OC0603_b; cf Tab.
3, and Additional file 1). This analysis revealed a total of
2,302 OCs, of which 1764 (52.7% of the total number of
sequences) were singletons, and 538 contained between 2
and 40 ESTs.
Comparison of chicory ESTs with sequences of other
species allowing the formation of contigs
Direct determination of the number of genes represented
by the 2,302 OCs identified was not possible since the
digestion of cDNA with RsaI during the SSH procedure left
no overlapping sequences, and thus prevented the con-
Table 1: Summary of Cichorium intybus ESTs
Total ESTs 3,348
ESTs from the E library 1,944
ESTs from the NE library 1,404
Average sequence size (bp) 456
Average sequence size of annotated ESTs (bp) 471
Average sequence size of ESTs without match 354
Average GC content (%) 45
Number of original clusters (OC) 2,302
Number of contigs 189
Maximum number of genes 2,077
Genes represented only in the E library 1,061
Genes represented only in the NE library 730
Genes represented in both libraries 286
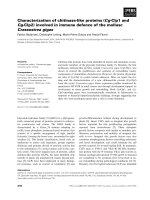
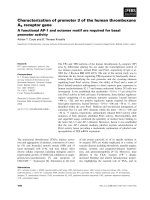
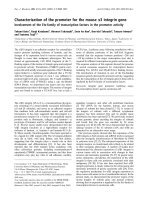
Cytological differences in leaf explants of chicory genotypes K59 and C15 cultured under SE-inducing conditionsFigure 1
Cytological differences in leaf explants of chicory
genotypes K59 and C15 cultured under SE-inducing
conditions. Light microscopic images of stages in direct SE
in leaf explants from the genotypes K59 (a, b, c) and C15 (d,
e, f); semi-thin (3 μm) sections from leaf explants at day 4 (a,
b, d, e) and day 8 (c, f) of culture under SE-inducing condi-
tions stained with toluidine blue. At day 4, reactivating (*)
and reactivated (**) cells can be observed in K59 (a), a well
as some recently divided cells (b; DC), whereas in C15 only
some reactivating cells are present (c, d). At day 8, numerous
somatic embryos (SE) can be observed in K59 explants. ST =
stomate; VB = vascular bundle. Bars: 30 μm.
BMC Plant Biology 2007, 7:27 />Page 4 of 12
(page number not for citation purposes)
struction of contigs. To identify OCs that potentially rep-
resented the same gene, sequential BlastN searches (E-
value ≤ E
-30
) were performed against assembled ESTs from
lettuce (assembled ESTs from CGPD: Compositae
Genome Project Database, [10]), sunflower (assembled
ESTs from CGPD), and Zinnia elegans L. (assembled ESTs
from PGDB: Plant Genome Database, [11]) (Tab. 2). The
hierarchy of the searches was determined by the botanical
proximity of the species; chicory and lettuce belonging to
the tribe Lactuaceae of the subfamily Cichorioideae of the
Asteraceae, whereas sunflower and Z. elegans belong to the
subfamily Asteroideae [12]. In parallel, BlastX searches
were performed using the non-redundant (NR) GeneBank
database [13], and the Arabidopsis translated coding
sequences [14].
The results of the BlastN searches in the Asteraceae data-
bases showed a high proportion of 'no hits found', i.e.
1035 ESTs of chicory (31%) were not represented in Aster-
aceae databases. In comparison, only 13–17% of the chic-
ory ESTs did not match to any sequence in the Arabidopsis
and Genebank NR databases (Tab. 2). Furthermore, the
results quite often suggested that OCs that were clearly
distinguished by our OC-criteria, as well as by the results
of the BlastX searches, matched to the same Asteraceae
contig. Taken together, this clearly indicated that the
CGPD and PGDB databases were not yet sufficiently
exhaustive to represent the Asteraceae transcriptomes.
It was therefore decided to use the results of the BlastX
searches to assemble the chicory OCs into contigs. In a
first attempt, OCs and singletons with the same best hit
(E-value ≤ E
-5
) in the AtGDB were considered to represent
the same gene. However, ESTs grouped in different OC,
because they had less than 95% sequence identity, were
sometimes found to match with the same Arabidopsis
coding sequence. In these cases very often each OC
matched with a different sequence in the NR GeneBank
database (see Additional file 1). This may be indicative for
a higher number of duplicated genes in chicory than in
Arabidopsis. These analyses led to the formation of 189
contigs by the regrouping of 111 OCs with at least 2 ESTs,
and 303 singletons. Together with the remaining 1,888
OCs, we estimated that the 3,348 ESTs selected from the E
and NE library represent at maximum 2,077 genes (see
Additional file 1). From these 2,077 annotated genes,
1,061 genes (51%) were composed of ESTs exclusively
originating from the E library, 730 genes (35%) of ESTs
exclusively originating from the NE library, and 286 genes
(14%) of ESTs present in both libraries.
The total number of genes is probably overestimated,
since part of the OCs and contigs containing ESTs without
significant matches may correspond to genes already
accounted for, because they represent untranslated mRNA
regions. If we consider OCs composed of non-matching
ESTs to be part of genes already accounted for, and when
we omit the criterion of 95% identity over a contiguous
sequence of 150 bp to divine an OC, a minimum of 1,698
genes was obtained.
Annotation and functional classification of ESTs
Annotation of the ESTs using BlastX searches against
sequences in NR GeneBank database, revealed that 55%
of the ESTs had a high similarity with the best match (E-
value ≤ E
-30
), and 32% a moderate similarity (E
-30
to E
-5
).
The 13% remaining with an E-value ≥ E
-5
, or with no
match found, was classified as 'no hits found'. The lack of
sequence homology may be related to the average length
of 354 bp for these ESTs, about 120 bp less than the aver-
age sequence length of 471 bp for annotated ESTs (Tab. 3)
[15].
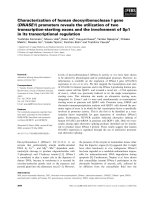
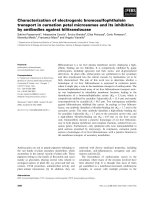
The distribution of the putative functions of the anno-
tated genes was similar for both libraries (Fig. 2), the
major classes being 'function unknown' (26%) (regroup-
ing 'subcellular localization', 'classification not yet clear
cut', and 'unclassified proteins'), 'metabolism' (21%),
'protein synthesis' (8%), 'cellular transport, transport
facilitation and transport routes' (7%), 'protein fate' (6%)
and 'cell rescue, defence and virulence' (5%).
From the 279 ESTs representing genes related to protein
synthesis, 202 (6% of the total number of ESTs) represent
genes encoding ribosomal proteins: 122 and 79 ESTs from
the E and the NE library, respectively. In comparison, only
Table 2: Comparison of Cichorium intybus ESTs with sequences from other species
Database Number of sequences Number of submitted
chicory ESTs
Blast type
(E-value)
Number of
matches
% of matches
Asteraceae Lettuce (CGPD) 19,523 assembled ESTs 3,348 N (1E-30) 2,040* 69
Sunflower (CGPD) 18,031 assembled ESTs 202*
Zinnia (PGDB) 15,859 assembled ESTs 71*
Arabidopsis (AtGDB) 26,719 translated coding
sequences
3,348 X (1E-5) 2,905 87
GeneBank NR >100 gigabases 3,348 X (1E-5) 2,794 84
*The 3348 ESTs of chicory were sequentially submitted to BlastN searches against assembled ESTs from lettuce, sunflower and zinnia.
BMC Plant Biology 2007, 7:27 />Page 5 of 12
(page number not for citation purposes)
Table 3: In silico screening and transcriptional analysis by real-time RT-PCR.
In silico analyses real-time RT-PCR
Acc. nb Contig/OC Putative function E NE P Pred p-value ER 1 ER 2
DT212490 Cont0080 vegetative storage protein, VSP [C. intybus] 5 0 ]0.08;0.07[ E
DT212771
Cont4942 elongation factor EF-2 [P. sativum] 10 0 ]0.006;0.005[ E 0.09435 -0.18 0.38
DT212374
Cont9008 Shaggy-like kinase tetha [A. thaliana] 5 0 ]0.08;0.07[ E
DT212650
OC0603_a methionine synthase [S. tuberosum] 6 0 ]0.05;0.04[ E
DT212300
OC1814 No hits found 5 0 ]0.08;0.07[ E <0.000001* 2.00* 1.90*
DT212502
OC1929 G protein beta subunit [N. plumbaginifolia] 5 0 ]0.08;0.07[ E <0.000001* 1.25* 1.24*
DT213897
Cont0011 catalase 3 [H. annuus] 4 8 ]0.09;0.08[ NE <0.000001* -3.85* -3.88*
DT211305
Cont0015 L-asparaginase [G. max] 0 3 ]0.07;0.06[ NE 0.03694 0.18 0.40
DT211671
Cont0026 ss-1,3-glucanase [C. intybus × C. endivia] 0 3 ]0.07;0.06[ NE <0.000001* -2.87* -4.10*
DT213305
Cont0060 3-hydroxy-3-methylglutaryl coenzyme A reductase [S. tuberosum] 8 15 ]0.03;0.02[ NE <0.000001* -2.30* -2.03*
DT212144
Cont0082 putative argininosuccinate synthase [A. thaliana] 0 4 ]0.03;0.02[ NE 0.00095* 1.23* 0.70*
DT210848
Cont0112 heat shock protein 70 like protein [A. thaliana] 0 3 ]0.07;0.06[ NE
DT211362
Cont0201 putative auxin-induced protein [A. thaliana] 0 5 ]0.02;0.01[ NE <0.000001* -1.88* -2.03*
DT211152
Cont0206 fasciclin-like AGP 12 [P. alba × P. tremula] 0 4 ]0.03;0.02[ NE 0.00538 -0.25 -0.40
DT211657
Cont1237 pre-pro-cysteine proteinase [L. esculentum] 0 4 ]0.03;0.02[ NE <0.000001* -2.32* -3.00*
DT211016
Cont1242 unknown protein [A. thaliana] 0 3 ]0.07;0.06[ NE
DT210870
Cont9022 unknown yeast pheromone receptor-like protein AR781 [A. thaliana] 0 3 ]0.07;0.06[ NE
DT213289
Cont9039 metallothionein 1 [A. tripolium] 14 26 ]0.004;0.003[ NE <0.000001* -2.45* -2.45*
DT210772
OC0003_b glutathione S-transferase GST 13 [G. max] 0 4 ]0.03;0.02[ NE
DT212623
OC0023_a glutathione transferase [H. muticus] 3 11 ]0.007;0.006[ NE <0.000001* -2.78* -2.85*
DT211055
OC0168 1-aminocyclopropane-1-carboxylate oxidase [L. esculentum] 0 9 <0.001 NE <0.000001* -3.87* -3.80*
DT210897
OC0178 putative ribosomal S29 protein [A. thaliana] 0 3 ]0.07;0.06[ NE <0.000001* 1.15* 0.70*
DT210805
OC0344 unknown protein [A. thaliana] 0 3 ]0.07;0.06[ NE <0.000001* -1.35* -1.68*
DT211689
OC0378_b putative 60S ribosomal protein L5 [O. sativa] 0 3 ]0.07;0.06[ NE
DT214125
OC0533b lipid transfer protein precursor [M. domestica] 2 7 ]0.04;0.03[ NE 0.06214 -0.18 -0.25
DT211562
OC0559 putative phosphatase type 2C [A. thaliana] 0 3 ]0.07;0.06[ NE 0.01554 -0.25 -0.25
DT211372
OC0631 No hits found 0 3 ]0.07;0.06[ NE 0.03982 0.20 0.20
DT211599
OC0686 unknown protein [A. thaliana] 0 4 ]0.03;0.02[ NE <0.000001* -3.37* -3.23*
DT211633
OC0696 aquaporin [H. annuus] 0 3 ]0.07;0.06[ NE <0.000001* -3.72* -3.52*
DT211922
OC0724 cellulose synthase family protein [A. thaliana] 0 3 ]0.07;0.06[ NE <0.000001* -2.60* -2.47*
BMC Plant Biology 2007, 7:27 />Page 6 of 12
(page number not for citation purposes)
DT211365 OC0727_b G protein beta subunit-like [M. sativa] 0 5 ]0.02;0.01[ NE
DT210839
OC0758 putative RNA-binding protein [A. thaliana] 0 5 ]0.02;0.01[ NE 0.01647 0.08 0.18
DT212897
OC1229 sucrose synthase isoform I [D. carota] 1 5 ]0.05;0.04[ NE 0.30612 0.08 -0.32
DT212813
OC0311_a acidic ribosomal protein P0 [G. max] 6 2 <0.000001* 1.62* 1.68*
DT212479
OC0378_c 60S ribosomal protein L5 [C. sativus] 1 3 <0.000001* 0.58* 0.85*
DT211177
OC0805_a putative 60S ribosomal protein L35 [A. thaliana] 0 1 0.00001* 1.10* 0.73*
DT212655
OC1088 ribosomal protein L12 [C. intybus] 1 1 0.00013* 1.25* 0.95*
DT213187
OC1549_a 40S ribosomal protein S17 [L. esculentum] 2 1 <0.000001* 1.72* 1.55*
DT212250
OC2155_a P40-like ribosomal protein [D. carota] 3 0 0.00003* 0.58* 0.82*
DT212554
Cont0001 glyceraldehyde-3-phosphate dehydrogenase [S. alba] 9 2 <0.000001* 1.20* 0.97*
DT210799
Cont0006 1-aminocyclopropane-1-carboxylate oxidase [P. hortorum] 2 5 <0.000001* -3.82* -4.28*
DT211255
Cont0024 seed specific protein Bn15D17A [B. napus] 3 5 0.25124 0.00 0.13
DT211067
Cont6402 putative leaf development protein Argonaute [A. thaliana] 1 1 <0.000001* 1.37* 1.37*
DT210888
OC0071 14-3-3 protein [S. tuberosum] 0 1 <0.000001* -1.78* -2.05*
DT210862
OC0172 embryogenic callus protein 181 [D. carota] 0 2 0.56355 -0.28 0.05
DT211413
OC0565_a acetoacetyl-CoA thiolase [A. thaliana] 0 2 <0.000001* -2.52* -2.42*
DT212452
OC0603_b cobalamine-independent methionine synthase [S. scutellarioides] 7 1 <0.000001* -1.90* -1.57*
DT212234
OC0687 arabinogalactan protein [D. carota] 7 1 <0.000001* 6.73* 6.82*
DT212237
OC0834 chromatin remodeling factor CHD3 [A. thaliana] 1 0 0.00042 0.50 0.50
DT212556
OC1068 leaf senescence protein-related (YLS7) [A. thaliana] 2 0 <0.000001* -1.55* -1.38*
DT212596
OC1155 xyloglucan endotransglycosylase [M. domestica] 2 0 0.00011 -0.57 -0.52
DT212803
OC1211 BTB/POZ domain-containing protein [A. thaliana] 2 0 0.00365 0.38 0.42
DT213079
OC1347 putative ethylene response element binding protein [N. tabacum] 1 2 0.00007* -1.45* -1.22*
DT212789
OC1427_b Cell division control protein 48 homolog E [A. thaliana] 2 0 0.00001* 0.60* 0.60*
DT213276
OC1785_a H(+)-transporting ATPase [P. vulgaris] 2 0 0.00002* -0.87* -0.93*
DT212233
OC1796 ring domain containing protein [C. annuum] 10 8 <0.000001* -2.18* -2.35*
DT212829
OC1960 tuber-specific/sucrose-responsive element binding factor [S. tuberosum] 4 0 0.00021 -0.15 -0.65
Contig/OC: contig or OC (Original Cluster regrouping identical ESTs) number. Putative functions were determined by a BlastX search (E-value ≤ E
-5
) against the non redundant GenBank database.
E and NE: number of ESTs from the E and the NE library, respectively; p: probability related to the in silico prediction calculated according to Audic and Claverie [25]. Pred (prediction) indicates in
which genotype (E or NE) the gene was found preferentially expressed. ER: expression ratios (log
2
) between the embryogenic and the non-embryogenic genotype at day 4 of SE culture estimated
by real-time RT-PCR. ER1 and ER2 designate the expression ratios obtained from 2 independent first strand cDNA synthesis reactions (see Methods). The asterisk indicates genes that were found
to be differentially expressed according the thresholds applied (see Methods).
Table 3: In silico screening and transcriptional analysis by real-time RT-PCR. (Continued)
BMC Plant Biology 2007, 7:27 />Page 7 of 12
(page number not for citation purposes)
1.3% of 112,500 ESTs for Arabidopsis were found to rep-
resent genes encoding ribosomal proteins [16].
The most represented genes in our libraries are a metal-
lothionein (OC9039) with 40 ESTs (14 and 26 from the E
and NE library, respectively) of the 175 ones related to
'cell rescue, defence and virulence' and a gene encoding a
3-hydroxy-3-methylglutaryl coenzyme A reductase
(Cont0060) related to 'metabolism' and represented by 8
ESTs in the E library and 15 in the NE library.
The distributions of the putative functions of the anno-
tated genes, except for those encoding ribosomal proteins,
resembled those reported for genes or cDNAs in Arabi-
dopsis and other plant species [17-19], including the
about 25% sequences with undetermined functions.
Apparently the SSH procedure had not effected an enrich-
ment of ESTs representing genes implemented in particu-
lar functions in one of the genotypes, at least not at this
level of functional assignment.
In silico screening and real time RT-PCR
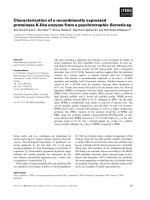
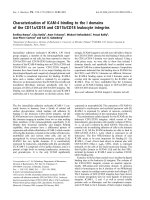
The large proportion of the annotated genes represented
by single ESTs (1,461 of 2,077, i.e. 70%) (Fig. 3) seems to
indicate an efficient normalisation of the libraries; only
3% of the genes were represented by more than 5 ESTs.
Furthermore, only 14% of the annotated genes in the dif-
ferent functional groups were represented by ESTs from
both libraries (Tab. 1), as could be expected for an ad ran-
dom selection of the ESTs from libraries that were effec-
tively normalised.
To verify further the efficiency of the normalisation real-
ised by the SSH procedure, we performed an in silico sub-
traction, or 'digital northern', on all the ESTs from our
libraries. This analysis is based on the relation between
the abundance of ESTs in a cDNA library and the differen-
tial expression of the corresponding genes [20,21], and is
ordinarily performed on ESTs in cDNA libraries that are
not normalized [22,23]. Inversely, applying this analysis
may provide a measure for the normalisation achieved,
and as normalization is nearly always imperfect, in partic-
ular for very abundant transcripts [24], it may also reveal
ESTs representing genes preferentially expressed in the E
or NE genotype.
Using the significance test of Audic and Claverie [25], it
was found that from the 2,077 annotated genes, only 33
Distribution of the putative functions of 3348 ESTs from the E (a) and NE (b) libraryFigure 2
Distribution of the putative functions of 3348 ESTs from the E (a) and NE (b) library. Classification was performed
according to the Munich Information centre for Proteins Sequences (MIPS) functional catalogue using BlastX search results
against Arabidopsis coding sequences from the Arabidopsis genomic database (AtGDB). 1: Metabolism; 2: Energy; 3: Storage
protein; 4: Cell cycle and DNA processing; 5: Transcription; 6: Protein synthesis; 7: Protein fate (folding, modification, destina-
tion); 8: Protein with binding function or cofactor requirement (structural or catalytic); 9: Cellular transport, transport facilita-
tion and transport routes; 10: Cellular communication/signal transduction mechanism; 11: Cell rescue, defense and virulence;
12: Interaction with the cellular environment; 13: Interaction with the environment (Systemic); 14: Transposable elements, viral
and plasmid proteins; 15: Cell fate; 16: Development (Systemic); 17: Biogenesis of cellular components; 18: Cell type differenti-
ation; 19: Function unknown (regrouping Subcellular localization, Classification not yet clear cut, and Unclassified proteins); 20:
No hits found.
BMC Plant Biology 2007, 7:27 />Page 8 of 12
(page number not for citation purposes)
(1.6%) were expected to be differentially expressed; 6
genes preferentially expressed in the E genotype, and 27 in
the NE genotype (Tab. 3). For 24 of the 33 predicted genes
the abundance of transcripts was measured by real-time
RT-PCR (Tab. 3). The results confirmed the differentially
expression of 14 genes, i.e. 2 preferentially expressed in
explants from the E genotype, and 12 in explants from the
NE genotype. For 2 genes that were predicted to be prefer-
entially expressed in the NE genotype, it was found that
they were actually preferentially expressed in the E geno-
type. The remaining 8 genes were found to be not differ-
entially expressed.
The relative low number of differentially expressed genes
predicted by in silico subtraction suggested a high effi-
ciency of the normalisation realised by SSH. It was
reported that normalisation and enrichment by SSH is
ineffective for abundant transcripts in tester or driver sam-
ples [24], leading to an elevated number of background
clones. Indeed, the real-time RT-PCR experiments showed
that in comparison to the level of transcripts for actin-2,
transcripts of some genes were abundant (> 100-fold
higher than actin-2) in explants of both K59 and C15,
where as for other genes the level of transcripts was con-
siderably lower (< 50-fold) than for actin-2 (data not
shown). These results indicated that there was no relation
between transcript level and EST representation in the
libraries.
For another set of 24 genes, some of them selected
because they have been reported to play key roles during
early stages of somatic embryogenesis or during plant
development (e.g. OC0687: arabinogalactan protein [26];
Cont6402: Argonaute [27]), others because they were rep-
resented by several ESTs in the libraries (e.g. Cont0001
glyceraldehyde-3-phosphate dehydrogenase; OC1796:
ring domain containing protein; OC0311_a, OC0378_c:
ribosomal proteins), the abundance of transcripts was
also measured by real-time RT-PCR (Tab. 3). This led to
the identification of an additional 18 differentially
expressed genes; 10 in the E genotype, and 8 in the NE
genotype (Tab. 3).
Discussion
An E and a NE cDNA-library were generated by SSH using
mRNAs isolated from leaf explants from two chicory gen-
otypes differing in SE capacity cultured for 4 days under
SE-inducing conditions, and a total of 3,348 ESTs from
both libraries turned out to represent a maximum of
2,077 genes. Real time RT-PCR analyses of the expression
of 48 annotated genes revealed that after 4 days of culture
under SE-inducing conditions, 14 genes were preferen-
tially expressed in the E genotype, and 20 genes in the NE
genotype (Tab. 3). This indicated that the E and NE library
contain ESTs representing genes differentially expressed in
K59 or C15, even though ESTs found present in one
library not necessarily represented a gene exclusively
expressed in the corresponding genotype. In addition,
some of the differences in gene expression between the
two lines might be the result of genetic differences that
have nothing to do with SE capacity. As we intend to use
ESTs from both libraries for future studies on gene expres-
sion during SE, the most important contribution of SSH
in the construction of the libraries was probably the nor-
malisation achieved, heightening the possibility to find
ESTs representing feebly expressed genes.
We chose to construct the E and NE library using mRNAs
isolated from explants of K59 and C15 cultured for 4 days
under SE conditions on the basis of cytological observa-
tions, in particular the occurrence of the first cell divisions
in explants of K59. Seven genes encoding ribosomal pro-
teins were tested by real-time RT-PCR, and were all found
to be preferentially expressed in explants of K59, the
embryogenic genotype (Tab. 3). This probably reflects
ribosome biogenesis required for the preparation of cells
in the explants to enter the SE transdifferentiation path-
way, and in particular to reinitiate cell divisions. The rela-
tion between augmented expression of genes encoding
ribosomal proteins and cell divisions has been docu-
mented in several studies (e.g. [28,16]). In Z. elegans,
many genes encoding ribosomal proteins were found to
be preferentially expressed during the transdifferentiation
of mesophyll cells into xylem cells [18], and in aspen rel-
ative high numbers of ESTs representing ribosomal pro-
tein genes were reported for cDNA libraries from
meristematic tissues [29,30]. In addition to the ribosomal
protein-encoding genes, preferential expression in K59
was detected for 2 genes implicated in cell cycling: a gene
encoding a CDC48-like protein (OC1427_b) [31] and a G
protein beta subunit-like protein (OC1929) [32] (Tab. 3).
Distribution and number of assembled sequencesFigure 3
Distribution and number of assembled sequences.
BMC Plant Biology 2007, 7:27 />Page 9 of 12
(page number not for citation purposes)
The above results indicated that the preferential expres-
sion of genes implicated in cell division in K59 concurs
with the cytological observations. Cells in the explants of
K59 that enter the cell division cycle have lost their origi-
nal identity, and most of them seem to enter the SE path-
way thereafter. A gene (Cont6402) encoding a protein
having a high homology with the protein Argonaute 1
(AGO1) was found to be expressed preferentially in the
explants of K59 at day 4 of SE culture. In Arabidopsis, ago1
mutants present loss of stem cell maintenance and failure
of axillary meristem formation [33], and it was shown
that AGO1, together with ZWILLE/PINHEAD, regulates
stem cell maintenance via SHOOT MERISTEMLESS
(STM) [27]. A gene homologous to STM has been identi-
fied in chicory and was shown to be differentially
expressed early during SE (S. Da Silva and M-C. Quillet,
unpublished results). Furthermore, 2 ESTs from the E
library (DT212395 and DT13465; see Additional file 1)
were found to represent a gene homologous to ZWILLE/
PINHEAD in Arabidopsis. The early expression during SE
of genes regulating stem cell maintenance may indicate
that they also play a role in the transdifferentiation proc-
ess accompanying SE (cf. [2]).
Another interesting result may be the preferentially
expression in K59 of a gene (OC0687) putatively encod-
ing an arabinogalactan protein (AGP) similar to DcAGP1
from carrot. DcAGP1 encodes a non-classical AGP with
strong similarity to a family of basic proline-rich proteins
[34]. AGPs are supposed to be involved in many signaling
pathways [35], and were reported to be essential for the
formation of somatic embryos in chicory [26].
The cytological studies indicated that in C15 cells reacted
differently to the SE-inducing culture conditions, possibly
by failing to progress in cell reactivation (Fig. 1). The dif-
ferences in gene expression between C15 and K59
observed at day 4 of SE culture suggests that in contrast to
the opportunistic response as observed for K59, cells in
the explants from C15 reacted to the stresses applied by a
defensive response. This was illustrated by the preferential
expression in C15 of genes involved in the ethylene sig-
nalling pathway: two genes encode ACC oxidases
(Cont0006 and OC0168), and a gene encodes an ethylene
response element binding protein (OC1347). Some other
genes preferentially expressed in C15, also related to
defence, encode a metallothionein (Cont9039), a glutath-
ione transferase (OC0023_a), and a leaf senescence-
related protein (OC1068) [36,37].
Conclusion
The E and NE cDNA libraries described in this paper will
be important new tools in our ongoing efforts to unravel
the molecular mechanisms underlying the early stages of
direct somatic embryogenesis in chicory. None of the
genes identified in this study has been identified as such
previously in our laboratory [5-8]. This is probably due to
the limited number of clones from our libraries that were
sequenced, to the differences in the timing and way of
selection, and/or differences between the E and NE geno-
types used for screening. The results of the real-time PCR
analysis showed that our libraries contain ESTs represent-
ing genes differentially expressed in the E genotype K59
and the NE genotype C15. It remains to be established,
however, which of these genes are implicated in the differ-
ent responses of the explants from both genotypes upon
SE culture conditions, and in particular in the early stages
of SE. A transcriptional analysis by cDNA microarray is
currently performed for explants of K59 and C15 during
the first 6 days of SE culture. This should lead to the iden-
tification of genes differentially expressed during SE, and
their expression patterns may provide clues on their roles
in this process. Furthermore, preliminary experiments
indicate that the number of SE formed in explants from
plants in progenies obtained after crossing K59 with a
compatible low embryogenic genotype shows a continu-
ous quantitative distribution, i.e. behaves as a quantitative
trait. These plants are polymorphic for a large number of
molecular markers, and a molecular genetic map for this
progeny has been realized in our laboratory. This will
serve to identify quantitative trait loci (QTL) for SE, as
well as to map genes differentially expressed during SE.
Co-localization of genes differentially expressed during SE
with QTL for this process may help to identify those genes
of which the expression is causally implicated in direct SE
in chicory.
This report also presents a medium scale sequencing of
cDNAs representing genes in chicory. In fact, of the 3,348
ESTs selected from the E and NE library (additional file 1),
only 13 showed homologies to 11 chicory sequences of
the total 218 entries for chicory already present in the
GeneBank NR database. Though modest in comparison to
databases for some other Asteraceae, like lettuce, sun-
flower, and Z. elegans, our database for chicory may serve
as a source for comparative studies in this important plant
family.
Methods
Somatic embryogenesis culture, tissue collection and RNA
extraction
The Cichorium intybus embryogenic (K59) and non-
embryogenic (C15) genotypes were grown in the green-
house, and maintained by vegetative propagation. Leaves
from six-leaves stage plants were surface sterilized, and cut
up in fine strips (2 cm × 0.2 cm). Each culture contained
15 explants from a single leaf in 20 ml M17S20 culture
medium [3], and was placed in darkness at 35°C under
constant agitation (80 rpm). Explants were collected at
day 4 of SE culture and RNA from each culture was
BMC Plant Biology 2007, 7:27 />Page 10 of 12
(page number not for citation purposes)
extracted using the Tri reagent kit (Euromedex) according
to the instructions of the manufacturer. RNA integrity was
checked by capillary electrophoresis (Agilent 2100 Bioan-
alyser, Agilent Technologies), and RNA quantities were
calculated from the optical density at 260 nm.
Microscopy
Leaf explants were fixed in a formaldehyde/acetic acid/
ethanol solution (3.5/6.5/90, v/v/v), dehydrated through
a range of increasing concentrations of ethanol, infiltrated
with JB4 wax (Polysciences), and sectioned at 3 μm with a
Leica RM 2065 microtome. After staining with a 0.5% (w/
v) aqueous solution of toluidine blue, the sections were
examined by light microscopy (Olympus).
Construction of the subtractive cDNA libraries
RNA isolated from the explants of 6 and 9 independent
cultures of K59 and C15, respectively, were pooled in
order to create the SSH libraries. Poly(A)
+
RNA was
extracted using the Quick Messenger RNA kit (Talent)
according to the manufacturer's instructions. Two subtrac-
tive libraries were generated using the PCR Select cDNA
Subtraction Kit (Clontech), according to established pro-
tocols, using 4 μg of poly(A)
+
RNA for the generation of
first strand cDNA. The E library was obtained using the
cDNA of K59 (embryogenic) and C15 (non-embryogenic)
genotypes as 'tester' and 'driver', respectively. To create the
NE library, 'tester' and 'driver' cDNA were reversed. PCR-
amplified subtracted cDNA were cloned in pGEM-T vector
(Promega), transformed into JM109 competent cells
(Promega), and plated on LB plates containing ampicillin
(100 μg/ml), X-gal (80 μg/ml), and IPTG (0.5 mM).
Transformed white colonies were picked and grown over-
night in LB containing ampicillin (50 μg/ml) in 96-well
plates at 37°C and 180 rpm. Glycerol was added to obtain
30% (v/v), and the plates were stored at -80°C. Prior to
sequencing, clones were transferred into LB 96 deep well
plates and placed overnight at 37°C and 180 rpm. Plas-
mids were isolated from the overnight-grown bacterial
cultures using the Plasmid Miniprep96 Kit (Millipore).
Single-run sequencing was carried out in an ABI3700
DNA Sequencer (Applied Biosystems) using the universal
T7 primer.
EST analysis
ESTs were cleaned of vector and primers sequences using
a Perl script (see Additional file 2, script 1). A total of
3,422 EST sequences have been submitted [GenBank:
DT210770
to DT214189, DT317741 and DT317742].
Identical ESTs from the E and/or the NE library were iden-
tified using the local BlastN search included in the BioEdit
sequence alignment editor [38]. To assemble ESTs into
contigs, BlastN and BlastX searches were performed
against EST contigs of different Asteraceae species and
against sequences of the non-redundant (NR) GeneBank
database and against the Arabidopsis translated coding
sequences (see results). Perl scripts were used to retrieve
information from the Blast output files (see Additional
file 2, scripts 2 and 3). Sequences were annotated using
the results of BlastX searches, and were classified accord-
ing to the MIPS (Munich Information Centre for Proteins
Sequences) functional catalogue [39]. Significance levels
for in silico analysis of differential EST abundance between
E and NE library were computed using the statistical pro-
gram of Audic and Claverie [25,40].
Real-time RT-PCR
One microgram of total RNA from each genotype was
reverse transcribed using the First Strand Synthesis Kit
(BioRad). Fourty eight gene primer pairs were designed
(see Additional file 3) by using the Beacon Designer soft-
ware (Biosoft). Real-time PCR were carried out with the
Quantitech SYBR green kit (Qiagen) in a final volume of
20 μl, including 375 nM of each primer, and 5 μl of a 5-
fold dilution of first strand cDNA. PCR reactions were per-
formed in 96-well optical reaction plates (ABgene) using
an iCycler iQ apparatus (Biorad). The reactions were
heated for 10 min to 95°C followed by 50 cycles of dena-
turation for 30 sec at 95°C and annealing-extension for
45 sec at 60°C. For each pair of primers, the PCR effi-
ciency (e) was calculated using different template dilu-
tions and the equation (1+e) = 10
(-1/slope)
, as described by
Pfaffl [41]. Only primer pairs with an efficiency between
0.85 and 1.15, and a determination coefficient (R
2
) of the
standard curve equal or superior to 0.985, were consid-
ered valuable. At the end of the amplification experiment,
a melting curve was realized between 55°C to 95°C by
steps of 0.5°C, to ensure that the signal corresponded to a
single PCR product. For each target gene, PCR reactions
were performed in triplicate from two first strand cDNA
synthesis reactions; a biological repetition for the embry-
ogenic genotype (mRNAs from 2 independent cultures),
and a technical repetition for the non-embryogenic geno-
type (mixture of mRNAs from 3 cultures). The delta-delta
cycle threshold (ΔΔC
T
) method for comparing the relative
expression between genotypes was applied as described
by Livak and Schmittgen [42], using as control a gene
encoding actin-2 of chicory isolated in the laboratory (acc.
num. DY800534). Data were subjected to analysis of var-
iance for each gene (GLM procedure of SAS; [43]), using
the following model Y
ij
= μ + G
i
+ S
j
+ e
ij
, with Y
ij
the ΔΔC
T
,
μ the overall mean, G
i
the genotype effect, R
j
the repetition
effect, and e
ij
the residual. The differential expression
between the E and NE genotype was estimated using the
least-square estimates of the means of the ΔΔC
T
computed
from the model (LSMEANS option of the GLM proce-
dure). Genes were considered as differentially expressed
when the p-value associated with the F-value (Fisher-Sne-
decor) calculated for G
i
was <0.001, and when the mean
ΔΔC
T
was ≤-0.6 or ≥0.6.
BMC Plant Biology 2007, 7:27 />Page 11 of 12
(page number not for citation purposes)
List of abbreviations used
E/NE: embryogenic/non-embryogenic; EST: expressed
sequence tag; SE: somatic embryogenesis; SSH: suppres-
sion subtractive hybridization
Authors' contributions
SL prepared clones for sequencing, performed analyses
and functional classification of ESTs, in silico subtraction
and real-time RT-PCR analyses and drafted the manu-
script. TH highly contributed to the interpretation of the
results and to the redaction of the manuscript. JLH partic-
ipated in planning and supervision of the study, and par-
ticipated in the redaction of the manuscript. MCQ
designed the study, collected plant tissues, performed
RNA extractions and construction of the SSH libraries,
participated in the redaction of the manuscript, and is the
corresponding author. All authors read and approved the
final manuscript.
Note added in proof
During the process of submission, 38,323 EST sequences
from C. intybus were added to the Compositae Genome
Project Database, and the sequences of the 3,348 ESTs
reported in this paper are now included in this database
/>.
Additional material
Acknowledgements
We would like to thank Bruno Deprez (Florimond-Deprez, Cappelle-en-
Pévèle, France) for providing seeds of the Koospol population, Stéphane
Audic (IGS, Marseille, France) for his help in the in silico subtraction analysis,
Christine Hubans (Genoscreen, Laboratoire d'Etudes Transcriptomiques et
Génomiques Appliquées UMR8161 IFR142, Institut Pasteur de Lille, France)
for her advice on the use of the Perl script, and Anne-Sophie Blervacq for
assistance in the cytological analyses. Part of this work was financed by a
'Contrat Plan Etat-Region' to the UMR USTL/INRA 1281. SL was supported
by a doctoral fellowship from the Ministère délégué à l'Enseignement
supérieur et à la Recherche, France.
References
1. Zimmerman JL: Somatic Embryogenesis: A Model for Early
Development in Higher Plants. Plant Cell 1993,
5(10):1411-1423.
2. Feher A, Pasternak TP, Dudits D: Transition of somatic plant
cells to an embryogenic state. Plant Cell Tissue and Organ Culture
2003:201-228.
3. Dubois T, Guerida M, Dubois J, Vasseur J: Direct somatic embry-
ogenesis in leaves of Cichorium. An histological and SEM
study of early stages. Protoplasma 1991, 162:120-127.
4. Blervacq AS, Dubois T, Dubois J, Vasseur J: First divisions of
somatic embryogenic cells in Cichorium hybrid "474". Proto-
plasma 1995, 186:163-168.
5. Hendriks T, Scheer I, Quillet MC, Randoux B, Delbreil B, Vasseur J,
Hilbert JL: A nonsymbiotic hemoglobin gene is expressed dur-
ing somatic embryogenesis in Cichorium. Biochim Biophys Acta
1998, 1443(1-2):193-197.
6. Helleboid S, Chapman A, Hendriks T, Inze D, Vasseur J, Hilbert JL:
Cloning of beta-1,3-glucanases expressed during Cichorium
somatic embryogenesis. Plant Mol Biol 2000, 42(2):377-386.
7. Galland R, Randoux B, Vasseur J, Hilbert JL: A glutathione S-trans-
ferase cDNA identified by mRNA differential display is
upregulated during somatic embryogenesis in Cichorium.
Biochim Biophys Acta 2001, 1522(3):212-216.
8. Randoux B, Quillet MC, Rambaud C, Vasseur J, Hilbert JL: Identifi-
cation of cDNAs encoding Rab-related GTP-binding proteins
expressed during somatic embryogenesis in Cichorium. Plant
Science 2002, 162(3):413-422.
9. Diatchenko L, Lau YF, Campbell AP, Chenchik A, Moqadam F, Huang
B, Lukyanov S, Lukyanov K, Gurskaya N, Sverdlov ED, Siebert PD:
Suppression subtractive hybridization: a method for gener-
ating differentially regulated or tissue-specific cDNA probes
and libraries. Proc Natl Acad Sci U S A 1996, 93(12):6025-6030.
10. Compositae Genome Project Database [http://
cgpdb.ucdavis.edu/compositae]
11. Plant Genome Database [ />]
12. Bremer K: Asteraceae cladistics & classification. Portland, Ore-
gon , Timber Press; 1994.
13. GeneBank database [ />index.html]
14. Arabidopsis thaliana Genome Database [nt
gdb.org/AtGDB/]
15. Kirst M, Johnson AF, Baucom C, Ulrich E, Hubbard K, Staggs R, Paule
C, Retzel E, Whetten R, Sederoff R: Apparent homology of
expressed genes from wood-forming tissues of loblolly pine
Additional file 1
Detailed data concerning ESTs assembling, annotation and classifica-
tion of the 3348 ESTs. In the first three columns, the accession numbers
from GenBank of ESTs, their clone ID from our libraries, and their
sequence length, are indicated. The columns 4 to 6 represent the assem-
bling of identical ESTs into OCs (original clusters), with the OC ID, and
the number of ESTs representing each OC in the E and the NE library.
The field 'Contig' represents the assembling of EST corresponding to a
same gene. 'Contig' includes the contig ID, and the number of ESTs rep-
resenting each gene in the E and the NE library. The first hit from the
BlastX search against the non-redundant Genbank database is provided
for each OC. The detailed fields of the BlastX search against the NR Gen-
bank database are ID, Putative function, Length, Score, E-value, Identity,
Homology, Gap, Frame, and Alignment. The first hit from the BlastX
search against the Arabidopsis translated coding sequences is provided for
all ESTs. Detailed fields of this second BlastX search are ID, E-value, and
the functional classification according to the MIPS functional catalogue.
Click here for file
[ />2229-7-27-S1.xls]
Additional file 2
Perl scripts used for ESTs analyses. Script 1: cleaning ESTs of vector and
primers sequences. Script 2: local BlastN output parser. Script 3: BlastX
output parser
Click here for file
[ />2229-7-27-S2.txt]
Additional file 3
Primers used for real-time RT-PCR. Oligonucleotide primers were
designed for selected genes using the Beacon Designer software of Biosoft.
Putative functions were defined according to BlastX searches against the
non-redundant GeneBank database.
Click here for file
[ />2229-7-27-S3.xls]
Publish with Bio Med Central and every
scientist can read your work free of charge
"BioMed Central will be the most significant development for
disseminating the results of biomedical research in our lifetime."
Sir Paul Nurse, Cancer Research UK
Your research papers will be:
available free of charge to the entire biomedical community
peer reviewed and published immediately upon acceptance
cited in PubMed and archived on PubMed Central
yours — you keep the copyright
Submit your manuscript here:
/>BioMedcentral
BMC Plant Biology 2007, 7:27 />Page 12 of 12
(page number not for citation purposes)
(Pinus taeda L.) with Arabidopsis thaliana. Proc Natl Acad Sci U
S A 2003, 100(12):7383-7388.
16. Barakat A, Szick-Miranda K, Chang IF, Guyot R, Blanc G, Cooke R,
Delseny M, Bailey-Serres J: The organization of cytoplasmic
ribosomal protein genes in the Arabidopsis genome. Plant
Physiol 2001, 127(2):398-415.
17. Bey M, Stuber K, Fellenberg K, Schwarz-Sommer Z, Sommer H, Sae-
dler H, Zachgo S: Characterization of antirrhinum petal devel-
opment and identification of target genes of the class B
MADS box gene DEFICIENS. Plant Cell 2004, 16(12):3197-3215.
18. Demura T, Tashiro G, Horiguchi G, Kishimoto N, Kubo M, Matsuoka
N, Minami A, Nagata-Hiwatashi M, Nakamura K, Okamura Y, Sassa N,
Suzuki S, Yazaki J, Kikuchi S, Fukuda H: Visualization by compre-
hensive microarray analysis of gene expression programs
during transdifferentiation of mesophyll cells into xylem
cells. Proc Natl Acad Sci U S A 2002, 99(24):15794-15799.
19. The Arabidopsis Genome Initiative: Analysis of the genome
sequence of the flowering plant Arabidopsis thaliana. Nature
2000, 408:796–815.
20. Lee NH, Weinstock KG, Kirkness EF, Earle-Hughes JA, Fuldner RA,
Marmaros S, Glodek A, Gocayne JD, Adams MD, Kerlavage AR, et al.:
Comparative expressed-sequence-tag analysis of differential
gene expression profiles in PC-12 cells before and after
nerve growth factor treatment. Proc Natl Acad Sci U S A 1995,
92(18):8303-8307.
21. Okubo K, Hori N, Matoba R, Niiyama T, Fukushima A, Kojima Y, Mat-
subara K: Large scale cDNA sequencing for analysis of quanti-
tative and qualitative aspects of gene expression. Nat Genet
1992, 2(3):173-179.
22. Rajkovic A, Yan MSC, Klysik M, Matzuk M: Discovery of germ cell-
specific transcripts by expressed sequence tag database anal-
ysis. Fertil Steril 2001, 76(3):550-554.
23. Miner D, Rajkovic A: Identification of expressed sequence tags
preferentially expressed in human placentas by in silico sub-
traction. Prenat Diagn 2003, 23(5):410-419.
24. Bui LC, Leandri RD, Renard JP, Duranthon V: SSH adequacy to
preimplantation mammalian development: scarce specific
transcripts cloning despite irregular normalisation. BMC
Genomics 2005, 6:155.
25. Audic S, Claverie JM: The significance of digital gene expression
profiles. Genome Res 1997, 7(10):986-995.
26. Chapman A, Blervacq AS, Vasseur J, Hilbert JL: Arabinogalactan-
proteins in Cichorium somatic embryogenesis: effect of beta-
glucosyl Yariv reagent and epitope localisation during
embryo development. Planta 2000, 211(3):305-314.
27. Kidner CA, Martienssen RA: The role of ARGONAUTE1
(AGO1) in meristem formation and identity. Dev Biol 2005,
280(2):504-517.
28. Dresselhaus T, Cordts S, Heuer S, Sauter M, Lorz H, Kranz E: Novel
ribosomal genes from maize are differentially expressed in
the zygotic and somatic cell cycles. Mol Gen Genet 1999,
261(2):416-427.
29. Ranjan P, Kao YY, Jiang H, Joshi CP, Harding SA, Tsai CJ: Suppres-
sion subtractive hybridization-mediated transcriptome anal-
ysis from multiple tissues of aspen (Populus tremuloides)
altered in phenylpropanoid metabolism. Planta 2004,
219(4):694-704. Epub 2004 May 14
30. Matsubara S, Hurry V, Druart N, Benedict C, Janzik I, Chavarria-
Krauser A, Walter A, Schurr U: Nocturnal changes in leaf
growth of Populus deltoides are controlled by cytoplasmic
growth. Planta 2005:1-14.
31. Feiler HS, Desprez T, Santoni V, Kronenberger J, Caboche M, Traas
J: The higher plant Arabidopsis thaliana encodes a functional
CDC48 homologue which is highly expressed in dividing and
expanding cells. Embo J 1995, 14(22):5626-5637.
32. McKhann HI, Frugier F, Petrovics G, de la Pena TC, Jurkevitch E,
Brown S, Kondorosi E, Kondorosi A, Crespi M: Cloning of a WD-
repeat-containing gene from alfalfa (Medicago sativa): a role
in hormone-mediated cell division? Plant Mol Biol 1997,
34(5):771-780.
33. Lynn K, Fernandez A, Aida M, Sedbrook J, Tasaka M, Masson P, Barton
MK:
The PINHEAD/ZWILLE gene acts pleiotropically in
Arabidopsis development and has overlapping functions
with the ARGONAUTE1 gene. Development 1999,
126(3):469-481.
34. Baldwin TC, Domingo C, Schindler T, Seetharaman G, Stacey N, Rob-
erts K: DcAGP1, a secreted arabinogalactan protein, is
related to a family of basic proline-rich proteins. Plant Mol Biol
2001, 45(4):421-435.
35. Showalter AM: Arabinogalactan-proteins: structure, expres-
sion and function. Cell Mol Life Sci 2001, 58(10):1399-1417.
36. Buchanan-Wollaston V, Earl S, Harrison E, Mathas E, Navabpour S,
Page T, Pink D: The molecular analysis of leaf senescence - a
genomics approach. Plant Biotechnology Journal 2003, 1(1):3-22.
37. Kunieda T, Fujiwara T, Amano T, Shioi Y: Molecular cloning and
characterization of a senescence-induced tau-class Glutath-
ione S-transferase from barley leaves. Plant Cell Physiol 2005,
46(9):1540-1548.
38. BioEdit sequence alignment editor [ />BioEdit/bioedit.html]
39. Munich Information Centre for Proteins Sequences, func-
tional catalogue [ />]
40. Significance of digital gene expression profiles [http://
www.igs.cnrs-mrs.fr/Winflat/winflat.cgi]
41. Pfaffl MW: A new mathematical model for relative quantifica-
tion in real-time RT-PCR. Nucleic Acids Res 2001, 29(9):e45.
42. Livak KJ, Schmittgen TD: Analysis of relative gene expression
data using real-time quantitative PCR and the 2(-Delta Delta
C(T)) Method. Methods 2001, 25(4):402-408.
43. SAS intitute Inc.99. SAS/STAT guide for personal comput-
ers, v8.2 ed. Cary, North Carolina, USA , SAS Institute Inc.