báo cáo khoa học: " A comparative map viewer integrating genetic maps for Brassica and Arabidopsis" pps
Bạn đang xem bản rút gọn của tài liệu. Xem và tải ngay bản đầy đủ của tài liệu tại đây (1.18 MB, 10 trang )
BioMed Central
Page 1 of 10
(page number not for citation purposes)
BMC Plant Biology
Open Access
Database
A comparative map viewer integrating genetic maps for Brassica
and Arabidopsis
Geraldine AC Lim
1,2
, Erica G Jewell
1,2
, Xi Li
1,2
, Timothy A Erwin
1,2
,
Christopher Love
3
, Jacqueline Batley
4
, German Spangenberg
1,2
and
David Edwards*
5
Address:
1
Plant Biotechnology Centre, Primary Industries Research Victoria, Department of Primary Industries, Victorian AgriBiosciences Centre,
1 Park Drive, Bundoora, Victoria 3083, Australia,
2
Victorian Bioinformatics Consortium, Plant Biotechnology Centre, Primary Industries Research
Victoria, Department of Primary Industries, Victorian AgriBiosciences Centre, 1 Park Drive, Bundoora, Victoria 3083, Australia,
3
Division of
Biomathematics and Bioinformatics, Rothamsted Research AL5 2JQ Harpenden, UK,
4
Australian Centre for Plant Functional Genomics, Centre
for Integrated Legume Research and School of Land, Crop and Food Sciences, University of Queensland, Brisbane, QLD 4072, Australia and
5
Australian Centre for Plant Functional Genomics, Institute for Molecular Biosciences and School of Land, Crop and Food Sciences, University of
Queensland, Brisbane, QLD 4072, Australia
Email: Geraldine AC Lim - ; Erica G Jewell - ; Xi Li - ;
Timothy A Erwin - ; Christopher Love - ; Jacqueline Batley - ;
German Spangenberg - ; David Edwards* -
* Corresponding author
Abstract
Background: Molecular genetic maps provide a means to link heritable traits with underlying
genome sequence variation. Several genetic maps have been constructed for Brassica species, yet
to date, there has been no simple means to compare this information or to associate mapped traits
with the genome sequence of the related model plant, Arabidopsis.
Description: We have developed a comparative genetic map database for the viewing,
comparison and analysis of Brassica and Arabidopsis genetic, physical and trait map information. This
web-based tool allows users to view and compare genetic and physical maps, search for traits and
markers, and compare genetic linkage groups within and between the amphidiploid and diploid
Brassica genomes. The inclusion of Arabidopsis data enables comparison between Brassica maps that
share no common markers. Analysis of conserved syntenic blocks between Arabidopsis and collated
Brassica genetic maps validates the application of this system. This tool is freely available over the
internet on />.
Conclusion: This database enables users to interrogate the relationship between Brassica genetic
maps and the sequenced genome of A. thaliana, permitting the comparison of genetic linkage groups
and mapped traits and the rapid identification of candidate genes.
Background
Brassica species represent important crops providing a
major source of cooking oil, vegetables and condiments
across many countries [1,2]. The species relationship of
cultivated Brassicas was described by the "triangle of U"[3]
with the three amphidiploid Brassica species B. juncea
Published: 24 July 2007
BMC Plant Biology 2007, 7:40 doi:10.1186/1471-2229-7-40
Received: 27 February 2007
Accepted: 24 July 2007
This article is available from: />© 2007 Lim et al; licensee BioMed Central Ltd.
This is an Open Access article distributed under the terms of the Creative Commons Attribution License ( />),
which permits unrestricted use, distribution, and reproduction in any medium, provided the original work is properly cited.
BMC Plant Biology 2007, 7:40 />Page 2 of 10
(page number not for citation purposes)
(AABB, 2n = 36), B. napus (AACC, 2n = 38) and B. carinata
(BBCC, 2n = 34) formed through interspecific hybridiza-
tion between the diploid Brassica species, B. rapa (AA, 2n
= 20), B. nigra (BB, 2n = 16) and B. oleracea (CC, 2n = 18)
[4,3]. Brassicas are closely related to the model species,
Arabidopsis thaliana, for which the genome sequence was
determined in 2000 [5]. Molecular genetic mapping has
been applied for several Brassica species with identifica-
tion of genomic regions and molecular genetic markers
associated with heritable traits.
Genetic mapping in Brassicas has been predominantly
based on Restriction Fragment Length Polymorphism
(RFLP) and Simple Sequence Repeat (SSR) molecular
markers [2,6-8]. In total, more than 900 different publicly
available Brassica and Arabidopsis molecular markers have
been mapped onto at least 15 genetic maps, usually
derived from wide crosses, from European and Canadian
cultivars.
Comparative mapping based on the alignment of chro-
mosomes using common molecular markers helps
researchers translate information from one map to
another. Synteny between the genomes of different plant
species was first characterised in grass species by Bevan
and Murphy [9]. More recently, detailed comparisons
within the Brassicaceae has demonstrated the practical
value of comparisons between the genome of Arabidopsis
and cultivated Brassica species [10]. This comparison per-
mits the co-location of related traits from different maps
and across different related species.
Previous comparisons between Brassica and Arabidopsis
have identified significant regions of synteny and duplica-
tion. Lukens et al. [6] identified 34 significant regions
between the Arabidopsis genome and a genetic map of B.
oleracea, representing over 28% of the B. oleracea genetic
map length. Long collinear regions are shared between B.
oleracea linkage group (LG) 1 (O1) and Arabidopsis chro-
mosome 5 (At Ch5), O5 and At Ch1, O3 and At Ch5, as
well as several smaller regions of predicted synteny. In a
more recent study by Parkin et al. [11], syntenic blocks
were identified covering almost 90% of the mapped
length of the B. napus genome. Each conserved block con-
tained on average 7.8 shared loci and had an average
length of 14.8 cM in B. napus and 4.8 Mb in Arabidopsis.
CMap is one of the more powerful tools for viewing and
comparing genetic maps and has been applied success-
fully for comparison of genetic maps within and between
related grass species [12,13]. We have applied this tool for
the comparison of genetic maps from different Brassica
species. Furthermore, we have identified candidate loci
within the sequenced genome of Arabidopsis correspond-
ing to Brassica genetic markers enabling the linkage
between mapped Brassica traits and candidate genes in
Arabidopsis. The Brassica comparative mapping tool is pub-
licly available and integrated with a custom marker and
trait database as well as an EnsEMBL based Arabidopsis
genome viewer [14].
Construction and content
CMap (version 0.13) was downloaded from Generic Soft-
ware Components for Model Organism Databases
(GMOD) [15] and implemented on an IBM × 335 server
(2 × 2.8 GHz Xeon processors, 2 × 146 GB SCSI RAID5
and 4 GB RAM). Brassica molecular marker data was col-
lated from various public sources. Marker correspondence
was determined through nomenclature and sequence
identity using WU-BLAST [16] with the following param-
eters, hspsepSmax = 1000, topcomboN 8, wordmask seg.
Marker correspondence was also kindly provided by Iso-
bel Parkin, Agriculture Canada. Candidate syntenic blocks
are identified based on the definition of Parkin et al. [11].
A syntenic block requires a minimum correspondence
between 4 mapped loci within 20 cM in Brassica to 4
regions within 4 Mb in Arabidopsis.
Utility and Discussion
Currently the Brassica comparative map database hosts
maps for B. napus (8), B. oleracea (7), B. juncea (5) B. rapa
(3) and Arabidopsis (6). Molecular marker information
was processed within the BASC MarkerQTL database as
described in Erwin et al. [14], and genetic positions inte-
grated within the comparative map database. A total of
834, 3499, 1740 and 860 markers were identified for B.
oleracea, B. napus, B. juncea and B. rapa, respectively. No
genetic map information was available for the species, B.
nigra or B. carinata.
Sequence information was available for 213 mapped SSR
and 230 RFLP markers, enabling the prediction of corre-
sponding loci on the Arabidopsis genome based on
sequence identity. Candidate Arabidopsis positions for an
additional 200 markers were generously provided by Iso-
bel Parkin, Agriculture Canada. Correspondences
between mapped markers and sequenced Arabidopsis
BACs were collated from Lukens et al., [6]; Mayerhofer et
al., [10]; and Suwabe et al., [17]. A total of 1116 markers
correspond with 987 BACs, representing 238 markers in B.
oleracea (28.5%), 777 markers in B. napus (22.2%), 44
markers in B. juncea (2.5%), and 281 markers in B. rapa
(32.7%). In total, correspondence with Arabidopsis was
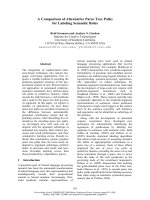
determined for 16.1% of mapped Brassica markers. Corre-
sponding markers between the different Brassica genomes
and with Arabidopsis may be readily identified and viewed
(Figure 1).
BMC Plant Biology 2007, 7:40 />Page 3 of 10
(page number not for citation purposes)
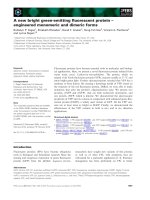
A comparison of B. oleracea Lukens et al. (2003) O5 map with B. napus Parkin et al. (2005) N15 and Arabidopsis Genbank Clones Chromosome 1Figure 1
A comparison of B. oleracea Lukens et al. (2003) O5 map with B. napus Parkin et al. (2005) N15 and Arabidopsis Genbank Clones
Chromosome 1.
BMC Plant Biology 2007, 7:40 />Page 4 of 10
(page number not for citation purposes)
Correspondence between B. oleracea markers and
Arabidopsis BACs
A total of 1596 Arabidopsis BACs, represented Arabidopsis
chromosomes 1–5. Of these BACs, 141 had correspond-
ing B. oleracea markers. For At Ch1, 40 BACs were found
to correspond to 75 mapped B. oleracea markers, of these
40 BACs, 15 (37.5%) of the BACs correspond to a single
Brassica locus. Nineteen (47.5%) of the BACs correspond
to two Brassica markers, while 6 BACs (15%) correspond
to more than two Brassica markers. Of the 27 BACs from
At Ch2 shown to correspond to 55 mapped B. oleracea
markers, 13 (48%) of the BACs correspond to a single B.
oleracea locus, 6 (22%) correspond to 2 B. oleracea mark-
ers, while 8 BACs (30%) correspond to more than 2
Brassica markers. Of the 26 BACs from At Ch3 shown to
correspond to 47 mapped B. oleracea markers, 15 (34.6%)
of the BACs correspond to a single B. oleracea locus, 19
(47.5%) correspond to 2 B. oleracea markers, while 6
BACs (15%) correspond to more than 2 Brassica markers.
Twenty BACs from At Ch4 were found to correspond to 50
mapped B. oleracea markers, of these 7 (35%) correspond
to a single B. oleracea locus, 4 (20%) correspond to 2 B.
oleracea markers, while 9 BACs (45%) correspond to more
than 2 Brassica markers. Of the 28 BACs from At Ch5
shown to correspond to 95 mapped B. oleracea markers,
12 (42.7%) of the BACs correspond to a single B. oleracea
locus, 10 (35.7%) correspond to 2 B. oleracea markers,
while 6 BACs (21.4%) correspond to more than 2 Brassica
markers. The distribution of the BAC corresponding
markers on each linkage group is shown in Table 1.
Comparison of B. oleracea with Arabidopsis
Arabidopsis Chromosome 1
The conservation between the different B. oleracea maps
and At Ch1 was similar in most cases. No conserved
blocks were identified between At Ch1 and linkage groups
O1 and O2 (Figure 2a). A 2 Mb region was predicted to be
syntenic to O3 in the A12XGD-206, BolAG_1999_A and
Lukens et al. [6] maps, only 1 Mb of this region was syn-
tenic with the A12XGD-210 O3, while there was no syn-
teny predicted between At Ch1 and BolAG_1999_A O3. A
4 Mb conserved block, from the lower half of At Ch1, was
predicted to be syntenic to O4 from A12XGD-206,
A12XGD-210 and Lukens et al. [6], only 1 Mb of this
region was syntenic with BolAG_1996_A O4, and the
BolAG_1999_A O4 did not show any synteny. The 6 Mb
conserved block predicted to be syntenic to O5 in all 5
maps was spilt in 2 in. A12XGD-210 and BolAG_1996_A
and only 1.5 Mb was syntenic in BolAG_1999_A. A 5 Mb
region in the lower half of At Ch1 was predicted to be syn-
tenic to O6 of all but the Lukens et al. [6] map. Only a
small conserved region is predicted to be syntenic to
BolAG_1996_A O7. The 5 Mb conserved block predicted
to be syntenic to O8 in all 5 maps, was only 3 Mb in
Lukens et al. [6] map with an additional 0.5 Mb block. The
3 Mb conserved block predicted to be syntenic to
A12XGD-206, A12XGD-210 and BolAG_1996_A O9 con-
tained inversed markers in the middle of the
BolAG_1999_A O9 syntenic block. Only 2 Mb of this
region was syntenic in Lukens et al. [6] and
BolAG_1999_A O9.
Arabidopsis Chromosome 2
No conserved blocks were identified between At Ch2 and
linkage groups O1, O5, O6, O8 and O9 (Figure 2b). Sim-
ilar sized conserved blocks were predicted to be syntenic
to A12XGD-206 and BolAG_1996_A O2, however no syn-
teny was detected in the other maps. The conserved blocks
predicted to be syntenic to the A12XGD-206 map and
BolAG_1999_A O3 were lengthened into 2 blocks in
BolAG_1996_A O3. The syntenic region between At Ch2
and Lukens et al. [6] O3 was a smaller inverted conserved
block in the same area. The 4 Mb block predicted to be
syntenic to A12XGD-206 O4, spanned 10 Mb in
BolAG_1996_A O4 with a further 3 Mb inverted block.
The syntenic region in Lukens et al. [6] O4 was a 1 Mb
inverted block. A 9 Mb conserved block in the middle of
At Ch2 was predicted to be syntenic to BolAG_1996_A
O7, a smaller region of A12XGD-206 O7 was also syn-
tenic with two smaller blocks. No conserved blocks were
identified in O7 from the other maps.
Arabidopsis Chromosome 3
The conservation between the different B. oleracea maps
and At Ch3 was similar in most cases. No conserved
blocks were identified between At Ch3 and linkage groups
O1, O2, O6 and O9 (Figure 2c). The 2 Mb conserved
block at the top of At Ch3, and 3 Mb inverted blocks at
lower half of the chromosome were predicted to be syn-
tenic to A12XGD-206, BolAG_1996_A and Lukens et al.
[6] O3, with no synteny detected in the other maps. The 4
Mb inverted block predicted to be syntenic to O4 was sim-
ilar in all maps, however not present in BolAG_1999_A. A
5 Mb conserved inverted block at the top of At Ch3 was
predicted to be syntenic to O5 in all the maps except
Lukens et al. [6] map, where only two 0.5 Mb blocks were
detected. The 0.5 Mb conserved block predicted to be syn-
tenic to A12XGD-206, BolAG_1996_A and Lukens et al.
[6] O7 was not present in the other maps. Only 1.5 Mb of
the 15 Mb conserved block, predicted to be syntenic to
A12XGD-206, BolAG_1996_A and Lukens et al. [6] O8,
was conserved in A12XGD-210 and BolAG_1999_A O8.
Arabidopsis Chromosome 4
No conserved blocks were identified between At Ch4 and
linkage groups O2, O5 and O6 (Figure 2d). The only pre-
dicted synteny between At Ch4 and BolAG_1999_A was
an inverted conserved block on O1, this was also present
in A12XGD-210 O1. Three conserved blocks were pre-
dicted to be syntenic to A12XGD-206 and Lukens et al. [6]
BMC Plant Biology 2007, 7:40 />Page 5 of 10
(page number not for citation purposes)
O1, with two of these blocks predicted in BolAG_1996_A.
A 16 Mb conserved block at the lower half of At Ch4 was
predicted to be syntenic to BolAG_1996_A O3, no blocks
were detected in the other maps. Only O4 from A12XGD-
206 was predicted to be syntenic with At Ch4. A 6 Mb con-
served block in the middle of At Ch4 was predicted to be
syntenic to A12XGD-206 and BolAG_1999_A O7, with a
0.5 Mb syntenic block detected in Lukens et al. [6] O7. The
6 Mb conserved block in the middle of At Ch4 was pre-
dicted to be syntenic to O8 in all the populations except
BolAG_1999_A. A 2 Mb conserved block in the middle of
At Ch4 was predicted to be syntenic to A12XGD-210 O9.
There was also a small conserved block with between
BolAG_1996_A and Lukens et al. [6] O9.
Arabidopsis Chromosome 5
No conserved blocks were identified between At Ch5 and
linkage groups O4, O5 and O8 (Figure 2e). Only
BolAG_1996_A O1 showed conservation with At Ch5.
Two conserved block at the top and bottom half of
A12XGD-206 map O2 were predicted to be syntenic to At
Ch5. Two syntenic blocks were also found on the lower
half of A12XGD-210 O2. Two blocks 3 Mb and 4 Mb were
found at bottom half of BolAG_1996_A map. Two blocks
were found on Lukens et al. [6] O2, a 2 Mb block was
found in the lower middle of BolAG_1999_A O2 and two
conserved blocks at the top and bottom half of A12XGD-
206 O3 were also predicted to be syntenic to At Ch5. Two
conserved blocks between At Ch5 and A12XGD-206 O3
were identified, a contracted version of one of these
blocks was also syntenic in A12XGD-210 and
BolAG_1999_A O3. One 2 Mb block was found in the
lower top of BolAG_1996_A O3 and two blocks were
found at the lower top of Lukens et al. [6] O3. A 0.5 Mb
conserved block in O6 from all the maps was predicted to
have a syntenic region At Ch5. A small conserved block in
O7 in all the maps was predicted to have a syntenic region
to At Ch5, with an additional 0.5 Mb block found in
BolAG_1996_A and Lukens et al. [6] O5. Four conserved
blocks between At Ch5 and A12XGD-206 O9 were identi-
fied. Three smaller blocks were conserved between At Ch5
and Lukens et al. [6] and BolAG_1996_A O9. Only a small
conserved block in A12XGD-210 and BolAG_1999_A
map O9 was identified.
Comparison of B. napus with Arabidopsis
Arabidopsis Chromosome 1
No conserved blocks were identified between At Ch1 and
linkage groups N1, N4, N11, N14 and N17. Using the
mapping information from Parkin et al. [11], five con-
served blocks were identified between At Ch1 and linkage
groups N18, N13, N19, N15 and N16 (Figure 3a). The
largest of these (N15) spanned nearly the whole of At
Ch1, furthermore, the N18 region is inverted. The map
described by Udall et al. [18] identified syntenic regions
between At Ch1 and most linkage groups, with some
inversions. The largest conserved regions matched N10
N16 and N12 (inverted), spanning ~10 Mb. The Mayer-
hofer et al. [10] map detected a 6 Mb block for N19, two
for N12 and one for N7. Small blocks were found at the
top and the bottom of the chromosome for N19, N12 and
N7.
Arabidopsis Chromosome 2
The map from the Mayerhofer et al. [10] study did not
identify any blocks to At Ch2. Using the mapping infor-
mation from Parkin et al. [11] two inverted blocks for N12
and N14 were identified, along with a 6 Mb block for N13
Table 1: Summary of correspondence between B. oleracea markers and Arabidopsis BACs, and the number and proportion of markers
corresponding to each B. oleracea linkage group (O1–O9).
At Ch1 At Ch1 At Ch3 At Ch4 At Ch5 Total
No. % No. % No. % No. % No. % No.
O134594491877.428
O234712.75424192036
O3 8 10.71221.81210.7 9 18 1616.957
O4 9 12 13 23.6 5 12 7 14 9 9.5 43
O5 16 21.3 2 3.7 8 21.3 3 6 2 2.1 31
O6 8 10.7 4 7.3 2 10.7 2 4 3 3.1 19
O7 7 9.3 7 12.7 4 9.3 8 16 13 13.7 39
O8121623.74164 8 33.125
O991235.53126122324.244
Total
markers
75 100 55 100 47 100 50 100 95 100 322
BMC Plant Biology 2007, 7:40 />Page 6 of 10
(page number not for citation purposes)
A-E. Comparison of the B. oleracea maps GD206 (A12XGD-206), GD210 (A12XGD-210), Bol1996 (BolAG_1996_A), Bol1999 (BolAG_1999_A) to Arabidopsis chromosomes 1–5Figure 2
A-E. Comparison of the B. oleracea maps GD206 (A12XGD-206), GD210 (A12XGD-210), Bol1996 (BolAG_1996_A),
Bol1999 (BolAG_1999_A) to Arabidopsis chromosomes 1–5.
in
in
st ar t0.0
T20M31.8
F10K 1
2.2
F14J 9
3.1
F21M1 2
3.2
F12F1
4.1
F13K 234.4
F7A 194.8
F7H2
5.4
F3O95.6
F6I1
5.7
F17F1 65.8
F18O 14
6.7
F6F 9
6.9
F2J79.0
F28B 23
9.1
F3M1 8
10. 0
T1P 2
10. 5
T19E 23
11. 2
F11M1 519. 0
F12M1 6
19. 9
F14J16
20. 9
T8L23
21. 4
T30E 1621. 9
F2K 11 F24D 723. 6
F1N1 924.0
F1N2 1
25. 2
end30.4
O1
O2
O3
O4
O5
O6
O7
O8
O9
in
in
in
in
in
in
in
GD206
GD210 Bol1996
Bol1999
Lukens
start
0.0
F6N15
0.1
F6N230.3
T20K18
7.5
FCAALL
9.0
F15J5
10. 0
T16H5
10. 7
F18F4
10. 8
T6K2211.4
F10M2313. 5
T10C21
15. 0
F6I115 .1
F11C18
15. 4
F10N715.5
F4D11
15. 8
end
18. 6
O1
O2
O3
O4
O5
O6
O7
O8
O9
GD206 GD210 Bol1996 Bol1999 Lukens
in
in
in
in
in
O1
O2
O3
O4
O5
O6
O7
O8
O9
in
start
0.0
MBL20
1.9
F8L152.7
F2I11
3.6
F15N183.7
MXC9
3.9
T6I144.4
MXE10
4.5
T15N1
4.7
T20K14
5.0
MTG13
5.5
T10B6
5.7
T29J13
6.7
T6G217.3
MRN17
7.7
F2P169.5
F21A20
9.7
T1G169.8
F14I23
9.9
K21B8
13.7
MBD2
17.2
MMG417.3
F6B6
17.7
K17O2218.2
MSD23
19.0
MQD2219.1
MNJ7
19.3
MJE7 K15N18
19.7
K7J8
20.1
K9P8
20.3
MXI22
20.5
MWD22
20.8
MCO1522.4
MWJ3
22.6
MHM1723.1
K21 L19
23.5
MCK723.6
MQJ2
23.7
MUF9
24.4
MXK3
26.0
end
27.0
GD206 GD210 Bol1996
Bol1999
Lukens
in
in
in
O1
O2
O3
O4
O5
O6
O7
O8
O9
start
0.0
F19F24
8.2
F5H14
9.0
T20D1
9.9
F8N16
12. 4
F7F113.2
T32F6
13. 8
F4P914.2
F13P17
14. 5
T1J8
15. 5
T2N18
15. 6
T24P1517 .6
T3F17
19. 0
T30B2219 .5
end
19. 7
GD206
in
GD210 Bo l1996 Bol1999 Lukens
in
in
in
in
in
in
start
0.0
F1C9
0.4
T11I181.0
F7O18
1.3
F17A92.2
F8A24
3.0
MGH64.2
MKP66.0
MRC8
6.2
K24M96.4
MPE11
9.5
MLJ159.8
F12M1217.0
T18N14
A
TEM1
19.2
T25B1519.4
T5N23
20.3
T5P19
21.0
T20N1021.8
F27H5
22.3
end
23.5
O1
O2
O3
O4
O5
O6
O7
O8
O9
GD206 GD210 Bol1996
Bol1999
Lukens
in
in
in
in
in
in
in
in
in
in
A
B
C
D
E
BMC Plant Biology 2007, 7:40 />Page 7 of 10
(page number not for citation purposes)
A-E. Comparison of the B. napus maps from Parkin et al. [11], Udall et al. [18] and Meyerhofer et al. [10] to Arabidopsis chro-mosomes 1–5Figure 3
A-E. Comparison of the B. napus maps from Parkin et al. [11], Udall et al. [18] and Meyerhofer et al. [10] to Arabidopsis chro-
mosomes 1–5.
1
A D
B
E
C
start
0.0
F3L12
1.4
T15J14
6.5
F16F147.1
F5J6
7.6
F19F24
8.2
F5H14
9.0
T16B14
9.4
T20D19.9
F27C12
10.6
T9J2211.3
F8N16
12.4
T27E1312.9
T6B20
13.0
F7F1
13.2
T28P16
13.4
F20M17
13.6
T32F6
13.8
F24L7
13.9
F4P914.2
F13P17
14.5
T4C1514.8
T2N18
15.6
F3G515.7
T19C21
16.1
T28M21
16.7
T7M7
16.8
T3G21
16.9
T7D17
17.0
T24P15
17.6
T3F1719.0
T30B22
19.5
end19.7
in
in
N11
N12
N13
N14
N15
N16
N17
N18
N19
N1
N2
N3
N4
N5
N6
N7
N8
N9
N10
Parkin Udall
start
0.0
T13O15
0.2
F16B30.5
T11I18
1.0
F7O181.3
F22F7
1.6
F3L242.9
F8A24
3.0
F11B9
3.5
F28J15
3.9
K7L4
5.2
MRC8
6.2
K24M9
6.4
F28F48.3
F20C19
9.7
T28A8
15.7
T6H20
17.3
T16K518.5
ATEM119.2
T5N23
20.3
T10K1721.5
F2A19
22.8
end
23.5
in
Parkin Udall
N11
N12
N13
N14
N15
N16
N17
N18
N19
N1
N2
N3
N4
N5
N6
N7
N8
N9
N10
in
in
in
in
in
Ma
y
erhofer
in
N11
N12
N13
N14
N15
N16
N17
N18
N19
N1
N2
N3
N4
N5
N6
N7
N8
N9
N10
start
0.0
F2N1
0.5
T15B160.7
T5J8
1.3
F24G246.4
FCAALL
9.0
T16H5
10.7
F1C12
10.9
T8O5
11.6
F7H19
12.1
F9D16
12.3
F10M2313 .5
F17A13
14.4
T10C2115.0
F6I1
15.1
F11C1815.4
F10N7
15.5
F4I1
16.0
F10M10
16.4
F11I11
16.6
F6G17
17.6
end
18.6
Udall
in
Ma
y
erhofer
in
in
Parkin
in
in
star
t
0.0
T10O8
0.2
K18J171.8
MBL20
1.9
F8L152.7
F17I14
3.0
F2I113.6
F15N18
3.7
MXC9
3.9
T6I14
4.4
MXE10
4.5
T15N1
4.7
T20K14
5.0
MTG135.5
T10B6
5.7
T16G126.4
T1M15
7.0
T6G217.3
F2P16
9.5
F21A20
9.7
F15A18
9.8
F14I23
9.9
F15F15
10.0
T26D3
10.5
T30G614.3
MBD2
17.2
MMG417.3
F6B6
17.7
MSD23
19.0
MQD22
19.1
MNJ7
19.3
MJE7
19.7
MXI22
20.5
MWD2220.8
MCO15
22.4
MWJ 322.6
MHM17
23.1
K21L1923.5
MCK7
23.6
MQJ2
23.7
MUF9
24.4
MXK3
26.0
end27.0
N11
N12
N13
N14
N15
N16
N17
N18
N19
N1
N2
N3
N4
N5
N6
N7
N8
N9
N10
in
in
Parkin Udall
in
Ma
y
erhofer
in
v
in
v
N1
N2
N3
N
4
N
5
N6
N7
N8
N9
N10
start
0.0
F22M8
0.3
F20D221.1
T20M3
1.8
F10K12. 2
F22O13
2.8
F21M123.2
T10O24
3.5
F12F1
4.1
F13K23
4.4
T5E21
5.0
T16N11
5.4
F3O9
5.6
F2H156.2
F6F9
6.9
F9H167.3
F26F24
8.3
F28B239.1
F1K23
10.1
T2H7
10.6
T19E23
11.2
T16O9
12.1
F14D7
13.3
F15C21
13.6
T10P12
16.4
T2P3
17.1
F13F21
18.3
F14I3
18.6
F5D2119.1
T18A20
20.1
F14C2120.5
F20N2
20.8
T8L2321.4
T30E16
21.9
T1F9
22.7
F2K11
23.6
F1N19
24.0
F5A8
25.1
F1N21
25.2
F10D1326.1
T10D10
27.3
F25A428.1
T14N529. 0
end30.4
N11
N12
N13
N14
N15
N16
N17
N18
N19
Parkin
in
v
in
v
Udall
in
v
in
v
in
v
in
v
in
v
Mayerhofe
r
BMC Plant Biology 2007, 7:40 />Page 8 of 10
(page number not for citation purposes)
(Figure 3b). The Udall et al. [18] genetic map had con-
served blocks for N3, N5, N13, N14, and N18 with blocks
larger than 3 Mb detected in N19, N4 and N12.
Arabidopsis Chromosome 3
No conserved blocks were identified between At Ch3 and
linkage groups N1, N6, N8, N9, N11, N16 and N17. Using
the mapping information from Parkin et al. [11] one 4 Mb
inverted block from N14 at the top of At Ch3 and a 1 Mb
block from N18 were identified (Figure 3c). Utilizing the
information from the Udall et al. [18] map, conserved
blocks in N2, N4, N5, N10, N12, N13, N14, N15, N18,
and N19 were detected, with blocks larger than 4 Mb were
found in N2, N3, N12 and N14. Inverted blocks were
found in N4, N5, N7, N12, and N18. From the Mayer-
hofer et al. [10] map, three 0.5 Mb conserved blocks were
found for N12 and 2–3 Mb blocks were found for N2 and
N7 at the top of the chromosome.
Arabidopsis Chromosome 4
No conserved blocks were identified between At Ch4 and
linkage groups N2, N4, N5, N8, N9, N10, N14, N16 and
N18 (Figure 3d). Only two small conserved blocks were
identified from the Mayerhofer et al. [10] map, on N7 and
N12. Using information from the Parkin et al. [11] map,
inverted blocks in N11 and N15 were identified. Further
conserved blocks for N11, N17 and N19 were found in
the middle of At Ch5. Utilising information from the
Udall et al. [18] map showed inverted blocks for N11 and
N13, spanning 3 Mb and 1 Mb respectively. Large blocks
were found for N1, N3 and N7 in the lower half of the
chromosome. Smaller blocks were also found for N11,
N13, N3 and N6
Arabidopsis Chromosome 5
No conserved blocks were identified between At Ch5 and
linkage groups N1, N3, N4, N5, N8, N9, N11, N14 and
N18 (Figure 3e). Using the mapping information from
Parkin et al. [11] inverted blocks were found for N10 and
N17, spanning 6 Mb and 3 Mb at the top of At Ch5. Three
conserved blocks larger than 3 Mb were found for N12,
N13 and N19. A further 2 small segments for N17 were
found in middle of the chromosome. Using the mapping
information from Udall et al. [18] inverted blocks were
found for N12 and N19, spanning 6 Mb and 3 Mb respec-
tively, at the end of the chromosome. A 6 Mb inverted
block was found for N6 in the middle of At Ch5 and.
blocks larger than 4 Mb were found for N12, N13, N15,
with a smaller block for N19 also at the top of the chro-
mosome. Using the mapping information from Mayer-
hofer et al. [10] small blocks were found for B N2, N6,
N12, and N16 at the top of At Ch5. A further large block
was found for N7 at the top of the chromosome.
Conclusion
We have collated available public Brassica genetic maps
within a comparative mapping database and integrated
this genetic and genomic information with the Brassica
BASC MarkerQTL database and Arabidopsis EnsEMBL
genome browser [14]. Known correspondences between
Brassica markers and the genome of Arabidopsis were
included to assist in comparative analysis between these
species. Where possible, additional correspondences
between Brassica loci and the Arabidopsis genome were
identified using sequence identity. Due to genome dupli-
cation within Arabidopsis, Brassica markers frequently
identified multiple candidate corresponding genome
locations. To avoid losing potentially valuable corre-
spondence data, up to the top three best matches (E <
0.00001) were included.
Blocks of genome conservation have previously been
identified between the genomes of Brassica and Arabidopsis
[6,11]. In this study we have compiled correspondences
between Brassica and Arabidopsis from several different
studies [10,11,15] and can thus compare how each of
these maps correspond to the sequenced Arabidopsis
genome.
Lukens et al. [6] identified 34 blocks of conservation
between Brassica an Arabidopsis. The collinear regions
identified in our study generally support this result. All 34
collinear regions were identified between the
BolAG_1996_A map and the Arabidopsis genome, while
the A12XGD-206, A12XGD-210 and BolAG_1999_A
maps identified 28, 25 and 24 of the 34 regions respec-
tively. None of these conserved collinear regions were
identified between the NxG-97 map and Arabidopsis due
to a lack of corresponding marker information. The differ-
ence between our results and the study of Lukens et al. [6]
may be attributed to the method for conserved block iden-
tification. Lukens et al. [6] applied a statistical collinearity
method and identified some small candidate conserved
blocks (<1 Mb and 2.6 Mb). The method of Parkin et al.
[11] applied in this study.
Parkin et al. [11] identified 21 conserved segments within
the Arabidopsis genome which have been duplicated and
rearranged to form the skeleton of the B. napus genome.
However, not all of the marker BAC correspondences
described by Parkin et al. [11] are publicly available, so we
were unable to reproduce these results. In particular,
many of the correspondences described between N1–N10
and Arabidopsis were not identified in our study. In addi-
tion, a lack of correspondence between Arabidopsis and the
ends of Brassica linkage groups may be attributed to a low
marker density in these areas.
BMC Plant Biology 2007, 7:40 />Page 9 of 10
(page number not for citation purposes)
Parkin et al. [11] suggests that the number of Brassica loci
corresponding to each Arabidopsis chromosome was not
evenly distributed. Fewer Brassica correspondences were
identified to Arabidopsis chromosomes 2 and 3, with a
greater number of correspondences identified to Arabidop-
sis chromosome 5 than expected. Our results from the
analysis of collated Brassica data are in agreement with
this finding. The results from our study of collated mark-
ers support this result. Previous studies have demon-
strated that the Brassica genome is highly duplicated with
suggestions of triplication compared to the genome of
Arabidopsis [19]. Our analysis indicates abundant chromo-
some inversions, deletions and duplications resulted in a
mosaic Brassica genome and supports the proposed hexa-
ploid ancestor for the diploid Brassica progenitor [20]. A
recent model for comparative analysis between the Brassi-
caceae suggest an ancient 8 chromosome karyotype [21].
As additional comparative Brassicaceae data becomes
available, this model may be tested using these compara-
tive genetic mapping tools.
This study has applied published and publicly available
Brassica molecular marker and mapping information and
collated this within a public Brassica comparative map
database system, enabling the rapid retrieval, comparison
and analysis of this information. There remain a signifi-
cant number of studies for which sufficient data is not
publicly available for inclusion in this system. The future
inclusion of this data would further assist in the public
understanding of Brassica genomes.
The linkage of Brassica genetic maps to the physical map
of Arabidopsis, provides a resource where users may
browse and search between the genome of Brassica or Ara-
bidopsis and apply the knowledge gained from the study of
this model plant for improvement in Brassica crop species.
The genetic locations of traits identified within different
maps and even different species may be compared. Candi-
date genes underlying traits may be identified through the
linkage between genetic maps and the Arabidopsis
EnsEMBL viewer. The completion of the genome
sequence for B. rapa produced by the Multinational
Brassica Genome Sequencing Project, along with the
genome sequences for other related Brassicaceae will
greatly assist in the characterisation of genome evolution
in these species. The integration of this genome sequence
information within the BASC Brassica database system
[14] will provide the ability to link directly from Brassica
genetic maps to the underlying candidate Brassica genes.
Authors' contributions
GL collated the map data, performed the analysis of the
data, created the figures and helped to draft the manu-
script. EJ contributed to the collation of the map data and
installation of the software. XL, TE and CL contributed to
the installation of the software and critically reviewed the
manuscript. JB contributed to the collation of the map
data and critically reviewed the manuscript. GS critically
reviewed the manuscript. DE conceived of the study and
drafted the manuscript. All authors read and approved the
final manuscript.
Availability and Requirements
This tool is freely available over the internet on http://bio
informatics.pbcbasc.latrobe.edu.au/cmap. CMap is free
software from the GMOD project
.
Acknowledgements
Funding for research and publication was received from Primary Industries
Research Victoria, the Australian Centre for Plant Functional Genomics
and the University of Queensland.
References
1. Bohuon EJ, Ramsay LD, Craft JA, Arthur AE, Marshall DF, Lydiate DJ,
Kearsey MJ: The association of flowering time quantitative
trait loci with duplicated regions and candidate loci in
Brassica oleracea. Genetics 1998, 150(1):393-401.
2. Lan TH, DelMonte TA, Reischmann KP, Hyman J, Kowalski SP,
McFerson J, Kresovich S, Paterson AH: An EST-enriched compar-
ativemap of Brassica oleracea and Arabidopsis thaliana.
Genome Res 2000, 10(6):776-88.
3. U N: Genome analysis in Brassica with special reference to
the experimental formation of B. napus and peculiar mode of
fertilisation. Jpn J Bot 1935, 7:389-452.
4. Prakash S, Hinata K: Taxonomy, cytogenetics and origin of crop
Brassicas, a review. Opera Bot 1980, 55:3-57.
5. The Arabidopsis Genome Initiative: Analysis of the genome
sequence of the flowering plant Arabidopsis thaliana. Nature
2000, 408:796-815.
6. Lukens L, Zou F, Lydiate D, Parkin I, Osborn T: Comparison of a
Brassica oleracea genetic map with the genome of Arabidopsis
thaliana. Genetics 2003, 164(1):359-72.
7. Parkin IA, Sharpe AG, Lydiate DJ: Patterns of genome duplica-
tion within the Brassica napus genome. Genome 2003,
46(2):291-303.
8. Piquemal J, Cinquin E, Couton F, Rondeau C, Seignoret E, Doucet I,
Perret D, Villeger MJ, Vincourt P, Blanchard P: Construction of an
oilseed rape (Brassica napus L) genetic map with SSR mark-
ers. Theor Appl Genet 2005, 111(8):1514-23.
9. Bevan M, Murphy G: The small, the large and the wild: the value
of comparison in plant genomics. Trends Genet 1999,
15(6):
211-4.
10. Mayerhofer R, Wilde K, Mayerhofer M, Lydiate D, Bansal VK, Good
AG, Parkin IA: Complexities of chromosome landing in a
highly duplicated genome: toward map-based cloning of a
gene controlling blackleg resistance in Brassica napus. Genet-
ics 2005, 171(4):1977-88.
11. Parkin IA, Gulden SM, Sharpe AG, Lukens L, Trick M, Osborn TC,
Lydiate DJ: Segmental structure of the Brassica napus genome
based on comparative analysis with Arabidopsis thaliana.
Genetics 2005, 171(2):765-81.
12. Gonzales MD, Archuleta E, Farmer A, Gajendran K, Grant D, Shoe-
maker R, Beavis WD, Waugh ME: The Legume Information Sys-
tem (LIS): an integrated information resource for
comparative legume biology. Nucleic Acids Res 2005, 33:D660-5.
13. Jaiswal P, Ni J, Yap I, Ware D, Spooner W, Youens-Clark K, Ren L,
Liang C, Zhao W, Ratnapu K, Faga B, Canaran P, Fogleman M, Heb-
bard C, Avraham S, Schmidt S, Casstevens TM, Buckler ES, Stein L,
McCouch S: Gramene: a bird's eye view of cereal genomes.
Nucleic Acids Res 2006, 34:D717-23.
14. Erwin TA, Jewell EG, Love CG, Lim GAC, Li X, Chapman R, Batley J,
Stajich J, Mongin E, Stupka E, Ross B, Spangenberg G, Edwards D:
BASC: an integrated bioinformatics system for Brassica
research. Nucleic Acids Res 2007, 35:D870-D873.
15. Cmap [ />]
Publish with BioMed Central and every
scientist can read your work free of charge
"BioMed Central will be the most significant development for
disseminating the results of biomedical research in our lifetime."
Sir Paul Nurse, Cancer Research UK
Your research papers will be:
available free of charge to the entire biomedical community
peer reviewed and published immediately upon acceptance
cited in PubMed and archived on PubMed Central
yours — you keep the copyright
Submit your manuscript here:
/>BioMedcentral
BMC Plant Biology 2007, 7:40 />Page 10 of 10
(page number not for citation purposes)
16. WU-BLAST [ />17. Suwabe K, Tsukazaki H, Iketani H, Hatakeyama K, Kondo M, Fujimura
M, Nunome T, Fukuoka H, Hirai M, Matsumoto S: Simple sequence
repeat-based comparative genomics between Brassica rapa
and Arabidopsis thaliana: the genetic origin of clubroot resist-
ance. Genetics 2006, 173(1):309-19.
18. Udall JA, Quijada PA, Osborn TC: Detection of chromosomal
rearrangements derived from homologous recombination in
four maps of Brassica napus L. Genetics 2005, 169(2):967-79.
19. Lysak MA, Koch MA, Pecinka A, Schubert I: Chromosome triplica-
tion found across the tribe Brassiceae. Genome Res 2005,
15(4):516-25.
20. Lagercrantz U, Lydiate DJ: Comparative genome mapping in
Brassica. Genetics 1996, 144(4):1903-10.
21. Schranz ME, Lysak MA, Mitchell-Olds T: The ABC's of compara-
tive genomics in the Brassicaceae: building blocks of crucifer
genomes. Trends Plant Sci 2006, 11(11):535-42.