báo cáo khoa học: " Systematic analysis of alternative first exons in plant genomes" doc
Bạn đang xem bản rút gọn của tài liệu. Xem và tải ngay bản đầy đủ của tài liệu tại đây (686.55 KB, 13 trang )
BMC Plant Biology
BioMed Central
Open Access
Research article
Systematic analysis of alternative first exons in plant genomes
Wei-Hua Chen†1,4, Guanting Lv†1,2, Congying Lv3, Changqing Zeng1 and
Songnian Hu*1
Address: 1Key Laboratory of Genome Science and Information, Beijing Institute of Genomics, Chinese Academy of Sciences, Beijing, China,
2Graduate School of Chinese Academy of Sciences, Beijing, China, 3Nanyang Institute of Technology, Henan, China and 4Bioinformatics,
Heinrich-Heine-University, Duesseldorf, Germany
Email: Wei-Hua Chen - ; Guanting Lv - ; Congying Lv - ;
Changqing Zeng - ; Songnian Hu* -
* Corresponding author †Equal contributors
Published: 17 October 2007
BMC Plant Biology 2007, 7:55
doi:10.1186/1471-2229-7-55
Received: 17 February 2007
Accepted: 17 October 2007
This article is available from: />© 2007 Chen et al; licensee BioMed Central Ltd.
This is an Open Access article distributed under the terms of the Creative Commons Attribution License ( />which permits unrestricted use, distribution, and reproduction in any medium, provided the original work is properly cited.
Abstract
Background: Alternative splicing (AS) contributes significantly to protein diversity, by selectively using
different combinations of exons of the same gene under certain circumstances. One particular type of AS
is the use of alternative first exons (AFEs), which can have consequences far beyond the fine-tuning of
protein functions. For example, AFEs may change the N-termini of proteins and thereby direct them to
different cellular compartments. When alternative first exons are distant, they are usually associated with
alternative promoters, thereby conferring an extra level of gene expression regulation. However, only few
studies have examined the patterns of AFEs, and these analyses were mainly focused on mammalian
genomes. Recent studies have shown that AFEs exist in the rice genome, and are regulated in a tissuespecific manner. Our current understanding of AFEs in plants is still limited, including important issues such
as their regulation, contribution to protein diversity, and evolutionary conservation.
Results: We systematically identified 1,378 and 645 AFE-containing clusters in rice and Arabidopsis,
respectively. From our data sets, we identified two types of AFEs according to their genomic organisation.
In genes with type I AFEs, the first exons are mutually exclusive, while most of the downstream exons are
shared among alternative transcripts. Conversely, in genes with type II AFEs, the first exon of one gene
structure is an internal exon of an alternative gene structure. The functionality analysis indicated about half
and ~19% of the AFEs in Arabidopsis and rice could alter N-terminal protein sequences, and ~5% of the
functional alteration in type II AFEs involved protein domain addition/deletion in both genomes. Expression
analysis indicated that 20~66% of rice AFE clusters were tissue- and/or development- specifically
transcribed, which is consistent with previous observations; however, a much smaller percentage of
Arabidopsis AFEs was regulated in this manner, which suggests different regulation mechanisms of AFEs
between rice and Arabidopsis. Statistical analysis of some features of AFE clusters, such as splice-site
strength and secondary structure formation further revealed differences between these two species.
Orthologous search of AFE-containing gene pairs detected only 19 gene pairs conserved between rice and
Arabidopsis, accounting only for a few percent of AFE-containing clusters.
Conclusion: Our analysis of AFE-containing genes in rice and Arabidopsis indicates that AFEs have multiple
functions, from regulating gene expression to generating protein diversity. Comparisons of AFE clusters
revealed different features in the two plant species, which indicates that AFEs may have evolved
independently after the separation of rice (a model monocot) and Arabidopsis (a model dicot).
Page 1 of 13
(page number not for citation purposes)
BMC Plant Biology 2007, 7:55
/>
Background
Alternative splicing (AS) is an important mechanism,
which contributes greatly to protein diversity by selectively using different sets of exons of one gene in different
tissues or cells under certain circumstances [1-3]. It has
been shown to exist in nearly all metazoan organisms,
and was estimated to involve 30–70% of human genes
[4,5]. However, AS variants identified so far are biased
towards alternative exons that include coding sequences
(CDSs) [6]. Actually, many AS isoforms use alternative
first exons (AFEs) to regulate their expression and generate
protein diversity. An AFE is the first exon of one splice isoform of a gene, but either located downstream of a corresponding AFE of other isoforms generated by the same
gene, or absent from other isoforms altogether. It has been
reported that this phenomenon also contributes to the
complexity of gene expression [6,7].
To date, studies of AFEs have been focused mainly on
mammalian genomes, especially mouse and human. It
has been reported that of the full-length genes in the
RIKEN databases, about 9% contained AFEs in mouse [8]
and more than 18% contained AFEs in human [9]. AFEs
could be produced by alternative promoter usage. Some
AFEs merely change the 5'-untranslated region (5'-UTR)
to exert regulation on translational efficiency or the efficiency or destination of the transcripts' transportation out
of the nucleus. In this case, the shared downstream exons
contain the translation start codons (ATGs), and thus
have the same open reading frames (ORFs) and produce
identical proteins [6,10-12]. In other cases, AFEs contain
alternative transcription start sites (ATGs), which could
result in protein variants that differ in the N-termini
[2,13,14] or in novel proteins [15,16].
Up until now, only few studies have analyzed AFEs in
plants. For example, SYN1 in Arabidopsis was shown to
produce two isoforms with distinct alternative first exons
[17]. Recently, a large-scale study of AFEs in rice has discovered 46 potential AFE-containing clusters, and has
shown their involvement in tissue-specific transcription
[14]. But our knowledge about AFEs in plants is still limited. Here, we used a systematic approach to analyze their
contribution to protein diversity and their evolutionary
conservation between rice (a model monocot) and Arabidopsis thaliana (a model dicot).
Methods
Systematic detection of AFEs in plant genomes
To compile our AFE data sets, we downloaded the following data sets of rice (Oryza sativa L. ssp. Japonica) and Arabidopsis from public databases: full-length cDNAs,
expressed sequence tags (ESTs), reference sequences
(NCBI refseq) and mRNAs (Table 1). Genome location
and exact gene structure were determined for each of the
cDNA sequences using the GMAP program [18]. We
excluded sequences that showed low similarities with the
genome sequence (<95% identities and <90% coverage
for reference genes and full-length cDNAs; <90% identities and <90% coverage for ESTs), did not map onto a
unique genomic region, or were derived from organelles
(mitochondrion and chloroplast). All information was
loaded into MySQL databases for further analysis.
We first grouped full-length cDNAs and reference genes
into clusters on the genome if they mapped onto the same
genomic region, were orientated on the same strand, and
had overlapping sequences. Within each cluster, members
were further grouped according to their gene structures.
ESTs were then added into the existing clusters. An EST
was either added as a member of an existing gene structure, or as a new gene structure in a cluster according to
the location of the first exon on the genome. ESTs that
could not be grouped into a unique gene structure in one
cluster were discarded. After adding ESTs, we counted the
number of ESTs for each gene structure in each cluster. To
produce reliable results, we discarded gene structures that
consisted of only one EST.
Table 1: Acquired data
Species
Sequence
Datasets
Database
Oryza sativa L. ssp. Japonica
General EST
mRNA
Full-length cDNA
Genome
General EST
mRNA
Full-length cDNA
Genome
1,211,078
23,309
32,127
NCBI dbEST
NCBI CoreNucleotide
KOME**
IRGSP* Release 4.0
NCBI dbEST
NCBI CoreNucleotide
RIKEN RAFL***
NCBI Genomes
Arabidopsis thaliana
734,275
30,476
15,294
*IRGSP stands for International Rice Genome Sequencing Project
**KOME stands for Knowledge-based Oryza Molecular biological Encyclopedia
*** RAFL stands for RIKEN Arabidopsis Full-length cDNA clones
Page 2 of 13
(page number not for citation purposes)
BMC Plant Biology 2007, 7:55
/>
Since only full-length cDNAs in our data sets could guarantee the reliability of transcription start sites (TSSs) and
the first exons, we searched for AFEs in clusters that contained full-length cDNAs and had at least two distinct
gene structures. We defined the first exon of a cluster as
the 5'-most of all first exons among gene structures that
contained full-length cDNAs. Then other gene structures
in the same cluster were compared with this first exon to
identify possible AFEs.
with protein sequences in the Uniprot database [18] using
BLAST-based tools. GO (Gene Ontology) terms were
assigned according to Uniprot2GO associations downloaded from the website of the GeneOntology Consortium [22]. GO annotations were plotted using a webbased tool, WEGO [23]. Statistical significance of each GO
category that was enriched or depleted among AFE-containing clusters was evaluated by calculating the hypergeometric distribution using the following equation:
Within each AFE-containing gene cluster, we determined
major and minor types of alternative first exons by calculating numbers of their supporting ESTs. A first exon type
was marked as 'major' type if it had more supporting ESTs
than any other first exon in the cluster; else it was marked
as 'minor'.
K M − K
x
n−x
p = f ( x | M, K , n) =
M
n
Statistical analysis of AFEs
Based on the alignment positions of AFEs, we determined
the chromosomal distribution of AFE clusters in rice and
Arabidopsis.
Where M = total genes classified by GO in an organism, K
= number of genes classified by a specific GO category, n
= total number of AFE-containing clusters classified by
GO, x = number of AFE-containing clusters classified by a
specific GO category, and p = probability that a GO category is significantly enriched or depleted.
To identify possible factors that govern splicing sites selection in AFEs, such as splicing site strength, common
motifs around splicing junctions, and secondary RNA
structure formation around the splicing site, we performed the following statistical analyses of AFEs in rice
and Arabidopsis. First, we examined splicing site quality of
alternatively spliced first exons. By using exon annotations from GMAP, we extracted a 500-basepair window
centered on each donor (5') splice site with sufficient
flanking sequence, and used these data as input sequences
to GeneSplicer [19] for splice site prediction.
Tissue-specific expression of AFEs in rice and Arabidopsis
For the reliable detection of the tissue specificity of certain
AFE isoforms, we adopted a strategy proposed by Qiang
Xu et al. [5], namely 'tissue specificity scoring'. To this end,
tissue specificity was measured by a tissue specificity score
TS and two robustness values rTS and rTS~ (for details see
Ref. [5]). High confidence (HC) tissue specificity was
defined as TS>50, rTS>0.9 and rTS~>0.9, and low confidence (LC) was defined as TS>0, rTS>0.5 and rTS~>0.5.
Second, we analyzed whether AFEs tend to form secondary structures around splicing sites, which might potentially block the proper recognition of splice site signals
and might thereby result in the skipping of the corresponding exon/intron. We used the program RNAfold of
the Vienna RNA package [20] to predict folding for a 100basepair window centered on each splicing site. The minimal folding energy (MFE, also known as optimal folding
energy, OFE) was calculated for each input sequence. A
lower MFE score indicates that the input sequence is more
likely to form secondary structures.
Third, we used MEME [21] to search for possible common
motifs shared by all or a subset of alternatively spliced
exons and neighboring intron sequences.
Annotation and functional classification of AFE-containing
clusters
To annotate AFE-containing clusters, we compared either
the reference gene or the longest full-length cDNA (if
there was no reference sequence available) in each cluster
Cross-genome comparison of AFEs-containing orthologous
genes
Orthologous relationship between rice and Arabidopsis
were identified by using Inparanoid [24] with default
parameter settings and with the Bootstrap option enabled.
The output was parsed using a PERL script. Only genes
that produced Bootstrap score = 100% were considered as
orthologous.
Functionality of AFE-containing clusters
We used the tool GetORF in the EMBOSS software package [25] to find putative open reading frames for every
AFE-containing cluster. To assess the potential of AFEs to
produce protein diversity, we divided the AFE-containing
structures into three groups: i) AFEs in a certain cluster
were not involved in the ORF and the downstream exons
resulted in the same ORF for all AFEs; ii) AFEs contained
alternative transcription start sites (ATG), but the downstream exons were identical; iii) AFEs contained alternative transcription start sites and the downstream exons
were not identical.
Page 3 of 13
(page number not for citation purposes)
BMC Plant Biology 2007, 7:55
/>
In order to check if an AFE-containing structure generated
transcripts containing premature stop codons (PTC) and
could thus be degraded by nonsense-mediated decay
mechanisms (NMD), the distance between the stop
codon and the last 3' exon-exon junction was calculated.
The NMD candidate was defined according to the 50 nt
rule, as previously suggested [26]: If the measured distance was >50 nt, the AFE-containing structure was
regarded as an NMD candidate.
Results and discussion
Systematic identification of AFEs in plant genomes
Based on comparisons of sequences from a large set of
public databases, we identified 23,500 and 12,964 fulllength-cDNA containing gene clusters in rice and Arabidopsis, respectively. These gene clusters represented about
42% (out of 55,890 gene loci from the TIGR Rice Genome
Annotation Release 4) and 48.5% (out of 26,751 protein
coding genes from the TAIR Arabidopsis Genome Annotation Release 6) of the total expressed genes in rice and Arabidopsis, respectively. From this data, we identified 1,378
and 645 AFE-containing clusters in rice and Arabidopsis
clusters, respectively. In rice, ~5.9% of the expressed genes
displayed AFE events. Compared with a recent estimate of
~4% based on 5'-end ESTs [14], which were obtained
from CAP-technology-based cDNA libraries, our AFE ratio
is slightly higher. This increase may result from i) our
much larger collection of full-length cDNAs and general
5'-end ESTs, and/or ii) our potentially more sensitive
detection method. In Arabidopsis, we observed a similar
ratio (~5%) of expressed genes that contained AFE events.
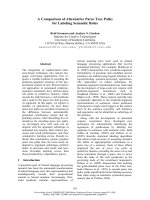
Based on the genomic positions of the first exons in a cluster, two patterns of AFEs were observed. Type I AFEs
included those where the first exons were mutually exclusive and where most of the downstream exons were identical between gene structures within the same cluster
(Figure 1A); Type II AFEs included those where the first
exon of gene structure A existed as an internal exon of
gene structure B (Figure 1B). It should be noted that sometimes a cluster could contain more than one type of AFEs.
From our data sets, Type II was the most abundant type of
AFEs. Type II accounted for 90% (1,241 out of 1,378) of
all the AFE events in rice, and 83% (546 out of 645) in
Arabidopsis (Table 2). The average distance between the
start sites of alternative first exons was 1,644 bp in Arabidopsis, and 1,141 bp in rice. Using the >500 bp interval
proposed by Kouichi Kimura et al. [6] as a criterion, we
estimated that at least 257 and 352 of the Type II AFE
evens in rice and Arabidopsis, respectively, resulted from
alternative use of different core promoters. By applying
the same criterion to type I AFE events, we identified an
additional 62 and 22 putative alternative promoter (PAP)derived gene structures in rice and Arabidopsis, respec-
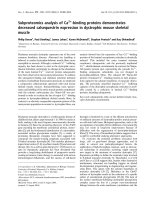
Figure 1
Diagrammatic view of different types of AFE events
Diagrammatic view of different types of AFE events.
Alternative first exons are highlighted in orange and green.
Constitutive exons are drawn in dark blue. Other alternatively spliced exons are drawn in brown. (A). Type I AFE
clusters. Alternative first exons are mutually exclusive in different gene structures. (B). Type II AFE clusters. The first
exon of one transcript is (part of) a downstream exon of
other transcripts. (C). Some AFEs are coupled with downstream alternative splicing events.
tively. Although we could not determine the exact transcription start sites (TSSs) for non-full-length cDNA
containing gene structures, our data suggested that the
derived putative TSSs probably reflected true TSSs in vivo,
as gene structures in each AFE cluster were supported by
multiple general 5'-end ESTs from multiple cDNA libraries. Thus, we estimate that about ~23% and ~58% of AFEcontaining gene structures were derived from alternative
promoters in rice and Arabidopsis, respectively.
Statistical characterization of AFEs in plant genomes
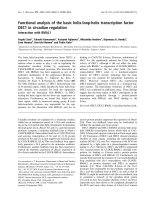
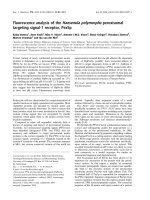
As shown in Figure 2, we detected no significant bias in
the chromosomal distribution of AFEs in Arabidopsis. We
also compared the distribution with relative gene density
from the TAIR genome annotation, and did not detect any
significant regional enrichment or depletion within chromosomes. A similar trend was also observed in the rice
genome (see Additional File 1).
It is well documented that splice site strength plays important roles in splice-site selection and alternative splicing in
mammalian genomes. Sequence composition around
splice sites and its base pairing with the small nuclear RNA
U1 regulate the inclusion rate of corresponding exons. To
study whether similar mechanisms apply to plant
genomes, we analyzed the 5' splice site (5'ss) strength of
AFEs and compared it with that of constitutively spliced
exons. As shown in Table 3, the results indicate that the
5'ss of type I AFEs is relatively weak compared to constitutive exons, in both rice and Arabidopsis. However, when
taking the exon inclusion rate into account, we found sig-
Page 4 of 13
(page number not for citation purposes)
BMC Plant Biology 2007, 7:55
/>
Table 2: Results of AFE analysis in rice and Arabidopsis
Rice
Arabidopsis
N-terminal diversification
Overlapping with functional domain
Putative alternative promoter
Both N-terminal and PAP
NMD
137
53
5
62
3
47
99
20
1
22
7
10
N-terminal diversification
Overlapping with functional domain
Putative alternative promoter
Both N-terminal and PAP
NMD
1,241
213
56
257
189
237
546
298
71
352
244
42
1,378
645
Type I AFE
Type II AFE
Total
nificant differences between the two genomes. In Arabidopsis, the 5'ss strength of the major expressed AFE
isoforms showed no statistical difference compared with
that of constitutive exons (T-Test with p < 0.01), while the
minor AFE isoform differed significantly from the constitutive exon in splice site strength (p = 3.2361e-012, Table
3). Conversely, in rice we observed similar 5'ss strengths
between major and minor AFE isoforms. The analysis of
type II AFEs revealed similar differences between rice and
Arabidopsis: the 5'ss strength in both major and minor type
II AFE isoforms of Arabidopsis was similar to that of constitutive exons, while the 5'ss strength of major AFE isoforms
of rice was much lower compared to minor isoforms.
These results suggest that different mechanisms are likely
involved in the regulation of splicing-site selection or recognition in rice and Arabidopsis.
We further investigated the tendency to form secondary
structures of sequences surrounding the 5'ss of AFEs, as
such structures were previously suggested to be able to regulate splice site recognition and splicing. We measured
minimal folding energy (MFE) for a 100-base window
centred on each 5'ss for AFEs as well as constitutive exons.
As shown in table 4, the results indicated that AFEs of Arabidopsis were less likely to form secondary structures at the
5'ss compared to constitutive first exons, while AFEs in
rice were significantly more likely to form secondary structures.
To investigate possible sequence motifs that might regulate the alternative use of first exons, we searched the
sequences of AFEs and surrounding introns using the
MEME program. Using a cutoff of 1E-5 for sequence alignments, we did not detect significantly enriched motifs in
all or subsets of AFEs and surrounding sequences. This
result indicates that either some regulatory sequences
were too degenerative to be detected using MEME, or AFEs
are regulated by other mechanisms than specific sequence
motifs.
Effects of AFEs on protein diversity and functional
modulation
To study the biological implications of the alternative use
of first exons, we examined whether the N-terminal coding regions were altered in AFEs. The N-terminals were
considered to be altered when the putative Methionine
start codon was located on the alternative first exons of
both AFE types.
In type I AFE clusters (mutually exclusive first exons), the
most common scenario involved AFE events that produced transcripts with identical ORFs. In these cases, a
common downstream exon which contained the translation start site was shared by all gene structures in the cluster. From our data sets, 84 and 79 of AFE clusters in rice
and Arabidopsis, respectively, were of this type. Because the
protein structure remained unchanged, alterations
between tissue or stage specificity were likely to be the
main consequences in these cases.
In type II AFE-containing gene clusters, EST-only gene
structures and full-length-containing ones often differed
from each other by not only the alternative first exons, but
also some downstream exons. Therefore, it was possible
that the extra sequences in EST-only structures contained
putative translational start codons, and consequently produced multiple protein variants. In our data, 213 and 298
type II AFE clusters in rice and Arabidopsis were of such
cases, respectively. Most of these alternative start codons
led to additional fragments at the N-termini of proteins.
However, we identified some rare cases (five in rice and
three in Arabidopsis, respectively) where AFEs resulted in
Page 5 of 13
(page number not for citation purposes)
BMC Plant Biology 2007, 7:55
/>
Figure 2
Chromosomal distribution of AFE-containing clusters
Chromosomal distribution of AFE-containing clusters. The distribution of AFEs on Arabidopsis chromosomes was
determined using the alignment positions of AFE-clusters.
multiple reading frames and thereby produced novel proteins.
In total, we identified 266 possible N-terminal changes in
rice and 318 in Arabidopsis AFE-containing gene clusters.
As shown in Table 2, a strong correlation existed between
N-terminal protein changes and the use of putative alternative promoters in type II AFE clusters (as tested using
Fisher's Exact Test, p < 0.01). It seemed that the distance
between gene structures in a cluster contributed significantly to the N-terminal protein changes. Only a small
proportion of type I AFE clusters generated protein diversity. The major contributor was the start codon location.
We observed no connection between the 5'-end distance
of the gene structures and alternative start codons.
We also investigated the effects of protein N-terminal
changes on known functional protein motifs by compar-
Page 6 of 13
(page number not for citation purposes)
BMC Plant Biology 2007, 7:55
/>
Table 3: 5' splice site analysis of AFEs
Constitutive
(± SD) *
AFE Type I
AFE Type II
Total
Rice
Comparison with constitutive sites ***
Arabidopsis
Comparison with constitutive sites ***
9.310 ± 3.72
8.00 ± 2.89
Major**
Minor**
Total
Major**
Minor**
7.87 ± 4.11
1.3063e-011
7.39 ± 3.23
0.0013
7.75 ± 4.23
5.7841e-007
8.20 ± 3.03
0.4077
7.75 ± 3.91
1.3907e-006
5.89 ± 3.07
3.2361e-012
8.61 ± 4.01
3.1057e-010
8.44 ± 2.93
9.4224e-005
7.75 ± 4.03
1.0233e-029
8.42 ± 2.84
0.0062
8.98 ± 3.20
0.9846
8.40 ± 3.02
0.0151
* The 5' splice site scores were predicted by GeneSplicer. Higher score indicates stronger splicing signal.
** Major and minor types of alternative first exons within each gene cluster were determined as described in the Methods section.
*** P-values were determined using t-tests.
ing putative ORF translations of transcript isoforms with
the NCBI Conserved Domain Database (CDD) [27]. As
shown in Table 2, about 5~10% of N-terminal changes in
type I AFE clusters overlapped with know functional protein domains in at least one of the isoforms, while
20~30% of N-terminal changes in type II AFE clusters did
so. We found that ~5% of the functional alterations in
type II AFE clusters involved whole domain additions
and/or deletions. Such AFE-introduced protein modulation has the potential to result in complex functional regulation.
We noticed that, at least in some cases, the use of alternative first exons was coupled with downstream alternative
splicing events (Figure 1C), which probably caused reading frame shifts and rendered the subsequent isoforms
possible candidates for nonsense-mediated mRNA decay
(NMD). We thus deduced the putative transcription isoforms for gene structures that did not contain full-length/
reference sequences based on the approach from TAP
[28]. We used the definition of premature termination
codons (PTCs) as in-frame stop codons residing >50 bp
upstream of the last 3' exon-exon junction, as previously
reported [26]. Screening results indicated that about 284
and 52 of AFE transcription isoforms in rice and Arabidop-
sis produced NMD candidates, respectively. These frequencies were much smaller than those observed in the
total of plant AS isoforms [26]. This discrepancy might
partly result from the fact that AFE-coupled alternative
splicing events are only a small subset of the total AS
events in plants; it suggests that most of the AFE-containing events are functional, which is consistent with our
analysis of the relationship between AFEs and protein
diversity.
GO classification of AFE-containing events
To investigate which kinds of genes were likely to use
alternative first exons and what biological consequences
AFEs could bring about, we first categorized AFE-containing clusters in rice and Arabidopsis according to the Gene
Ontology classification. Then we used the whole genome
GO categories from rice and Arabidopsis as references to
calculate the probability that a GO category in the AFEcontaining clusters was significantly enriched or depleted.
As listed in Tables 5 and 6, although categories of diverse
functions were observed, genes participating in enzymatic
reactions and cellular processes were significantly
enriched in both plants. Enrichment of AFE-containing
clusters was also found for the functional categories of cellular process regulation, transporter, ATP binding, cell
Table 4: secondary structure formation analysis at 5' splice sites of AFEs
Constitutive (± SD) *
AFE Type I
AFE Type II
Total
Rice
Comparison with
constitutive sites ***
Arabidopsis
Comparison with
constitutive sites ***
Major**
Minor**
Total
Major**
Minor**
-19.22 ± 5.59
-23.61 ± 8.62
3.2796e-071
-24.28 ± 8.37
1.8749e-061
-23.00 ± 8.79
9.6957e-035
-22.45 ± 7.8
9.6069e-082
-24.7 ± 8.51
1.7511e-160
-20.37 ± 6.46
3.0208e-012
-17.80 ± 4.33
-15.09 ± 5.10
1.6711e-028
-14.59 ± 5.38
4.5892e-022
-15.60 ± 4.62
1.3987e-011
-16.52 ± 4.98
4.7938e-015
-16.47 ± 4.89
1.9863e-009
-16.46 ± 5.29
2.9444e-009
* Secondary structure formation was measured as Minimal Folding Energy (MFE) by MRNAFOLD. Lower scores indicate a higher likelihood of an
input sequence to form a secondary structure;
** Major and minor types of alternative first exons within each gene cluster were determined as described in the Methods section.
*** P-values were determined using t-tests.
Page 7 of 13
(page number not for citation purposes)
BMC Plant Biology 2007, 7:55
/>
Table 5: Functional categories (GO) significantly biased in AFE-containing clusters in Arabidopsis
GO category
AFE containing cluster
P-value*
Enriched**
cellular physiological process
metabolism
nucleotide binding
catalytic activity
transferase activity
ligase activity
hydrolase activity
ubiquitin ligase complex
intracellular part
intracellular
cell part
membrane part
nucleic acid binding
lyase activity
localization
327
297
65
27
104
25
89
13
259
265
368
37
91
18
51
0
0
0
1.52E-10
1.35E-09
1.73E-08
1.20E-07
1.24E-07
1.94E-07
2.42E-07
7.82E-06
4.80E-05
0.000128
0.000265
0.000476
Depleted
triplet codon-amino acid adaptor
activity
0
5.61E-06
* P-value was calculated by the hypergeometric distribution. The cutoff is 1E-5.
** "Enriched" categories refer to those containing significantly more genes (observed) than expected. "Depleted" categories refer to those
containing significantly less genes (observed) than expected.
communication, and response to endogenous stimulus in
rice. These results indicate that the complex transcription
regulation mediated by AFEs might be indispensable for
the adaptation to dynamic changes in the external and
internal environments of plant cells. It appears plausible
that when the environment changes, protein functions are
fine-tuned by the addition and/or deletion of functional
motifs at the N-termini, or protein localizations are reassigned by altering signal peptides or transporter activities.
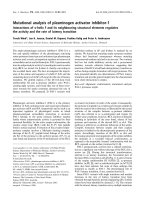
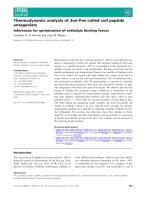
Several GO categories showed inconsistency between rice
and Arabidopsis (Figure 3). For example, "intracellular
part", "intracellular" and "cell part" were enriched in Arabidopsis, but were reduced in rice. Further studies are
needed to elucidate such discrepancies.
We also compared functional differences between the two
types of AFEs in rice and Arabidopsis. As shown in Figure 4,
although there were differences in categories that contained only a few genes, such as "envelope", "molecular
transducer activity" and "reproduction", none of these
was statistically significant (Fisher's Exact Test p < 0.05).
Thus, we concluded that there were no significant functional biases between type I and type II AFE clusters in rice
and Arabidopsis.
One should note that at least one disadvantage of using
GO classification is that GO mappings of identical gene
products from different databases are sometime different,
and so the results should be used with a certain degree of
caution.
Tissue- and development stage- specific expression of AFE
isoforms in plant genomes
We adopted a method suggested by Qiang Xu et al. [5] to
evaluate whether AFEs were involved in tissue- and/or
developmental stage-specific expression. Tissue and
developmental stage information were downloaded from
the NCBI Library Browser classification. For those libraries
with ambiguous or incomplete information in the Unigene database, we checked their dbEST entries and classified them accordingly. Then we calculated three scores for
each AFE-containing gene, namely a tissue specificity
score TS and two robustness values rTS and rTS~. As
shown in Table 7, by using High Confidence criteria (HC,
see Methods), we identified 390 and 31 AFE clusters
involved in tissue-specific expression, as well as 273 and
44 AFE clusters involved in development-stage-specific
expression, in rice and Arabidopsis, respectively. With
slightly less stringent criteria (Low Confidence, LC, see
Methods), the numbers of specifically expressed genes
increased two to three-fold.
In total, we estimated that around 20~66% of rice AFE
clusters were regulated in an either tissue- or development-specific transcription manner. Our results are consistent with a previous report that AFEs are involved in
tissue-specific transcription in rice [14]. Conversely, in
Arabidopsis, we found only 5~18% of AFE-containing clus-
Page 8 of 13
(page number not for citation purposes)
BMC Plant Biology 2007, 7:55
/>
Table 6: Functional categories (GO) significantly biased in AFE-containing clusters in Rice.
Enriched
AFE containing cluster
P-value
metabolism
cellular physiological process
nucleotide binding
hydrolase activity
transferase activity
oxidoreductase activity
ion binding
nucleic acid binding
helicase activity
catalytic activity
lyase activity
regulation of cellular process
regulation of physiological process
non-membrane-bound organelle
ligase activity
ATPase activity, coupled to movement of substances
organelle part
intracellular organelle part
membrane
carrier activity
membrane part
protein binding
ion transporter activity
ribonucleoprotein complex
microtubule associated complex
cell communication
amine binding
protein transporter activity
response to endogenous stimulus
unlocalized protein complex
cofactor binding
ATP-binding cassette (ABC) transporter complex
ubiquitin ligase complex
nuclear pore
Depleted
GO category
468
595
155
144
131
79
65
147
17
45
24
50
50
35
32
20
35
35
208
27
32
26
23
23
7
22
6
9
13
5
6
7
18
3
0
0
0
0
0
0
0
1.02E-14
2.78E-09
1.04E-08
1.95E-08
3.95E-08
4.25E-08
4.98E-08
6.29E-08
7.01E-08
7.38E-08
7.38E-08
1.32E-07
2.15E-07
1.24E-06
1.66E-06
2.67E-06
1.38E-05
2.78E-05
3.91E-05
4.49E-05
0.000192
0.000197
0.000212
0.000212
0.000245
0.000306
0.000338
membrane-bound organelle
intracellular organelle
intracellular part
intracellular
cell part
860
878
905
911
1,004
1.47E-52
9.04E-47
4.36E-39
7.83E-38
2.46E-33
ters to be expressed specifically in certain tissues and/or
developmental stages.
Evolutionary conservation of AFEs in plant genomes
To study the conservation of AFE events between rice and
Arabidopsis, we used the longest reference gene or fulllength cDNA in each AFE cluster as representative
sequence. Ortholog relationships were identified by
applying Inparanoid [24] to these sequences. To our surprises, only 19 AFE-containing gene pairs from rice and
Arabidopsis were classified as orthologous groups, which
accounted for only 1.4% of all AFE-containing gene clusters in rice and 2.9% in Arabidopsis. As shown in Figure 3,
GO categories of AFE-containing gene clusters showed no
biases between rice and Arabidopsis (Fisher's Exact Test, p <
0.05), indicating that evolutionary conservation exists in
functional categories instead of individual genes in plant
genomes.
Conclusion
Based on our large scale general 5'-EST and full length
cDNA alignments to the genomes of rice and Arabidopsis,
we estimated that at least ~5% of expressed geneclusters in
plants use alternative first exons. We further analyzed statistical features of these alternatively spliced exons and
compared them with that of constitutively spliced exons.
The results indicated that there could be more differences
between AFEs from rice and Arabidopsis than generally
Page 9 of 13
(page number not for citation purposes)
BMC Plant Biology 2007, 7:55
/>
Table 7: Tissue- and development stage- specific expression of AFEs in rice and Arabidopsis
Tissue specific*
Rice
Arabidopsis
HC**
LC**
HC
LC
Development stage specific*
Both
390
914
31
55
273
713
44
113
200
624
21
39
* Tissue- and development stage- specific gene expression were determined using the methods suggested by Qiang Xu et al.
** High confidence (HC) tissue specificity was defined as TS>50, rTS>0.9 and rTS~>0.9, low confidence (LC) was defined as TS>0, rTS>0.5 and
rTS~>0.5 (see Methods)
anticipated. Expression analysis revealed that 20~66% of
rice AFE clusters were regulated in either tissue- or development- specific manner, which was consistent with a
previous report [14]. However, only 5~18% of Arabidopsis
AFE clusters were involved in tissue- or development- specific expression. Although the GO classification of the
AFE-containing clusters showed no functional biases
between rice and Arabidopsis, only 19 groups of orthologous AFE-containing clusters were identified between the
two plants. Considering that monocot and dicot plants
may use different splicing machineries which are not completely compatible [29,30], we suggest that AFE events
may have evolved independently after the separation of
dicot and monocot lineages.
Although some of the AFE events were removed by nonsense-mediated mRNA decay (NMD), which constitutes
an mRNA surveillance system, we found that the proportion of NMD coupled AFE events was much lower than
that of the total set of alternative splicing evens in plants.
Therefore AFE events appear particularly likely to create
biologically functional transcription isoforms. Unlike a
previous report [14], we have shown that the 49% and
19% of AFE events from Arabidopsis and rice affected the
Figure 3
Gene Ontology (GO) categories of AFE-containing clusters in rice and Arabidopsis
Gene Ontology (GO) categories of AFE-containing clusters in rice and Arabidopsis. The genes were functionally
categorized according to the Gene Ontology Consortium and level two of the assignment results were plotted here. 87%
(1,204 of a total 1,378) AFE-containing clusters from rice and 94% (605 of a total 645) AFE clusters from Arabidopsis were classified by GO.
Page 10 of 13
(page number not for citation purposes)
BMC Plant Biology 2007, 7:55
/>
Figure 4
Gene Ontology (GO) categories of two types of AFE-containing clusters in rice and Arabidopsis
Gene Ontology (GO) categories of two types of AFE-containing clusters in rice and Arabidopsis. The genes were
functionally categorized according to the Gene Ontology Consortium and level two of the assignment results were plotted
here. GO categories of two types of AFE-containing clusters were plotted for rice (A) and Arabidopsis (B), respectively.
Page 11 of 13
(page number not for citation purposes)
BMC Plant Biology 2007, 7:55
/>
N-terminal protein sequences, and approximately 23% of
rice and 57% of Arabidopsis AFE events may derive from
the alternative use of multiple promoters. We anticipate
that further studies of the relationship between AFEs and
protein diversity in vivo will greatly enrich our knowledge
about the complexity of gene expression regulation.
All analysis tools, database dumps and detailed description of methods are available upon requests, correspondence should be addressed to HuSN.
Competing interests
The author(s) declares that there are no competing interests.
Authors' contributions
SNH and WHC conceived the study. LvCY and CQZ collected the data and performed the statistical analysis.
LvGT and WHC controlled and analyzed the data, and
drafted the manuscript. All authors read and approved the
final manuscript.
Additional material
Additional file 1
5.
6.
Chromosomal distribution of AFE-containing clusters in rice genome.
The distribution of AFEs on rice chromosomes was determined using the
alignment positions of AFE-clusters.
Click here for file
[ />7.
Acknowledgements
We thank BingBing Wang for sharing his Alternative Splicing analysis software and giving other important instructions. The National Natural Science
Foundation (NNSF) of China (No. 90208029, to HuSN) supported this
work.
References
1.
2.
3.
4.
Blencowe BJ: Alternative splicing: new insights from global
analyses. Cell 2006, 126(1):37-47.
Maniatis T, Tasic B: Alternative pre-mRNA splicing and proteome
expansion
in
metazoans.
Nature
2002,
418(6894):236-243.
Lareau LF, Green RE, Bhatnagar RS, Brenner SE: The evolving roles
of alternative splicing. Curr Opin Struct Biol 2004, 14(3):273-282.
Lander ES, Linton LM, Birren B, Nusbaum C, Zody MC, Baldwin J,
Devon K, Dewar K, Doyle M, FitzHugh W, Funke R, Gage D, Harris
K, Heaford A, Howland J, Kann L, Lehoczky J, LeVine R, McEwan P,
McKernan K, Meldrim J, Mesirov JP, Miranda C, Morris W, Naylor J,
Raymond C, Rosetti M, Santos R, Sheridan A, Sougnez C, StangeThomann N, Stojanovic N, Subramanian A, Wyman D, Rogers J, Sulston J, Ainscough R, Beck S, Bentley D, Burton J, Clee C, Carter N,
Coulson A, Deadman R, Deloukas P, Dunham A, Dunham I, Durbin
R, French L, Grafham D, Gregory S, Hubbard T, Humphray S, Hunt
A, Jones M, Lloyd C, McMurray A, Matthews L, Mercer S, Milne S,
Mullikin JC, Mungall A, Plumb R, Ross M, Shownkeen R, Sims S,
Waterston RH, Wilson RK, Hillier LW, McPherson JD, Marra MA,
Mardis ER, Fulton LA, Chinwalla AT, Pepin KH, Gish WR, Chissoe SL,
Wendl MC, Delehaunty KD, Miner TL, Delehaunty A, Kramer JB,
8.
9.
10.
11.
12.
13.
14.
Cook LL, Fulton RS, Johnson DL, Minx PJ, Clifton SW, Hawkins T,
Branscomb E, Predki P, Richardson P, Wenning S, Slezak T, Doggett
N, Cheng JF, Olsen A, Lucas S, Elkin C, Uberbacher E, Frazier M,
Gibbs RA, Muzny DM, Scherer SE, Bouck JB, Sodergren EJ, Worley
KC, Rives CM, Gorrell JH, Metzker ML, Naylor SL, Kucherlapati RS,
Nelson DL, Weinstock GM, Sakaki Y, Fujiyama A, Hattori M, Yada T,
Toyoda A, Itoh T, Kawagoe C, Watanabe H, Totoki Y, Taylor T,
Weissenbach J, Heilig R, Saurin W, Artiguenave F, Brottier P, Bruls T,
Pelletier E, Robert C, Wincker P, Smith DR, Doucette-Stamm L,
Rubenfield M, Weinstock K, Lee HM, Dubois J, Rosenthal A, Platzer
M, Nyakatura G, Taudien S, Rump A, Yang H, Yu J, Wang J, Huang G,
Gu J, Hood L, Rowen L, Madan A, Qin S, Davis RW, Federspiel NA,
Abola AP, Proctor MJ, Myers RM, Schmutz J, Dickson M, Grimwood
J, Cox DR, Olson MV, Kaul R, Raymond C, Shimizu N, Kawasaki K,
Minoshima S, Evans GA, Athanasiou M, Schultz R, Roe BA, Chen F,
Pan H, Ramser J, Lehrach H, Reinhardt R, McCombie WR, de la
Bastide M, Dedhia N, Blocker H, Hornischer K, Nordsiek G, Agarwala R, Aravind L, Bailey JA, Bateman A, Batzoglou S, Birney E, Bork
P, Brown DG, Burge CB, Cerutti L, Chen HC, Church D, Clamp M,
Copley RR, Doerks T, Eddy SR, Eichler EE, Furey TS, Galagan J, Gilbert JG, Harmon C, Hayashizaki Y, Haussler D, Hermjakob H,
Hokamp K, Jang W, Johnson LS, Jones TA, Kasif S, Kaspryzk A,
Kennedy S, Kent WJ, Kitts P, Koonin EV, Korf I, Kulp D, Lancet D,
Lowe TM, McLysaght A, Mikkelsen T, Moran JV, Mulder N, Pollara VJ,
Ponting CP, Schuler G, Schultz J, Slater G, Smit AF, Stupka E, Szustakowski J, Thierry-Mieg D, Thierry-Mieg J, Wagner L, Wallis J,
Wheeler R, Williams A, Wolf YI, Wolfe KH, Yang SP, Yeh RF, Collins
F, Guyer MS, Peterson J, Felsenfeld A, Wetterstrand KA, Patrinos A,
Morgan MJ, de Jong P, Catanese JJ, Osoegawa K, Shizuya H, Choi S,
Chen YJ: Initial sequencing and analysis of the human
genome.
Nature
2001,
409(6822):860-921.
Xu Q, Modrek B, Lee C: Genome-wide detection of tissue-specific alternative splicing in the human transcriptome. Nucl
Acids Res 2002, 30(17):3754-3766.
Kimura K, Wakamatsu A, Suzuki Y, Ota T, Nishikawa T, Yamashita R,
Yamamoto J, Sekine M, Tsuritani K, Wakaguri H, Ishii S, Sugiyama T,
Saito K, Isono Y, Irie R, Kushida N, Yoneyama T, Otsuka R, Kanda K,
Yokoi T, Kondo H, Wagatsuma M, Murakawa K, Ishida S, Ishibashi T,
Takahashi-Fujii A, Tanase T, Nagai K, Kikuchi H, Nakai K, Isogai T,
Sugano S: Diversification of transcriptional modulation: largescale identification and characterization of putative alternative promoters of human genes. Genome research 2006,
16(1):55-65.
Luzi L, Confalonieri S, Di Fiore PP, Pelicci PG: Evolution of Shc
functions from nematode to human. Curr Opin Genet Dev 2000,
10(6):668-674.
Zavolan M, van Nimwegen E, Gaasterland T: Splice variation in
mouse full-length cDNAs identified by mapping to the
mouse genome. Genome research 2002, 12(9):1377-1385.
Landry JR, Mager DL, Wilhelm BT: Complex controls: the role of
alternative promoters in mammalian genomes. Trends Genet
2003, 19(11):640-648.
Bonham K, Ritchie SA, Dehm SM, Snyder K, Boyd FM: An alternative, human SRC promoter and its regulation by hepatic
nuclear factor-1alpha. J Biol Chem 2000, 275(48):37604-37611.
Kelner MJ, Bagnell RD, Montoya MA, Estes LA, Forsberg L, Morgenstern R: Structural organization of the microsomal glutathione S-transferase gene (MGST1) on chromosome 12p13.113.2. Identification of the correct promoter region and demonstration of transcriptional regulation in response to oxidative stress. J Biol Chem 2000, 275(17):13000-13006.
Hu ZZ, Zhuang L, Meng J, Leondires M, Dufau ML: The human prolactin receptor gene structure and alternative promoter utilization: the generic promoter hPIII and a novel human
promoter hP(N). J Clin Endocrinol Metab 1999, 84(3):1153-1156.
Wang X, Su H, Bradley A: Molecular mechanisms governing
Pcdh-gamma gene expression: evidence for a multiple promoter and cis-alternative splicing model. Genes Dev 2002,
16(15):1890-1905.
Kitagawa N, Washio T, Kosugi S, Yamashita T, Higashi K, Yanagawa
H, Higo K, Satoh K, Ohtomo Y, Sunako T, Murakami K, Matsubara K,
Kawai J, Carninci P, Hayashizaki Y, Kikuchi S, Tomita M: Computational analysis suggests that alternative first exons are
involved in tissue-specific transcription in rice (Oryza sativa).
Bioinformatics (Oxford, England) 2005, 21(9):1758-1763.
Page 12 of 13
(page number not for citation purposes)
BMC Plant Biology 2007, 7:55
15.
16.
17.
18.
19.
20.
21.
22.
23.
24.
25.
26.
27.
28.
29.
30.
/>
Quelle DE, Zindy F, Ashmun RA, Sherr CJ: Alternative reading
frames of the INK4a tumor suppressor gene encode two
unrelated proteins capable of inducing cell cycle arrest. Cell
1995, 83(6):993-1000.
Liang H, Landweber LF: A genome-wide study of dual coding
regions in human alternatively spliced genes. Genome research
2006, 16(2):190-196.
Bai X, Peirson BN, Dong F, Xue C, Makaroff CA: Isolation and
characterization of SYN1, a RAD21-like gene essential for
meiosis in Arabidopsis. Plant Cell 1999, 11(3):417-430.
Bairoch A, Apweiler R, Wu CH, Barker WC, Boeckmann B, Ferro S,
Gasteiger E, Huang H, Lopez R, Magrane M, Martin MJ, Natale DA,
O'Donovan C, Redaschi N, Yeh LSL: The Universal Protein
Resource (UniProt). Nucl Acids Res 2005, 33(suppl_1):D154-159.
Pertea M, Lin X, Salzberg SL: GeneSplicer: a new computational
method for splice site prediction. Nucleic acids research 2001,
29(5):1185-1190.
Ivo LH, Walter F, Peter FS, Bonhoeffer LS, Manfred T, Pet: Fast Folding and Comparison of RNA Secondary Structures. Santa Fe
Institute; 1993.
Bailey TL, Elkan C: Fitting a mixture model by expectation
maximization to discover motifs in biopolymers. Proc Int Conf
Intell Syst Mol Biol 1994, 2:28-36.
Ashburner M, Ball CA, Blake JA, Botstein D, Butler H, Cherry JM,
Davis AP, Dolinski K, Dwight SS, Eppig JT, Harris MA, Hill DP, IsselTarver L, Kasarskis A, Lewis S, Matese JC, Richardson JE, Ringwald M,
Rubin GM, Sherlock G: Gene ontology: tool for the unification
of biology. The Gene Ontology Consortium. Nature genetics
2000, 25(1):25-29.
Ye J, Fang L, Zheng H, Zhang Y, Chen J, Zhang Z, Wang J, Li S, Li R,
Bolund L, Wang J: WEGO: a web tool for plotting GO annotations. Nucleic acids research 2006, 34(Web Server issue):W293-7.
O'Brien KP, Remm M, Sonnhammer EL: Inparanoid: a comprehensive database of eukaryotic orthologs. Nucleic acids research
2005, 33(Database issue):D476-80.
Rice P, Longden I, Bleasby A: EMBOSS: the European Molecular
Biology Open Software Suite.
Trends Genet 2000,
16(6):276-277.
Wang BB, Brendel V: Genomewide comparative analysis of
alternative splicing in plants. Proc Natl Acad Sci U S A 2006,
103(18):7175-7180.
Marchler-Bauer A, Anderson JB, Cherukuri PF, DeWeese-Scott C,
Geer LY, Gwadz M, He S, Hurwitz DI, Jackson JD, Ke Z, Lanczycki CJ,
Liebert CA, Liu C, Lu F, Marchler GH, Mullokandov M, Shoemaker
BA, Simonyan V, Song JS, Thiessen PA, Yamashita RA, Yin JJ, Zhang D,
Bryant SH: CDD: a Conserved Domain Database for protein
classification.
Nucleic acids research 2005, 33(Database
issue):D192-6.
Kan Z, Rouchka EC, Gish WR, States DJ: Gene Structure Prediction and Alternative Splicing Analysis Using Genomically
Aligned ESTs. Genome Res 2001, 11(5):889-900.
Goodall GJ, Filipowicz W: Different effects of intron nucleotide
composition and secondary structure on pre-mRNA splicing
in monocot and dicot plants.
The EMBO journal 1991,
10(9):2635-2644.
Simpson GG, Filipowicz W: Splicing of precursors to mRNA in
higher plants: mechanism, regulation and sub-nuclear organisation of the spliceosomal machinery. Plant molecular biology
1996, 32(1-2):1-41.
Publish with Bio Med Central and every
scientist can read your work free of charge
"BioMed Central will be the most significant development for
disseminating the results of biomedical researc h in our lifetime."
Sir Paul Nurse, Cancer Research UK
Your research papers will be:
available free of charge to the entire biomedical community
peer reviewed and published immediately upon acceptance
cited in PubMed and archived on PubMed Central
yours — you keep the copyright
BioMedcentral
Submit your manuscript here:
/>
Page 13 of 13
(page number not for citation purposes)