báo cáo khoa học: " Global expression analysis of nucleotide binding site-leucine rich repeat-encoding and related genes in Arabidopsis" pps
Bạn đang xem bản rút gọn của tài liệu. Xem và tải ngay bản đầy đủ của tài liệu tại đây (599.97 KB, 20 trang )
BioMed Central
Page 1 of 20
(page number not for citation purposes)
BMC Plant Biology
Open Access
Research article
Global expression analysis of nucleotide binding site-leucine rich
repeat-encoding and related genes in Arabidopsis
Xiaoping Tan
1
, Blake C Meyers
2
, Alexander Kozik
1
, Marilyn AL West
3
,
Michele Morgante
4
, Dina A St Clair
3
, Andrew F Bent
5
and
Richard W Michelmore*
1,3
Address:
1
The Genome Center, University of California, Davis, California 95616, USA,
2
Department of Plant and Soil Sciences, University of
Delaware, Delaware Biotechnology Institute,15 Innovation Way, Newark, Delaware 19711, USA,
3
Department of Plant Sciences, University of
California, Davis, California 95616, USA,
4
Dipartimento di Scienze Agrarie ed Ambientali, Universitá degli Studi di Udine, Via delle Scienze 208,
I-33100 Udine, Italy and
5
Department of Plant Pathology, University of Wisconsin, Madison, Wisconsin 53706, USA
Email: Xiaoping Tan - ; Blake C Meyers - ; Alexander Kozik - ;
Marilyn AL West - ; Michele Morgante - ; Dina A St Clair - ;
Andrew F Bent - ; Richard W Michelmore* -
* Corresponding author
Abstract
Background: Nucleotide binding site-leucine rich repeat (NBS-LRR)-encoding genes comprise the largest class of plant
disease resistance genes. The 149 NBS-LRR-encoding genes and the 58 related genes that do not encode LRRs represent
approximately 0.8% of all ORFs so far annotated in Arabidopsis ecotype Col-0. Despite their prevalence in the genome
and functional importance, there was little information regarding expression of these genes.
Results: We analyzed the expression patterns of ~170 NBS-LRR-encoding and related genes in Arabidopsis Col-0 using
multiple analytical approaches: expressed sequenced tag (EST) representation, massively parallel signature sequencing
(MPSS), microarray analysis, rapid amplification of cDNA ends (RACE) PCR, and gene trap lines. Most of these genes
were expressed at low levels with a variety of tissue specificities. Expression was detected by at least one approach for
all but 10 of these genes. The expression of some but not the majority of NBS-LRR-encoding and related genes was
affected by salicylic acid (SA) treatment; the response to SA varied among different accessions. An analysis of previously
published microarray data indicated that ten NBS-LRR-encoding and related genes exhibited increased expression in
wild-type Landsberg erecta (Ler) after flagellin treatment. Several of these ten genes also showed altered expression after
SA treatment, consistent with the regulation of R gene expression during defense responses and overlap between the
basal defense response and salicylic acid signaling pathways. Enhancer trap analysis indicated that neither jasmonic acid
nor benzothiadiazole (BTH), a salicylic acid analog, induced detectable expression of the five NBS-LRR-encoding genes
and one TIR-NBS-encoding gene tested; however, BTH did induce detectable expression of the other TIR-NBS-encoding
gene analyzed. Evidence for alternative mRNA polyadenylation sites was observed for many of the tested genes. Evidence
for alternative splicing was found for at least 12 genes, 11 of which encode TIR-NBS-LRR proteins. There was no obvious
correlation between expression pattern, phylogenetic relationship or genomic location of the NBS-LRR-encoding and
related genes studied.
Conclusion: Transcripts of many NBS-LRR-encoding and related genes were defined. Most were present at low levels
and exhibited tissue-specific expression patterns. Expression data are consistent with most Arabidopsis NBS-LRR-
encoding and related genes functioning in plant defense responses but do not preclude other biological roles.
Published: 23 October 2007
BMC Plant Biology 2007, 7:56 doi:10.1186/1471-2229-7-56
Received: 23 May 2007
Accepted: 23 October 2007
This article is available from: />© 2007 Tan et al; licensee BioMed Central Ltd.
This is an Open Access article distributed under the terms of the Creative Commons Attribution License ( />),
which permits unrestricted use, distribution, and reproduction in any medium, provided the original work is properly cited.
BMC Plant Biology 2007, 7:56 />Page 2 of 20
(page number not for citation purposes)
Background
Over 40 plant resistance (R) genes that are effective
against diverse pathogens and pests, including bacteria,
fungi, viruses, nematodes, and insects, have been cloned
from both monocot and dicot plant species. These R genes
can be divided into at least five classes based on the struc-
ture of their encoded proteins [1-4]. Genes encoding
nucleotide binding site-leucine rich repeat (NBS-LRR)
proteins are the most prevalent and can be divided into
two major groups based on the encoded N-terminal
domains and differences in the NBS domain, as well as
several subgroups [5-8]. One major group predominantly
encodes a coiled coil domain at the N-terminus (CC-NBS-
LRR or "CNL"; e.g. RPS2 and RPM1), whereas the other
group has an N-terminal domain with similarity to the
cytoplasmic domain of Drosophila and human Toll-like
receptor (Toll-interleukin-1 receptor-like (TIR) domain;
TIR-NBS-LRR or "TNL"; e.g. L6, N and RPP5). In the Ara-
bidopsis Col-0 genome 149 NBS-LRR-encoding genes (55
CC-NBS-LRR and 94 TIR-NBS-LRR) and an additional 58
related genes that do not encode LRRs have been identi-
fied [7,9]. Based on phylogenetic analysis, protein motif
comparisons, and intron positions, four CNL subgroups,
eight TNL subgroups, and a pair of divergent "NL" pro-
teins have been identified in Arabidopsis [7,10]. These
NBS-LRR-encoding genes are distributed as single genes,
clusters, and superclusters in plant genomes [5,7,10,11].
Disease resistance is the predominant function so far
demonstrated for plant NBS-LRR-encoding genes [2].
How NBS-LRR proteins function in disease resistance is
still under investigation [8]. In addition to directly detect-
ing pathogen ligands, R proteins may also monitor
('guard') the status of the targets of pathogen virulence
effectors, or the cellular consequences of the actions of
these proteins [2,12-16]. The LRR domains may be
involved in protein-protein interactions and at least partly
determine resistance specificity [17-27]. Polymorphism in
the TIR region has also been shown to affect resistance
specificity [23,28]. In addition to their role in determining
the recognition specificity, the LRR domains may also par-
ticipate in defense signaling through both intra- and inter-
molecular interactions [27,29-32]. NBS regions contain
several conserved motifs and are homologous to the NB-
ARC (nucleotide binding domain shared by Apaf-1, some
R genes and Ced-4) domain of some eukaryotic cell death
effectors such as Apaf-1 and Ced-4 [33]. The NBS domains
of two NBS-LRR proteins, tomato I2 and Mi-1, have been
demonstrated to be able to bind and hydrolyze ATP [34]
and the ATP binding form is the active configuration of
the I2 protein [35], suggesting that the NBS domain func-
tions as a molecular switch in signal transduction eliciting
the defense response. The role of CC-NBS and TIR-NBS
proteins that lack an LRR domain is unknown but they
may function as adaptor proteins similar to Myd88 in
mammalian systems [9].
Over 14 NBS-LRR-encoding genes that confer resistance
against bacterial, Oomycete, fungal, or viral pathogens
have been isolated from Arabidopsis (Table 1). The
majority of the subgroups of NBS-LRR-encoding genes
contain at least one known R gene or its closest homolog
in the Col-0 genome, suggesting that the majority of NBS-
LRR-encoding genes could be involved in resistance.
However, some of the smaller and more divergent sub-
groups do not contain a known resistance gene and there
is limited evidence for the involvement of NBS-LRR pro-
teins in other aspects of plant biology, such as plant devel-
opment. A T-DNA insertion mutant of an Arabidopsis
TIR-NBS-LRR-encoding gene has altered shade avoidance
as well as disease susceptibility [36]. The adenylyl cyclase
(AC) gene cloned from maize pollen plays a role in pol-
len-polarized growth, for example, and has sequence sim-
ilarity to NBS-LRR-encoding genes [37]. The tomato I-2
gene (CNL type) is expressed at the site of lateral root for-
mation suggesting that it may have functions in addition
to pathogen recognition [38]. The other four protein
classes that include R gene products also contain proteins
that participate in other processes, such as two receptor-
like kinases, CLAVATA1 and brassinosteroid insensitive1
(BRI1), that are involved in development and hormone
reception, respectively, and another receptor-like protein,
CLAVATA 2, which functions in plant development [39-
42]. Analysis of the expression patterns of NBS-LRR-
encoding genes in Arabidopsis may provide clues as to
their functions.
Although an increasing number of R genes are being
cloned, little is known about the regulation of plant R
gene expression. RNA gel-blot analyses have detected low
levels of transcripts for most cloned R genes in unchal-
lenged plants [1,38,43-48]. However, the expression of
few R genes has been investigated in detail. Seven TIR-
NBS-LRR-encoding R genes (L6, Rpp5, N, M, RPS4, RAC1,
and Bs4) have been shown to encode two or more tran-
scripts [46,49-54]; however, the role of alternative splicing
in disease resistance is unknown. The alternative tran-
scripts of tobacco N gene and Arabidopsis RPS4 are
known to be important for the defense responses medi-
ated by these two R genes [50,52]. Rare alternative splicing
has been found for CC-NBS-LRR-encoding R genes. In
common bean, the alternative transcripts were identified
for CC-NBS-LRR-encoding gene JA1tr and the alternative
splicing is not regulated by pathogen infection [55].
Induction of resistance gene expression by pathogen
infection has only been reported for a very small number
of R genes, such as sugar beet Hs1
pro-1
, barley Mla, rice Xa1,
and Xa27 [56-59]. The induction of a recently cloned rice
Xa27 gene, encoding a protein with no homology with
BMC Plant Biology 2007, 7:56 />Page 3 of 20
(page number not for citation purposes)
other R proteins, at the site of pathogen infection is corre-
lated with resistance [59]. The expression of some NBS-
LRR-encoding R genes have been shown be affected by
factors other than pathogen infection, such as tissue type,
developmental stage, or environmental conditions
[38,60-62].
The methods for analysis of gene expression have
advanced from single-gene approaches to a variety of glo-
bal transcript profiling technologies [63,64]. Large scale
expressed sequence tag (EST) sequencing [65] and serial
analysis of gene expression (SAGE, [66]) allow quantita-
tive evaluation of gene expression but are less informative
than massively parallel signature sequencing (MPSS;
[67,68]). MPSS generates millions of tags proximal to the
3' ends of transcripts in a stoichiometric manner; there-
fore the relative abundance of each transcript can be
assessed in each sample and rare transcripts and previ-
ously unidentified genes can be detected. It is, however,
costly and few samples can be analyzed. Microarrays
allow an intermediate number of samples to be analyzed
but require a priori knowledge of the genes expressed
unless tiling arrays are used [69,70]. Current challenges in
using microarray analysis include application of appropri-
ate statistical approaches to identify significant changes in
expression and making informative comparisons across
diverse microarray datasets as well as integrating the
microarray data with expression information derived
from other approaches [71,72].
In this paper, we describe multiple genomic approaches to
characterize the expression of NBS-LRR-encoding and
related genes in Arabidopsis. These approaches included
representation in EST libraries, MPSS, microarray experi-
ments, gene trap lines and RACE-PCR. The transcript
structure was defined for over 80 genes. We determined
the level, tissue specificity and possible inducibility of
expression for ~170 NBS-LRR-encoding and related genes.
Most of the NBS-LRR-encoding and related genes investi-
gated were expressed at low levels and with variable tissue
specificities. As previously observed for known R genes,
expression of these genes was induced during the plant
defense response in only a minority of the cases exam-
ined. This study provides the foundation for further func-
tional analysis of individual genes.
Results
Representation in Expressed Sequence Tag (EST) libraries
We examined the frequency with which NBS-LRR-encod-
ing transcripts were present in EST collections at several
times during our study. In April 2002, a total of 181,406
Arabidopsis sequences from the NCBI EST database were
searched for similarity to the spliced genomic ORFs and
genomic sequences of 170 NBS-LRR-encoding and related
genes. ESTs were detected for about half (98) of these 170
genes; most genes (81) had five or less representatives per
gene. At these low frequencies other expressed NBS-LRR-
encoding and related genes could have gone undetected
in this depth of EST sampling. Therefore more efficient
and sensitive methods were used to analyze the expres-
sion of NBS-LRR-encoding and related genes. When the
Table 1: Fourteen NBS-LRR-encoding disease resistance genes cloned from Arabidopsis
Gene Gene or closest
homolog in
Col-0
Class Pathway Pathogen Avr gene Reference
RPM1 At3g07040 CNL NDR1 Pseudomonas syringae avrRpm1, avrB [43, 117-120]
RPS2 At4g26090 CNL NDR1 Pseudomonas syringae avrRpt2 [119, 121-124]
RPS4 At5g45250 TNL EDS1 Pseudomonas syringae avrRps4 [100, 125, 126]
RPS5 At1g12220 CNL NDR1 Pseudomonas syringae avrPphB [29, 119, 127, 128]
RPP1 At3g44670 TNL EDS1 Hyaloperonospora parasitica ATR1
NdWsB
[19, 120, 129]
RPP4 At4g16860 TNL EDS1(partial NDR1 in
cotyledon)
Hyaloperonospora parasitica [119, 126, 130]
RPP5 At4g16950 TNL EDS1 Hyaloperonospora parasitica [46, 126]
RPP8/HRT/RCY1 At5g43470 CNL Non-EDS1, Non-NDR1 Hyaloperonospora parasitica;
turnip crinkle virus;
cucumber mosaic virus
[20, 126, 131-133]
RPP13 At3g46530 CNL Non-EDS1, Non-NDR1 Hyaloperonospora parasitica ATR13 [134-136]
RRS1-R At5g45260 TNLW Partially NDR1 Ralstonia solanacearum popP2 [137, 138]
RPP2A and RPP2B At4g19500
At4g19510
TNTNL TNL Hyaloperonospora parasitica [139]
RAC1 At1g31540 TNL EDS1 Albugo candida [53]
ADR1 At1g33560 CNL Hyaloperonospora parasitica
and Erysiphe cichoracearum
[140]
RLM1 At1g64070 and
At1g63880
TNL Leptosphaeria maculans [141]
BMC Plant Biology 2007, 7:56 />Page 4 of 20
(page number not for citation purposes)
same analysis was repeated in July 2006, 622,792 Arabi-
dopsis EST sequences were searched for similarity to 172
NBS-LRR-encoding and related genes. ESTs were detected
for only about two thirds (120) of the 172 genes analyzed.
Most of these (94) still had ten or fewer representatives
per gene (Table 2; detailed information in additional file
1 and online database [73]).
Massively Parallel Signature Sequencing (MPSS) analysis
The expression of 170 NBS-LRR-encoding and related
genes was then determined by utilizing the DuPont MPSS
database for Arabidopsis and the public Arabidopsis
MPSS database ([74-77]). On average, there were approx-
imately one million tags in each of the 22 DuPont librar-
ies (Table 3) and about two and half million tags in each
of the seventeen libraries generated by Meyers et al. (Table
4). These tags represent all the transcripts in a given sam-
ple and the frequency of each tag is correlated to the
expression level of each represented gene.
Most of the 170 NBS-LRR-encoding and related genes
were detected in at least one library and at low levels (1 to
991 adjusted parts per million (adjPPM) or transcripts per
million (TPM) compared to reference genes such as EF-1
α
(769 to 4061 adjPPM) and ACT-2 (6–2925 adjPPM) (ref-
erence genes used in [9]). The most highly expressed NBS-
LRR-encoding or related gene was At3g04210 at a level of
991 TPM in the library made from leaves 52 hours after
treatment with salicylic acid (S52). The second most
highly expressed gene (683 TPM) was At1g72900 in the
library made from callus (CAS). The gene with highest
expression in untreated Arabidopsis tissues was
At3g04210, which was expressed at 322 TPM in a library
made from leaf (LES). Other genes were expressed at
much lower levels than these two genes. About half of the
genes (73) were expressed at very low levels of less than 32
adjPPM or TPM. Expression of only 11 genes was not
detected in any of the 37 MPSS libraries. The genes exhib-
iting higher levels of expression in the MPSS analysis, for
example At4g33300 and At3g50950, were also well repre-
sented in the EST dataset. Expression of 17 of the 21 pre-
dicted or potential pseudogenes in Col-0 genome [7] was
detected in at least one MPSS libraries generated from tis-
sue of Col-0.
The total number of NBS-LRR-encoding and related genes
expressed varied widely between MPSS libraries from 101
detected in the Col-0 leaf library (LEF), to 15 detected in
the library made from Col-0 late stage developing seeds
(Ase2lm-la). On average, each gene was present in only 15
of the 39 libraries (Additional file 1). The four most prev-
alent genes, At1g61190, At1g61300, At1g59124, and
At3g07040, which all encode CC-NBS-LRR proteins, were
detected in 37 out of 39 libraries studied.
Most NBS-LRR-encoding and related genes exhibited dif-
ferent levels of expression in different tissues, at different
developmental stages or in different genotypes of Arabi-
dopsis (Additional file 1). Forty NBS-LRR-encoding and
related genes were expressed at a higher level in callus
than in any other tissues examined in the public Arabi-
dopsis MPSS database. Some genes were preferentially
expressed in aerial plant parts (e.g. At5g44870, 58 TPM in
leaf and 2 TPM in root), while others were root-specific
Table 2: Summary of EST, RACE, MPSS, and microarray expression analyses of NBS-LRR-encoding and related genes
Predicted Protein
Domains
a
Code # based on
prior
annotation
# based on
full manual
annotation
ESTs (#
expressed/
# studied)
2002
ESTs (#
expressed/
#studied)
2006
RACE (#
expressed/
# studied)
b
MPSS (#
expressed/
# studied)
Microarray
(#P or M/#
studied)
c
# detected
by both
MPSS and
microarray
CC-NBS-LRR CNL 48 51 28/49 36/51 26/35 46/49 32/47 31
NBS
CC
-LRR NL 2 4 2/4 3/4 1/1 3/4 2/3 2
TIR-NBS-LRR TNL 82 83 46/83 56/83 38/50 79/83 50/80 50
NBS
TIR
-LRR NL 2 2 0/2 0/2 0/1 1/2 0/2 0
TIR-NBS-LRR-X TNLX 5 5 3/5 4/5 4/5 5/5 3/5 3
TIR-NBS-TIR-NBS-LRR TNTNL 2 2 2/2 2/2 2/2 2/2 1/2 1
TIR-TIR-NBS-LRR TTNL 0 2 2/2 2/2 2/2 2/2 2/2 2
Total with LRRs 141 149
TIR-NBS TN 14 21 9/15 10/15 5/9 13/15 10/15 10
TIR-X TX 23 30
X-TIR-NBS-X XTNX 0 2 2/2 2/2 2/2 1/2 1
CC-NBS CN 4 4 3/4 3/4 2/2 4/4 1/2 1
CC-NBS-X CNX 1 1 1/1 1/1 1/1 1/1 1/1 1
CC (related to CNL) C 0 1
NBS
CC
N 1 1 0/1 1/1 0/1 1/1 1/1 1
Total without LRRs 43 58
Total 207 98/170 120/172 81/109 159/170 104/162 103
a
"CC" and "TIR" subscript indicates motifs predictive of a CC or TIR domain N-terminal to the NBS. The first four columns are from [7].
b
NBS-LRR-encoding and related genes for which RACE-PCR products were detected for either 5' or 3'end, or both.
c
Number called as present (P) or marginal (M) in one of the three control Col-0 samples collected 4 hours post treatment with 0.02% silwet (experiment
described in [79]; additional file 1). ATH1 array was used for transcript profiling.
BMC Plant Biology 2007, 7:56 />Page 5 of 20
(page number not for citation purposes)
(e.g. At5g45210, 28 TPM in roots, 0 PPM in leaves and
other tissues). Some genes were expressed primarily in
flowers (e.g. At1g63740, 52 TPM in flower, 17 TPM in sil-
ique, and less than 5 TPM in root, leaf and callus). Some
were induced in response to a chemical or hormone (e.g.
At1g72850, 12 adjPPM vs 3 adjPPM in the abscisic acid
(ABA) induced Landsberg erecta (Ler) plants vs uninduced
plants, respectively). This range of expression patterns
suggests that NBS-LRR-encoding and related genes may
have a variety of functions.
Visual inspection revealed no obvious correlation
between the encoded protein structures (CC-NBS (CN),
CC-NBS-LRR (CNL), TIR-NBS (TN) or TIR-NBS-LRR
(TNL)) of the genes studied and their expression patterns.
Each group contained genes with different expression lev-
els and tissue specificities. Within the four CNL subgroups
Table 4: MPSS libraries of Arabidopsis thaliana from public MPSS databases
Library Code
a
Ecotype Tissue Description # signatures
CAF 1 Columbia Callus Callus – actively growing 1959539
INF 2 Columbia Inflorescence Inflorescence – mixed stage, immature buds 1774306
LEF 3 Columbia Leaf Leaves – 21 day, untreated 2884598
ROF 4 Columbia Root Root – 21 day, untreated 3642632
SIF 5 Columbia Silique Silique – 24 to 48 hr post-fertilization 2012859
AP1 6 Columbia Inflorescence ap1-10 inflorescence – mixed stage, immature buds 2964724
AP3 7 Columbia Inflorescence ap3-6 inflorescence – mixed stage, immature buds 2435965
AGM 8 Columbia Inflorescence agamous inflorescence – mixed stage, immature buds 2575670
INS 9 Columbia Inflorescence Inflorescence – mixed stage, immature buds 2890894
ROS 10 Columbia Root Root – 21 day, untreated 2458436
SAP 11 Columbia Inflorescence sup/ap1 inflorescence – mixed stage, immature buds 2310350
S04 12 Columbia Leaf Leaves, 4 hr post SA treatment 3006975
S52 13 Columbia Leaf Leaves, 52 hr post SA treatment 2964840
LES 14 Columbia Leaf Leaves – 21 day, untreated 3109385
GSE 15 Columbia Seedling Germinating seedlings 2550655
CAS 16 Columbia Callus Callus – actively growing 1919458
SIS 17 Columbia Silique Silique – 24 to 48 hr post-fertilization 2349283
a
Libraries 1 to 5 were made using the classic MPSS protocol; all subsequent libraries were made using signature MPSS [75, 76].
Table 3: MPSS libraries of Arabidopsis thaliana from Dupont MPSS databases
Library Code Ecotype Tissue Description # signatures
Ale1lm.1 a Columbia Leaf Early and late leaves 391295
Afl2lm.1 b Columbia Flower – shoot Flower and shoot meristems 1997189
Aro1lm c Columbia Root Roots 1531770
Ase2lm-ea d Columbia Seed Early stage developing seeds 1726426
Ase2lm-la e Columbia Seed Late stage developing seeds 287779
Ase1lm f Columbia Seed Germinating seeds 1127420
Asegllm g Columbia Seed gl2 mutant seed, 7 DAF 1572064
Asd2lm-t1.1 h Columbia Seedling Top part of seedlings grown without sucrose 1863086
Asd2lm-t2.1 i Columbia Seedling Top part of seedlings grown with sucrose 1793820
Asd2lm-b1.1 j Columbia Seedling Bottom part of seedlings grown without sucrose 870914
Asd2lm-b2.1 k Columbia Seedling Bottom part of seedlings grown with sucrose 897853
Asdl1lrm.1 l Columbia Seedling Stage 1 seedlings 1152083
Ack1lm-ctrGVG.1 m Landsberg Seedling IPT plants untreated 1893424
Ack1lm-tr6.1 n Landsberg Seedling IPT plants treated with DEX, 6hrs 1639214
Ack1lm-tr24.1 o Landsberg Seedling IPT plants treated with DEX, 24 hrs 1783294
Abawt-ctr p Landsberg Seedling Wildtype plants, uninduced 1477653
Abawt-tr q Landsberg Seedling Wildtype plants, ABA induced 1266435
Aabi1-ctr r Landsberg Seedling abi1 plants, uninduced, 3 and 5 hrs 1656984
Aabi1-tr s Landsberg Seedling abi1 plants, ABA induced, 3 and 5 hrs 1241725
Afl2lm.test t Columbia Flower – shoot Flower and shoot meristem
Ase2lm-ea.test u Columbia Seed Developing seeds, early stage
Ase7lm-WT v Columbia Seed Seed wt, 7 DAF
BMC Plant Biology 2007, 7:56 />Page 6 of 20
(page number not for citation purposes)
and the eight TNL subgroups of NBS-LRR-encoding genes
identified by Meyers et al. [7], a wide variety of gene
expression patterns were observed (Additional file 1).
Consequently, no correlation was detected between gene
expression pattern and position on the phylogenetic tree.
There was also no obvious correlation between chromo-
somal location and expression pattern (Additional file 1).
One hundred and twenty NBS-LRR-encoding or related
genes (two divergent NLs, 32 CNLs, two CNs, one NL (CC
type), one NBS (CC type), 63 TNLs, five TNLX, two
TNTNL, two TTNL, one NL (TIR type), two XTNX, and
seven TNs) studied were represented by more than one
MPSS tag (Additional file 1). Multiple tags can be detected
for one gene when alternative splicing results in different
stop codons and polyadenylation sites or when the poly-
adenylation site varies either side of a Sau3A site [9]. A
total of 72 genes showed possible alternative polyade-
nylation. Twelve of these genes showed possible alterna-
tive splicing because some of the tags detected were
located at splice sites or within introns; 11 out of these 12
genes were of TNLs rather than CNLs, consistent with the
multiple introns in TNL-encoding genes and a paucity of
introns in CNL-encoding genes. Alternative splicing was
confirmed by RACE-PCR and subsequent sequencing for
four of these genes: At1g63750, At4g16860 (RPP4
homolog in Col-0), At4g16950 (RPP5 homolog in Col-0),
and At5g46270. The failure to detect alternative tran-
scripts for the other eight genes may have been due to tis-
sue specificity or low abundance of the alternatively
spliced transcripts. For other genes with multiple tags
detected, some were due to shifts in the polyadenylation
site and some were due to the tags representing several
members of a gene family.
Microarray analysis
To examine expression under a different range of condi-
tions than those from which the MPSS libraries had been
made, the expression of NBS-LRR-encoding and related
genes was also analyzed using data from Affymetrix
microarrays that were generated as components of two
larger studies [78,79]. Both of these experiments utilized
the whole genome array (ATH1; Affymetrix), which con-
tained 152 probe sets representing 162 NBS-LRR-encod-
ing and related genes which were located on the
phylogenetic tree generated by Meyers et al. [7], including
13 known resistance genes (RPP8 is not represented on
this array) or their homologs in Col-0.
In one experiment, changes of expression of NBS-LRR-
encoding and related genes in response to application of
0.3 mM salicylic acid (SA) were analyzed in seven Arabi-
dopsis accessions (Col-0, Cvi-1, Est, Kin-0, Mt-0, Tsu-1,
and Van-0) as part of a study to identify expression level
polymorphisms as described in [79] and ELP website [80].
Re-analysis of this data revealed that approximately two-
thirds of the NBS-LRR-encoding and related genes were
expressed above the detection threshold in the control
Col-0 sample (in at least one of the three replicates col-
lected 4 hours post treatment with 0.02% silwet). The
expression of nine genes, At1g57630, At1g59124,
At1g72900, At1g72910, At3g04210, At3g50950,
At4g16950, At4g33300, and At5g45510 in at least one of
the three control Col-0 samples was higher than the aver-
age of present signal in the corresponding control Col-0
sample. Based on their expression levels in the control
samples, most of the 162 NBS-LRR-encoding and related
genes (138 probe sets out of 152 probe sets) exhibit signif-
icant differences in their expression levels between at least
one pair of Arabidopsis accessions, suggesting the natural
variation in expression of NBS-LRR-encoding genes
between different accessions.
The expression levels of the majority of NBS-LRR-encod-
ing and related genes were not significantly altered by the
SA treatment compared to control samples harvested at
the same timepoints; however, the expression of 15 genes
(three CNLs (At3g14470, At5g04720, and At5g66900),
one CN (At5g45490), one CNX (At5g66630), seven TNLs
(At1g17600, At3g44630, At4g12010, At4g16860 (RPP4
homolog), At5g36930, At5g41740, and At5g46520), two
TNs (At1g66090 and At1g72900), and one divergent NL
(At5g45510)) was significantly induced in Col-0 plants 4
hours after SA treatment (Additional files 1 and 2). In
addition, the expression of four NBS-LRR-encoding and
related genes (two TNLs (At3g44400 and At4g36150),
one TN (At3g04210), and one CNL (At3g50950)) was
down-regulated in Col-0 plants 28 hours after SA treat-
ment. These four genes also showed increases in their
expression 4 hours after SA treatment though not to a sta-
tistically significant extent.
The expression of different NBS-LRR-encoding and related
genes was affected at different time points after SA treat-
ment in the various Arabidopsis accessions (Additional
file 2). A total of 33 probe sets exhibited differential
expression in response to SA treatment in at least one Ara-
bidopsis accession. Some NBS-LRR-encoding genes exhib-
ited similar responses to SA treatment across different
accessions though some do not. For example, the expres-
sion of one CNL-encoding gene, At1g12280, was down-
regulated both in Est 4 hours after SA treatment and in
Van-0 28 hours after SA treatment. One CNL gene,
At4g14610, showed elevated expression 4 hours after SA
treatment in Kin-0 and Tsu-1. One CNL gene, At5g66900,
showed elevated expression in five Arabidopsis acces-
sions, Col-0, Kin-0, Mt-0, Tsu-1, and Van-0, 4 hours after
SA treatment but down-regulated expression 28 hours
after SA treatment in Van-0 only.
BMC Plant Biology 2007, 7:56 />Page 7 of 20
(page number not for citation purposes)
In order to compare the SA responses to changes of expres-
sion during the basal defense response, we reanalyzed the
data set on the response to flagellin generated by Zipfel et
al. [78] using the same procedures as used above. In this
analysis, less than half of the NBS-LRR-encoding and
related genes (69) were expressed above the detection
threshold in at least one of the two control wild-type
Landsberg erecta (Ler) samples. The expression of ten
NBS-LRR-encoding and related genes (five CNLs
(At3g07040 (RPM1), At3g50950, At4g26090 (RPS2),
At4g33300, and At5g04720), three TNLs (At1g56510,
At1g56540, and At5g22690), and two TNs (At1g72900
and At1g72940)) was induced by flagellin treatment in
wild-type Ler. Interestingly, out of these ten NBS-LRR-
encoding and related genes, one gene, At1g72900, was
also induced in Col-0 and Van-0 4 hours after SA treat-
ment; one gene, At5g04720, was also induced in Col-0
and Mt-0 4 hours after SA treatment; two genes,
At4g33300 and At1g56510, were also induced in Mt-0 4
hours after SA treatment; and one gene, At3g50950,
exhibited down-regulated expression in Col-0 28 hours
after SA treatment, suggesting the interaction between
plant basal defense response and SA pathway (Additional
file 2).
Overall, the expression patterns of the NBS-LRR-encoding
and related genes detected in the above microarray exper-
iments were generally consistent among array experi-
ments. Most genes were detected as expressed at low levels
and not induced by treatment with defense signals.
Five of the mRNA samples that were used to generate the
Arabidopsis MPSS libraries described above (LEF, CAF,
INF, ROF, and SIF MPSS libraries; [75-77]) were also ana-
lyzed using ATH1 arrays to cross-validate the two
approaches. The expression patterns of the NBS-LRR-
encoding and related genes detected in the microarray
experiment were generally consistent with the MPSS data
(Table 2; Additional file 1). These 162 genes showed dif-
ferent expression levels in different tissues. For example,
both the MPSS data and Affymetrix array data indicated
that At4g16990 has its highest expression in leaf, lower
expression in flowers and siliques, and its lowest expres-
sion in callus and root. Most genes were usually the most
highly expressed in callus; expression levels in flowers and
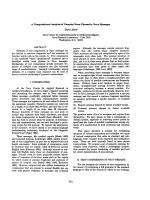
siliques were similar (Figure 1). Forty-six of the 67 genes
with undetectable levels of expression in the leaf sample
in the microarray analysis had 0 MPSS tags in the leaf
MPSS library (LEF), while 75 of the 95 genes detected by
microarray analysis had more than one tag in the MPSS
leaf library. For 88 NBS-LRR-encoding and related genes
which are represented by unique MPSS tags and probe sets
on the ATH1 array, Spearman rank correlation test
showed a good correlation between MPSS data and
Affymetrix array data generated from the same leaf tissue
(correlation coefficient 0.74357, P-value < 0.001).
Reporter gene traps
We attempted to use enhancer and gene trap lines in par-
allel to the above global analyses, to gain information on
cell-specific expression patterns for individual NBS-LRR-
encoding or related genes and to investigate their induci-
bility in greater detail. Gene traps and enhancer traps con-
tain insertions of the
β
-glucuronidase (GUS) reporter gene
under the control of no promoter or a minimal promoter
respectively [81-83]. The expression pattern of a gene with
a reporter gene inserted within it or nearby can be moni-
tored via expression of the reporter gene. Gene trap and
enhancer traps also allow the analysis of the mutant phe-
notypes resulting from the disruption of chromosomal
genes [81-84].
The Cold Spring Harbor database of flanking sequences
for Arabidopsis Gene Trap lines [85] and the database of
the Ds insertion lines from Singapore IMA (Institute of
The expression level of 162 NBS-LRR-encoding and related genes in five different tissues of Arabidopsis wild-type Col-0Figure 1
The expression level of 162 NBS-LRR-encoding and related
genes in five different tissues of Arabidopsis wild-type Col-0.
All NBS-LRR-encoding and related genes are ordered
according to their At numbers along the X axis. Each Arabi-
dopsis chromosome is indicated below each graph. Y-axis
indicates the relative expression level of each probe set after
scaling the mean intensity of each ATH1 microarray to 500.
0
0
0
0
0
0
0
0
0
0
0
0
0
0
0
0
0
0
0
0
0
0
0
0
0
0
0
0
0
0
0
0
0
0
0
0
0
0
0
0
0
0
0
0
0
0
0
0
0
0
Flower
Leaf Silique
Root
Callus
5000
4000
3000
2000
1000
0
5000
4000
3000
2000
1000
0
5000
4000
3000
2000
1000
0
5000
4000
3000
2000
1000
0
5000
4000
3000
2000
1000
0
1234 5
1234 5
1234 5
1234 5
1234 5
BMC Plant Biology 2007, 7:56 />Page 8 of 20
(page number not for citation purposes)
Molecular Agrobiology, [86]) were searched in 2002 for
insertions in NBS-LRR-encoding and related genes using
BLAST. Ten enhancer trap lines and three gene trap lines
were identified with insertions into NBS-LRR-encoding or
related genes. The insertion sites and orientations were
confirmed for seven enhancer trap lines with insertions
into five NBS-LRR-encoding genes and two TIR-NBS-
encoding genes (Table 5, Figures 2 and 3). No gene trap
lines were confirmed.
The expression pattern of the corresponding NBS-LRR-
encoding and related gene in each confirmed enhancer
trap line was analyzed using GUS staining and quantita-
tive GUS assays of seedlings and five-week old plants. No
GUS activity was detected histochemically in whole seed-
ling, leaves, roots, flowers and stems of any of the five
NBS-LRR and one TIR-NBS enhancer trap lines. This indi-
cated that the low levels of expression detected in the
microarray and MPSS experiments for these genes were
below the detection threshold of GUS assays in these
enhancer trap lines. We found no evidence that any spe-
cific cell types exhibited localized, high levels of expres-
sion as has been observed for insertions into some other
types of genes [81,87,88]. In the enhancer trap line with
an insertion into a TIR-NBS-encoding gene, At1g72910,
there was very faint blue color throughout the leaf after
staining for GUS activity. This low level of GUS activity
was confirmed using a GUS quantitative assay (Figure 4).
At1g72910 was one of the more highly expressed genes
detected in the MPSS libraries and microarray data in Col-
0 leaves (Table 5). These data indicate the threshold nec-
essary for histochemical detection of gene activity in gene
trap lines.
These seven NBS-LRR-encoding and related genes were
not induced by either salicylic acid (SA) or flagellin treat-
ments in the above microarray experiments. To investigate
the possibility that detectable changes in expression
occurred transiently at time points not examined in the
microarray experiments, jasmonic acid (JA) or benzothia-
diazole (BTH) was applied to each of the enhancer trap
plants. Neither GUS staining nor quantitative GUS assays
provided evidence of induced expression of any the five
NBS-LRR-encoding genes and one TIR-NBS-encoding
gene in response to BTH or JA (data not shown). The
expression of At1g72910, on the other hand, was induced
approximately two-fold five days after treatment with
BTH (Figure 4), although significant induction by SA had
not been detected in the microarray analysis. To examine
the possibility that changes in expression occurred in a
restricted number of cells at sites of pathogen penetration,
each of the seven enhancer trap plant was challenged by
P. syringae pv. tomato strain DC3000 carrying avrRpt2 or
avrRpm1. All lines showed a similar hypersensitive
response (HR) as wild-type Landsberg erecta (Ler) plants,
which is the genetic background of the enhancer and gene
trap lines. There was no observable localized induction of
GUS gene expression in the infiltrated area that reacted to
the pathogen.
Rapid Amplification of cDNA Ends (RACE) analysis
The expression of NBS-LRR-encoding and related genes
was further studied using RACE-PCR as a sensitive quali-
tative method to detect expression as well as to define the
5' and 3' ends of the transcripts. Confirmation of tran-
script boundaries was a prerequisite to studies of gene
function because approximately a third of the NBS-LRR-
encoding and related genes in the public database were
previously annotated incorrectly and therefore had to be
corrected by manual re-annotation [7]. The sequences of
our 5' and 3' RACE products were compared with the Ara-
bidopsis genomic sequence to determine the initiation
and termination sites of each transcript (Additional file 1
and online database [73]).
Table 5: Summary of enhancer trap lines
Enhancer
trap line
Gene
interrupted
Gene
type
RACE -PCR
a
GUS staining Microarray data
b
MPSS data
c
SET6934 At1g72870 TN ND no 108.3(M) 1–15(14)
SET7157 At1g65850 TNL ND no 55.4(A) 3–18(4)
SET3935 At5g17680 TNL ND no 54.4(A) 3-3(1)
SET7450 At1g59780 CNL ND no 41.6(A) 3–45(3)
SET6003 At1g61300 NL Expressed no 552.5(P)(probe set cross-
hybridizes to At1g61180,
At1g61190, and At1g61310)
4-179(37), MPSS tags also
represent At1g61180,
At1g61190, and At1g61310.
ET1927 At1g72910 TN Expressed Weak staining in leaf;
weak induction by BTH
5566.9(P) (probe set cross-
hybridizes to At1g72930)
2–127(5), two MPSS tags also
represent other genes.
ET6374 RPP5 (At4g16950
in Col)
TNL Expressed no 1377.5(P) (probe set may cross-
hybridize to At4g16860,
At4g16890, and At4g16920)
3–168(31), several MPSS tags also
represent several other genes
a
ND = no detectable expression.
b
Called present (P), marginal (M), or absent (A) in microarray expression data in control leaf sample of SA experiment [79].
c
Range of adjPPM or TPM (# of libraries with expression detected).
BMC Plant Biology 2007, 7:56 />Page 9 of 20
(page number not for citation purposes)
A total of 109 NBS-LRR-encoding and related genes were
analyzed using total RNA extracted from leaves of Col-0 as
template. At least one RACE product was detected for 81
genes (for 26 out of 35 CNL genes and for 38 out of 50
TNL genes analyzed; Table 2). Both 5' and 3' products
were detected for 68 of these 81 genes. Only 5' products
were detected for another six genes and only 3' products
for an additional seven genes. Neither 5' nor 3' products
were detected for the other 28 genes; the lack of expres-
sion of six of these 28 genes in leaves was confirmed using
RT-PCR with primers that should have amplified an inter-
nal region of the transcript (Figures 2 and 3, Table 2).
RACE for six NBS-LRR-encoding genes that were not
detectable in leaves from four-week old plants was also
conducted using total RNA extracted from seven-day old
seedlings as templates. RACE again failed to detect expres-
sion of five of these genes, At2g17050, At3g46730,
At4g08450, At4g09360, and At4g27190. RACE products
were only detected for At1g65850 in seedlings. For two
NBS-LRR-encoding genes, At3g44400 and At4g33300,
RACE was also performed using the total RNA extracted
from flowers as templates in addition to the templates
generated from leaf and young seedlings. The RACE
results revealed that the expression of these two NBS-LRR-
encoding genes showed different expression pattern in
leaves, seedlings, and flowers. At4g33300 was expressed
highest in seedlings, and then the flower and leaf tissues,
while At3g44400 was expressed higher in leaves than in
flowers.
For the above RACE-PCR products, the length of the 5'
UTR ranged from zero to 241 bp (average = ~50 bp); most
5' transcription start sites were within 100 bp of the ATG
start codon. There was some variation in the transcription
initiation site and often multiple initiation sites were
detected for each gene. The length of the 3' UTR ranged
from 6 bp to 896 bp and most 3' UTRs were several hun-
dred bp long (average = ~250 bp). The most common var-
iation in 3'UTRs was due to alternative polyadenylation
sites. Comparison of RACE and genomic sequences
revealed that 15 genes contained introns in their 5' or 3'
UTR regions. Seven genes had one intron and one had two
introns in their 5' UTRs. Six genes had one intron and one
had three introns in their 3'UTRs. The presence of introns
in either 5' or 3' UTRs has also been indicated in the TAIR
database [89]. Six out of eight genes which have introns in
their 5' UTR according to our RACE results have also been
annotated as having introns in the TAIR database, and
similarly five out of seven genes which have introns in 3'
UTR have also been so annotated in the TAIR database.
Sequence analysis of the RACE-PCR products revealed
that the annotations of 12 NBS-LRR-encoding and related
genes in the TAIR database were incorrect or at least incon-
sistent with our experimental data (Additional file 1).
These genes had been annotated with incorrect transcript
initiation or termination sites, different splicing sites, or
extra exons. The RACE-PCR products validated the previ-
ous manual re-annotations for six genes [7]. The errors in
the other six genes had not previously been detected.
These six genes had different splicing events from those
predicted. RACE-PCR data also revealed the presence of
alternative splicing in the 5'UTR of At1g10920 and 3'UTR
of At1g72860, in addition to the four genes which were
indicated by MPSS data as exhibiting alternative splicing
and had been confirmed by RACE-PCR and sequencing.
Discussion
Our comprehensive expression analysis revealed that the
majority of NBS-LRR-encoding and related genes in Arabi-
dopsis were expressed at low levels and unexpectedly that
many exhibited tissue-specific expression patterns (Addi-
tional file 1). The expression of some but not the majority
of NBS-LRR-encoding and related genes was affected by
treatments with defense signaling chemicals. The expres-
sion pattern of most of the previously uncharacterized
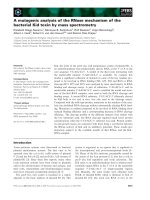
The distribution of CC-NBS-LRR-encoding and related genes analyzed on neighbor-joining tree generated by Meyers et al. [7]Figure 2
The distribution of CC-NBS-LRR-encoding and related genes
analyzed on neighbor-joining tree generated by Meyers et al.
[7]. The genes studied by RACE are indicated by black
arrows, the genes analyzed using RT-PCR are displayed in
bold italic, and NBS-LRR-encoding and related genes with
enhancer trap insertions are marked in bold. Other figure
denotations are as described in Meyers et al. [7].
P25941 outgroup
AT4G19050 * NL
AT5G45510 * NL
AT5G66630 CNX
AT5G66900
AT5G66910
AT4G33300
AT1G33560
AT5G04720
AT5G47280
p?
NL
AT4G27190
AT4G27220
p?
AT4G26090 RPS2
AT1G52660 CN
AT3G15700 CN
AT5G47250
AT5G05400
AT5G47260
AT1G15890
AT1G51485 *
AT5G43730
AT5G43740
AT1G61180 *
AT1G61310 *
AT1G61300 *
p?
NL
AT1G61190
AT1G63350 *
AT1G62630
AT1G63360
AT5G63020
AT1G12290
AT4G10780
AT1G12210
AT1G12280
AT1G12220 RPS5
AT4G14610 *
AT3G14460
AT3G14470
AT3G07040 RPM1
AT4G19060 CN
AT5G45490 CN
AT5G45440 N
AT3G50950
AT3G46710
AT3G46530 [RPP13]
AT3G46730
AT1G50180 *
p
AT1G53350
AT1G10920 *
p
AT5G35450
AT5G43470 [RPP8/HRT]
AT5G48620
p
AT1G59780 *
AT1G59620 *
AT1G58410
AT1G58390
AT1G58400 *
AT1G58602
AT1G59124 *
AT1G58807*
AT1G59218
AT1G58842
1
10
5
2
1
1
3
2
1
0.1
100
96
100
100
100
77
96
100
91
100
100
76
59
66
71
100
66
100
100
100
100
90
74
77
52
75
99
99
64
70
53
100
100
100
51
69
100
99
99
100
100
100
57
99
99
99
90
100
100
100
100
100
CNL-D
CNL-B
CNL-A
CNL-C
NL-A
SET6003
SET7450
BMC Plant Biology 2007, 7:56 />Page 10 of 20
(page number not for citation purposes)
NBS-LRR-encoding and related genes resembles that of
known R genes and therefore is consistent with these
genes also functioning in disease resistance.
Consistency between different analytical approaches
The different analytical approaches varied in their sensi-
tivity and accuracy, but the expression data obtained from
each approach were generally consistent. Both MPSS and
The distribution of TIR-NBS-LRR-encoding and related genes analyzed on neighbor-joining tree generated by Meyers et al. [7]Figure 3
The distribution of TIR-NBS-LRR-encoding and related genes analyzed on neighbor-joining tree generated by Meyers et al. [7].
The genes studied by RACE are indicated by black arrows, the genes analyzed using RT-PCR are displayed in bold italic, and
NBS-LRR-encoding and related genes with enhancer trap insertions are marked in bold. Other figure denotations are as
described in Meyers et al. [7].
0.1
P25941
AT4G23440 XTNX
AT5G56220 XTNX
AT5G45240 *
p
NL
AT4G19500b * TNTNL RPP2A
AT4G12020 XTNLX
AT5G45210
p?
AT4G19520 * TNLX
AT2G17050 * TNLTX
AT5G17890 TNLX
AT3G51560
AT4G36140b TNTNL
AT5G45050 TNLX [RRS1]
AT5G45260
AT4G12010
AT4G19510 *
AT2G17060 *
AT5G45230 *
AT5G45200
AT4G36150
AT5G44870
AT5G17880 *
AT5G45060
AT5G45250 RPS4
AT4G19530 *
AT3G51570
AT5G36930
AT1G27170 TTNL
AT1G27180 TTNL
AT5G17680
AT1G72860 *
AT1G72840
AT4G09430 *
p?
AT4G09360 *
p
NL
AT5G48770
AT1G72870 TN
AT5G48780 TN
AT1G17610 TN
AT5G40090 TN
AT1G72850 TN
AT4G09420 TN
AT4G36140a TNTNL
AT1G72890 TN
AT1G17615 TN
AT1G72910 TN
AT1G72900 TN
AT1G72940 TN
AT1G72950 TN
AT4G16990 TN
AT4G19500a * TNTNL
AT5G51630 *
AT4G16940 *
p
AT4G16960 *
AT4G16920 *
AT4G16860 * RPP4
AT4G16900 *
p?
AT4G16950 * [RPP5]
AT4G16890 *
AT4G08450
AT5G22690 *
AT5G40060 *
P?
AT5G46450
AT5G46470 *
AT5G46510
AT5G46520 *
AT1G31540 *
AT5G46490 *
AT5G46260
AT5G46270
AT5G18350
AT5G18370
AT3G04210 TN
AT3G25510 *
AT3G44400
AT1G69550
AT1G57630 *
p
AT5G44510 *
AT2G14080 RPP28
AT3G04220
p?
AT5G11250
AT1G65850 *
AT3G25515 *
p?
AT5G38340
AT5G38350 *
AT4G11170 *
AT5G49140
AT5G17970
P?
AT5G18360
AT5G41540
AT5G40910
AT5G40920 *
P?
AT5G41550
AT5G41740 *
p
AT5G41750
AT1G66090 TN
AT1G56520 *
p?
AT1G56540
AT1G56510
AT4G14370 *
AT5G38850
AT1G63740 *
AT5G58120
AT1G63730
AT1G63750
AT1G63870
AT1G63860 *
p
AT1G63880
AT1G64070 *
AT2G16870
98
100
91
99
54
100
98
63
54
58
71
99
99
87
100
83
73
56
57
57
88
74
100
63
99
63
65
100
100
78
100
63
98
99
87
100
AT1G17600
AT5G40100
100
76
99
65
50
95
99
100
53
100
97
53
100
100
92
94
92
99
100
95
98
59
92
93
86
99
75
64
66
98
79
99
100
100
98
80
100
100
60
100
94
99
52
78
99
96
100
100
100
3
tr
4
tr
5
16
8
4
14
5
7
5
6
4
5
7
5
7
8
7
8
6
4
5
6
5
6
5
4
AT3G44670 [RPP1]
AT3G44480
AT3G44630
97
86
5
6
4
100
100
99
4
TNL-B
TNL-H
TNL-G
TNL-F
TNL-E
TNL-D
TNL-C
TNL-A
(TNL-A)
(TNL-A)
SET6934
SET3935
ET6374
SET7157
ET1927
BMC Plant Biology 2007, 7:56 />Page 11 of 20
(page number not for citation purposes)
microarrays were the most efficient genome-wide tran-
script profiling methods and they correlated well. MPSS
has several advantages over microarray analysis. MPSS is
more sensitive and accurate, since MPSS provides quanti-
tative assessment of the abundance of each transcript as
opposed to the hybridization intensity generated for each
probe set in the microarray analysis. MPSS is particularly
advantageous for genes that are expressed at low levels
and therefore tend to be more affected by background
noise in microarray analysis. For example, both
At5g45230 and At1g17600 were expressed at undetecta-
ble levels in microarray analysis of leaf tissue; however,
based on MPSS data, At1g17600 was expressed clearly
higher than At5g45230 in the leaf library (14 vs 0 TPM)
(Additional file 1). MPSS can also distinguish multi-gene
family members better than microarrays and therefore
decrease cross-hybridization problems, which is more
common in microarray analysis. Inconsistencies between
MPSS and microarray data could have been due to cross-
hybridization problems in the microarray analysis or due
to some MPSS tags representing several gene family mem-
bers that had high sequence similarity. In addition,
sequencing errors in the current Arabidopsis genome
assembly may have caused incorrect assignment of some
MPSS tags and thus inaccurate determination of expres-
sion. While MPSS has the above advantages, its technical
accessibility and high cost limit its widespread use,
although these issues may be ameliorated with the latest
sequencing technologies. Microarrays therefore remain a
useful complement to investigate situations for which
MPSS data do not exist until other high throughput
sequencing technologies become available that allow
affordable, in depth analysis of EST representation.
Expression levels of NBS-LRR-encoding genes
The majority of NBS-LRR-encoding and related genes
examined in this study were expressed at low levels in
unchallenged plants similar to what has been observed for
most cloned plant R genes. Significant changes in expres-
sion of most NBS-LRR-encoding and related genes includ-
ing the known R genes were not detected during plant
defense responses or treatments with two defense signal-
ing molecules, SA or JA. Other recent RNA profiling exper-
iments also failed to detect differential expression of R
genes [90,91]. Similarly, in another microarray experi-
ment performed to study gene expression changes during
the resistance response, none of the Arabidopsis NBS-
LRR-encoding genes showed significant expression
changes during the plant defense response mediated by
RPS2, RPM1, RPS5, or RPS4 (A. Bent et al., unpublished).
This lack of induction of gene expression during plant
defense response resembles that of most known plant R
genes. Although it is still not clear how plant R proteins
function in the plant defense response, it is clear that they
act at an early step in defense signaling pathways, either as
primary recognition molecules or accessory proteins [14-
16,92-94]. Low levels of constitutive expression of R pro-
teins are consistent with a constitutive ability to recognize
the pathogen infection and induce downstream defense
responses.
There are, however, several indications of transcriptional
control of R gene expression. At least a subset of R genes
are induced above their low levels of constitutive expres-
sion during the elicitation of basal resistance; the expres-
sion of RPS2, RPM1, and eight other NBS-LRR-encoding
and related genes was induced by the bacterial flagellin
peptide, flg22 [78]. This can be thought of increasing the
general sensitivity of the plant to detect potential patho-
gens. Our analysis also revealed that fifteen NBS-LRR-
encoding and related genes in wild-type Col-0, including
the Col-0 homolog of RPP4, were induced 4 hours after
treatment with SA; also several other genes were induced
by SA in other accessions. Interestingly, out of the fifteen
NBS-LRR-encoding and related genes induced by SA in
Col-0, two genes also exhibited elevated expression
induced by flg22. This overlap suggests interactions
between plant basal defense response and SA signaling
pathways. The MPSS data indicated that expression of
many NBS-LRR-encoding and related genes was also
affected by plant developmental stage or treatments with
sucrose or the plant hormone ABA. In addition, our gene
trap studies of a limited number of R gene related
sequences demonstrated the induction of the expression
of one TIR-NBS-encoding gene, At1g72910, by the SA
homolog, BTH. A previous transcript profiling experiment
GUS quantitative assays of enhancer trap lines with inser-tions into two NBS-LRR-encoding and one related geneFigure 4
GUS quantitative assays of enhancer trap lines with
insertions into two NBS-LRR-encoding and one
related gene. GUS expression levels of each enhancer trap
line untreated or five days after application of JA or BTH.
Treatments with ethanol (EtOH) or BTH carrier (carrier)
were used as controls. Average GUS expression levels and
standard deviations were based on three biological repli-
cates. The background levels of GUS activity in untreated
Col-0 plants were below 20 pmol 4-MU/μg protein/min.
0
100
200
300
400
500
600
700
800
ET6374 SET6003 ET1927
Enhancer trap line
GUS activity (pmol 4-MU/ȝg protein/min)
untreated
EtOH
JA
carrier
BTH
BMC Plant Biology 2007, 7:56 />Page 12 of 20
(page number not for citation purposes)
in Arabidopsis also revealed the expression of several
NBS-LRR-encoding and related genes was altered during
defense response to cucumber mosaic virus strain Y; the
expression of one TIR-NBS-LRR-encoding gene,
At1g56510, and one TIR-X-encoding gene, At1g65400,
was down-regulated, and that of two other TIR-X-encod-
ing genes, At1g72940 and At1g72920, was induced [95].
These results all provide evidence for regulation of R gene
expression during plant defense response and the induc-
tion of enhanced levels of defense-related surveillance in
response to biotic challenge.
Tissue specificity
An unexpected result from the current study was the fre-
quent tissue-specific expression patterns exhibited by
NBS-LRR-encoding and related genes. Both the MPSS data
and the microarray data demonstrated that many NBS-
LRR-encoding and related genes showed tissue specificity.
Some genes were mainly expressed in aerial parts of
plants, while some genes were specifically expressed in
roots. Others appeared to be developmentally regulated.
These patterns of differential expression suggest either
that NBS-LRR-encoding and related genes function in
resistance to a variety of pathogens that attack different
parts of the plant, or that some NBS-LRR-encoding and
related genes function in different plant biological proc-
esses. Previous to our studies there was little data on the
tissue specificity of known R genes. All of the 14 known
NBS-LRR-encoding R genes or their Col-0 homologs ana-
lyzed in our study exhibited tissue specific gene expres-
sion. Interestingly, the tomato NBS-LRR-encoding R gene,
I-2, is expressed at the site of lateral root formation indi-
cating that it might have a role in lateral root initiation in
addition to disease resistance [38].
Alternative transcripts
Alternative splicing was detected for several NBS-LRR-
encoding genes. Twelve NBS-LRR-encoding genes showed
evidence of alternative splicing based on the locations of
MPSS tags and four of these genes, including the Col-0
homologs of two known R genes, RPP5 and RPP4, were
confirmed by RACE-PCR and subsequent sequencing. The
alternative transcripts of two genes (At1g63750 and
At4g16860) encode truncated proteins containing only
the majority of TIR domain and lacking both the NBS and
LRR domains. The alternative transcript of At5g46270
encodes a truncated protein lacking most of the LRR
domain, while alternative transcripts of At4g16950
encode TIR-NBS-LRR proteins with only the last few
amino acids altered. The alternative splicing in At1g10920
and At1g72860 which was revealed by RACE-PCR occurs
in the 5' or 3'UTR and therefore does not change the
amino acid sequence; however, such alternative splicing
could affect transcript stability and therefore the expres-
sion level. Alternative splicing has been reported for seven
known TIR-NBS-LRR-encoding R genes and one CC-NBS-
LRR-encoding R gene [46,49-55]. Based on alignments of
genomic sequences with full-length cDNA and EST
sequences, 1186 Arabidopsis genes in the TIGR database
[96] have been annotated as undergoing splicing variation
and have been classified into five different types of splic-
ing variants. Although ten NBS-LRR-encoding or related
genes are included in these 1186 genes, only one gene was
identified as exhibiting alternative splicing by MPSS or
RACE analysis in our studies. A recent extensive computa-
tional analysis [97] identified alternative splicing events
in 4707 Arabidopsis genes including 16 NBS-LRR-encod-
ing and related genes. Seven out of these 16 genes were
also identified in TIGR database; however, only two out of
these 16 genes were also detected as showing alternative
splicing by MPSS or RACE analysis in our studies. This
inconsistency may be due to RACE and MPSS tending to
analyze sequences at the ends of transcript or due to the
lack of sampling the appropriate tissues or conditions.
Together, these data indicate that at least 22 TIR-NBS-LRR-
encoding, one TIR-NBS-encoding, one divergent NBS-
LRR-encoding, and eight CC-NBS-LRR-encoding genes
exhibit alternative splicing in Arabidopsis.
The role of alternative splicing in plant R genes is unclear.
The splice variants might interact with the full length R
protein and have a regulatory role in disease resistance as
has been suggested for the tobacco N and Arabidopsis
RPS4 genes. This is similar to the role of alternative splic-
ing in animal toll-like receptor (TLRs) [98]. The alterna-
tive transcript of the tobacco N gene is induced by
challenge with tobacco mosaic virus and the ratio of the
two transcripts appears to be critical for resistance [50,99].
The presence of both full-length and alternative tran-
scripts of Arabidopsis RPS4 is necessary for the RPS4-
mediated defense response [52,100]. However, the alter-
native transcripts of flax L6 and tomato Bs4 seem not to be
important for the resistance that these genes mediate
[49,54].
One of the TIR-NBS-encoding genes, At1g72910, may
function in plant defense response as indicated by the
induction of its expression by a SA analog, BTH. Similarly,
six TIR-NBS-encoding genes, At1g17610, At1g66090,
At1g72890, At1g72900, At1g72950, and At3g04210, may
also function in plant defense response since their expres-
sion was affected by SA treatment in at least one of the
seven Arabidopsis ecotypes studied. Two TIR-NBS-encod-
ing genes, At1g72900 and At1g72940, may function in
plant basal defense response since their expression was
induced by flagellin. In the Arabidopsis Col-0 genome,
there are 21 TIR-NBS-encoding genes that have similar
structures as the alternative transcripts of the tobacco N,
flax L6 or Arabidopsis RPS4 genes [9]. These might func-
BMC Plant Biology 2007, 7:56 />Page 13 of 20
(page number not for citation purposes)
tion similarly to the alternatively transcribed variants of
TIR-NBS-LRR-encoding genes.
Post-transcriptional regulation
R genes do not need to be induced at the transcriptional
level in order to alter resistance against pathogens. There
are likely to be multiple levels of negative regulation to
prevent the inappropriate activation of R proteins in the
absence of pathogen that would be deleterious to plants
due to the high cost of the defense response and patho-
gen-independent cell death. There may also be feedback
loops controlling the R gene expression and the extent of
HR.
Our study analyzed steady state mRNA levels, which may
not reflect protein abundance. Further work is required to
identify whether there are differences in the polysomal
fraction and what post-translational modifications occur.
The expression of several R genes has been reported to be
regulated at the post-transcriptional level. The transcript
of Arabidopsis RPM1 remains at a low level before and
after pathogen attack; however, the RPM1 protein is
degraded during HR [101]. The expression of Xa21 gene
transcript is independent of plant developmental stage,
though the Xa21-conferred resistance is developmentally
regulated [102].
Data from animal systems have demonstrated the
involvement of the 5'UTR in controlling translation and
tissue specific expression [103,104]. Several plant R genes
contain introns and/or upstream open reading frames
(uORFs) in their 5'UTR including barley Mla6 and Arabi-
dopsis RPP1-WsB and RPP1-WsC [19,105]. Our RACE
analysis revealed that fifteen out of the 81 NBS-LRR-
encoding and related genes analyzed contained introns in
their 5' or 3' UTRs. These 5'UTR features may be indicative
of post-transcriptional regulation of these genes.
Conclusion
Transcripts of most NBS-LRR-encoding and related genes
analyzed were present at low levels in unchallenged
plants. Many showed tissue specific expression patterns.
Transcript levels of the majority of NBS-LRR-encoding
and related genes were not altered during the plant
defense response or by treatments with plant defense sig-
naling molecules; however, the expression of several
genes was altered and may be indicative of altered levels
of surveillance by the plant. Our data are consistent with
the primary function of the majority of NBS-LRR-encod-
ing and related genes being plant resistance; however, this
does not preclude their involvement in functions other
than pathogen recognition.
Future studies on the significance of tissue specificity, the
roles of alternative transcripts and the relationship
between transcript and protein levels will likely be
informative as will the characterization of the spectrum of
genes induced downstream of each major clade of NBS-
LRR-encoding genes.
Methods
Expressed Sequence Tag (EST) analysis
EST representation for each Arabidopsis NBS-LRR-encod-
ing or related gene was obtained by searching the NCBI
EST database using the predicted cDNA sequence or
genomic sequence (plus 500 bp upstream and down-
stream of the predicted start and stop codons) of each
NBS-LRR-encoding or related gene [7] using BLAST [106].
As of July 14
th
, 2006, this database contained a total of
622,792 Arabidopsis EST sequences including: short, sin-
gle read cDNA sequences, cDNA sequences from differen-
tial display experiments and RACE analyses, and cDNA
sequences from full-length cDNA clones from RIKEN
(The Institute of Physical and Chemical Research, Japan)
[107]. All Arabidopsis ESTs with matches of greater than
80% identity to NBS-LRR-encoding and related genes
were investigated. EST representation was determined
based on the alignment between ESTs and the genomic or
cDNA sequence of the corresponding gene and usually
showed > 97% sequence similarity. Each potential repre-
sentative EST was compared against the complete Arabi-
dopsis genomic and spliced sequences using TAIR BLAST
tool [108] to confirm that it was the best match to the rep-
resented gene. The ESTs showing best match to a specific
NBS-LRR-encoding or related gene but with sequence
identity less than 97% due to obvious sequencing difficul-
ties were also counted. The ESTs that showed the same
level of sequence similarity to several closely related fam-
ily members were counted for each represented gene. A
similar analysis was also performed earlier in April 2002
except that FASTA [109] was used to search for sequence
similarity. The NCBI EST database contained about
181,406 Arabidopsis sequences at that time.
Massively Parallel Signature Sequencing (MPSS) data
MPSS provides a comprehensive assessment of gene
expression by generating short sequence tags, each 17 to
20 bp long, produced from a defined position (usually the
first Sau3A restriction site 5' to the polyadenylation site of
a transcript) within each transcript [67,68]. The expres-
sion level of each gene in a sample is determined by
counting the number of diagnostic sequence tags repre-
senting the transcript of a particular gene.
The DuPont MPSS database contained expression profiles
generated from 22 Arabidopsis MPSS libraries. Half were
constructed from Arabidopsis ecotype Columbia (Col-0)
or Landsberg erecta (Ler) tissues collected at different
developmental stages and half were constructed from wild
type or mutant Col-0 or Ler ecotype plants treated with
BMC Plant Biology 2007, 7:56 />Page 14 of 20
(page number not for citation purposes)
various chemicals or hormones including abscisic acid
(ABA), dexamethasone (DEX), or sucrose (Table 3). Each
library contained approximately one million 17 bp tags.
Seventeen additional MPSS libraries were made from var-
ious Arabidopsis Col-0 tissues (callus, flower, leaf, silique,
and root from wild-type or flowering mutants) or salicylic
acid (SA) treated leaf tissues and displayed in the public
MPSS database (Table 4, [74-76]). Each of these public
libraries contained about two and half million 17 bp tags.
For the analysis of the DuPont MPSS data, searches were
performed using the genomic sequence for each NBS-LRR-
encoding or related gene plus 500 bp upstream and down-
stream of the predicted start and stop codons. In a few
cases the additional flanking sequence overlapped adja-
cent genes with small intergenic regions; however, these
were manually checked and did not contain expressed
tags that could have biased the analysis. Each expressed
tag was also compared against the complete Arabidopsis
genomic and spliced sequences using TAIR BLAST tool
[108] to confirm the correct match to the designated gene;
only matches to the sense strand were used in the calcula-
tions of transcript abundance. The frequency of each tag
was counted and then normalized in parts per million
(PPM) to calculate the abundance of each transcript in the
sample. The PPM values were adjusted (adjPPM) to
account for potential sequencing errors (described in [9]).
The possible alternative polyadenylations caused by alter-
native splicing and variable stop codons were predicted
based on the tag location. For the Arabidopsis MPSS data
generated by Meyers et al. [75,76], a basic query was per-
formed for each gene based on gene "At" number (gene
identifier) against the 17 MPSS libraries. To allow com-
parisons among libraries, the signature frequencies were
normalized to transcripts per million (TPM). For genes
associated with multiple expressed signatures, the sum of
abundance for all expressed signatures, including the sig-
natures with more than one hit to the Arabidopsis
genome, was used to indicate the abundance of each tran-
script in the sample.
In order to investigate potential correlations between gene
expression and phylogenetic position, the expression level
and tissue specificity of each NBS-LRR-encoding or related
gene was compared with the phylogenetic tree described
previously [7]. To investigate potential correlations
between gene expression pattern and chromosomal loca-
tion, these NBS-LRR-encoding and related genes were
sorted by their gene identifiers, which usually reflects their
chromosomal locations, and then the expression pattern
of NBS-LRR-encoding and related genes was visually com-
pared to their locations on this sorted gene list.
Microarray analysis
Concurrent global expression experiments using ATH1
Affymetrix arrays provided the opportunity to assess the
expression patterns of NBS-LRR-encoding and related
genes.
The experiment analyzing the response to applications of
salicylic acid (SA) was described in [79]. Six-week old
plants from seven Arabidopsis thaliana accessions (Col-0,
Cvi-1, Est, Kin-0, Mt-0, Tsu-1, and Van-0) were sprayed
with 0.3 mM SA in 0.02% Silwet L77. Plants treated with
0.02% Silwet L77 were used as controls. The aerial parts of
the plants were harvested 4, 28 or 52 hours later. Each
treatment and time-point was replicated three times. Gene
expression levels were assayed using the Affymetrix ATH1
GeneChips. The ATH1 array contains approximately
22,000 genes including 152 probe sets representing 162
NBS-LRR-encoding and related genes based on Affymetrix
annotation [110]. Raw data (CEL files) were imported
into GeneChip
®
Operating Software data base (GCOS).
Transcript abundances for all probe sets on the Affymetrix
ATH1 GeneChips array were analyzed using GCOS. GCOS
was also used to assess the presence or absence of a given
transcript (P, present; A, absent; M, marginal) for each
probe set. To allow direct comparison between chips, raw
signals were globally scaled so that the mean expression
level of each array was equal to an arbitrary target intensity
of 500. The scaled signals were then imported into Excel
for further analysis.
Raw array data (CEL files) of another experiment [78]
studying flagellin treated Arabidopsis plants were
obtained from ArrayExpress [111]. In this experiment, the
Ler accession of Arabidopsis seedlings were treated with
10 μM flg22 peptide and plantlets analyzed 30 minutes
after treatment. GCOS was used to extract the expression
signal and assign a present or absent call for each gene rep-
resented by a probe set on the ATH1 array. The data was
processed in the same manner as for the SA induction
experiment: raw signals were globally scaled to a target
intensity of 500 for direct comparison.
Microarray analysis was also performed on the same five
total RNA samples used for generating five of the 17 pub-
lic MPSS libraries. Gene expression levels were also
assayed using the ATH1 arrays. Complementary RNA
labeling, hybridization, and signal acquisition were per-
formed according to the manufacturer's guidelines
(Affymetrix, Santa Clara, CA). Affymetrix Microarray Suite
version 5.0 (MAS 5.0) was used to control washing, scan-
ning and data-preprocessing steps. Raw CEL files were
then imported into GCOS and GCOS was used to extract
the expression signals and assign a present or absent call.
To allow direct comparison across chips, raw signals were
globally scaled to a target intensity of 500.
BMC Plant Biology 2007, 7:56 />Page 15 of 20
(page number not for citation purposes)
All data analysis was subsequently performed using Gene-
Spring GX 7.3.1 software (Agilent Technologies, Santa
Clara, CA). The raw output signals from GCOS, without
scaling and normalization, were used as input for analysis
in GeneSpring GX. The raw signals were first normalized
using the 50th percentile of all measurements on a given
chip and then the median measurement of each gene was
adjusted to 1. In order to identify differentially expressed
genes in response to SA or flagellin, a list of probe sets
showing reliable and detectable expression was first estab-
lished using several criteria. Probe sets were retained if
they were called as present or marginal by GCOS in both
replicates (or two out of three replicates) of at least one of
the two comparison conditions, their coefficient of varia-
tion (CV) were less than 0.3 in at least one of the two com-
parison conditions, and they exhibited at least two fold
changes. Starting from this list of genes, the genes exhibit-
ing a significant expression change in a given treatment
were identified as those genes passing the parametric test
(Welch t-test) in GeneSpring GX, without assuming equal
variances and with multiple testing correction (Benjamini
and Hochberg False Discovery Rate), and a P-value thresh-
old of 0.1. The log-transformed normalized signals were
used when performing these parametric tests.
The expression level polymorphism between seven Arabi-
dopsis accessions for each NBS-LRR-encoding gene was
determined using ELP Finder tool [112]. Affymetrix ATH1
GeneChip probeset IDs were entered as query and the
average expression value for each gene in a given accession
with the standard error was returned. The results of pair-
wise t-tests between the accessions selected were also
returned.
The possible correlation between MPSS and microarray
data was analyzed using Spearman rank correlation test
conducted in SAS9.1 (SAS Institute, Cary, NC). The MPSS
and microarray data analyzed using this test was gener-
ated from the same leaf sample and only the 88 NBS-LRR-
encoding and related genes that had unique representa-
tive Affymetrix probe sets and MPSS sequence tags were
included.
Plant materials and growth conditions
Arabidopsis Col-0 plants used for Rapid Amplification of
cDNA ends (RACE) analysis were grown in soil (Premier
Pro-Mix B mix) in controlled-environment chambers at
21°C with 50% humidity, on a 16 hr light/8 hr dark cycle,
and under 100 to 120 μEi illumination.
The gene trap and enhancer trap lines (Landsberg erecta
(Ler) background) were obtained from Cold Spring Har-
bor Laboratory (CSHL) or Singapore Institute of Molecu-
lar Agrobiology (IMA) [85,86]. The seedlings from each
gene trap line were first selected on 1/2 MS medium agar
plates with 50 μg/ml kanamycin and then the surviving
seedlings were transferred to soil. These plants were grown
in controlled-environment chambers with the same con-
ditions as above.
Analysis of gene trap lines
The gene traps lines carried the β-glucuronidase (uidA)
reporter gene at sequence-characterized positions [81-84].
The genomic sequences of 207 NBS-LRR-encoding and
related genes were searched against the flanking sequence
databases of Gene Trap lines generated at Cold Spring
Harbor Laboratory (CSHL) [85] and Ds insertion lines
generated at Singapore Institute of Molecular Agrobiology
(IMA) [86] using BLAST [106]. For each trap line, tissue
PCR [113] was performed to confirm the insertion site
and determine the orientation of the inserted element by
using a gene-specific primer and a uidA specific primer.
To study the induction of NBS-LRR-encoding gene expres-
sion, jasmonic acid (JA; 500 μM) was dissolved in 10% v/
v ethanol and sprayed onto five-week old plants in sterile
containers. Benzothiadiazole (BTH; 1.2 mM) was dis-
solved in water with a wettable powder carrier (same
amount of carrier as BTH) and similarly sprayed onto the
five-week old plants in sterile containers. Treatments with
10% v/v ethanol or the wettable powder carrier were used
as controls for each experiment. Whole plants were col-
lected at different time points from 0, 24, and 48 hrs, to 5
days after each treatment and then subjected to GUS his-
tochemical staining and GUS activity assays. Each gene
trap plant was also challenged with P. syringae pv. tomato
strain DC3000 carrying avrRpt2 or avrRpm1 which caused
a hypersensitive response (HR) in wild-type Col-0 and Ler
plants. The HR response was examined at 16 hours, 1 day
and 2 days after pathogen infiltration and GUS staining
was performed at the same time.
Histochemical staining for GUS activity was performed
according to a slightly modified protocol from [114,115].
Plant tissues were immersed in the GUS staining solution
(100 mM sodium phosphate (pH7.0), 2 mM K
3
Fe(CN)
6
,
2 mM K
4
Fe(CN)
6
, 10 mM EDTA, 0.1% (v/v) Triton X-100,
100 μg/ml chloramphenicol, with 1 mg/ml 5-bromo-4-
chloro-3-indolyl-β-D-glucuronide cyclohexylammonium
salt (X-gluc, Gold Biotechnology Inc., St. Louis, MO,
U.S.A.). The plant tissues were incubated with GUS stain-
ing solutions at 37°C for 24 hrs.
GUS activity was quantified fluorometrically using 4-
methylumbelliferone glucuronide (MUG, Sigma) as a
substrate as described by Jefferson et al[114]. Reactions
were performed in 200 μl of extraction buffer (50 mM
NaPO
4
pH7, 10 mM EDTA, 0.1% Triton X-100, 0.1%
Sodium Lauryl Sarcosine, 10 mM β-mercaptoethanol)
containing 1.1 mM MUG and stopped after 1 h incuba-
BMC Plant Biology 2007, 7:56 />Page 16 of 20
(page number not for citation purposes)
tion at 37°C by addition of 800 μl 0.2 M Na
2
CO
3
. The flu-
orescence was calibrated using 4-methylumbelliferone
(MU, Sigma, St. Louis, MO, USA). Total protein was deter-
mined using Bradford reagents and BSA as a standard
[116].
Rapid Amplification of cDNA Ends (RACE)-PCR
RACE-PCR was performed with the Marathon™ cDNA
Amplification Kit (Clontech, Mountain View, CA, USA)
according to the manufacturer's instructions. Total RNA
was extracted from the leaves of about four-week old wild-
type Arabidopsis Col-0 plants, seven-day old seedlings, or
flower tissues using the TRIzol procedure (Invitrogen,
Carlsbad, CA). Template mRNA was then purified from
total RNA using Dynabeads
®
Oligo (dT)
25
(Dynal Biotech,
Lake Success, NY, USA). RACE-PCR products were cloned
into the pCR
®
2.1-TOPO
®
vector (Invitrogen, Carlsbad,
CA) and sequenced. Sequence data were analyzed using
BLAST and Sequencer 3.1 (GeneCodes, Ann Arbor, MI).
All RACE sequences were deposited into NCBI GenBank
under accession numbers from ES444179
to ES444640
and from EX654484 to EX654486.
Reverse Transcription-PCR (RT-PCR)
RT-PCR was carried out using Advantage™ RT-for-PCR Kit
(Clontech, Mountain View, CA) according to the manu-
facturer's instructions. Primers were designed to amplify
regions containing an intron in order to distinguish
genomic DNA contamination from gene transcripts.
Authors' contributions
XT conducted the majority of the experiments, analyzed
the data and drafted the paper. BCM assisted in the exper-
imental design, data analysis and writing. AK provided
bioinformatics support for analysis of EST and genomic
Arabidopsis sequences and data visualization. MALW and
DAStC contributed the microarray experiments on the
Arabidopsis accessions and the SA treatment as well as
assisted in data interpretation. MM contributed MPSS
data. AFB contributed to the experimental design and
writing. RWM contributed to the overall experimental
design, data interpretation, and writing of the paper.
Additional material
Acknowledgements
We thank Dean Lavelle for technical assistance and Huaqin Xu for bioinfor-
matics support as well as Belinda Martineau for editorial assistance. This
work was supported by NSF Plant Genome Program award # 9975971 to
R.W.M., A.F.B. et al. and utilized microarray data generated by NSF 2010
Program award # 0115109 to D.A.St C., R.W.M. et al., and MPSS data gen-
erated by NSF Plant Genome Research award #0110528 to B.C.M.
References
1. Hammond-Kosack KE, Jones JD: Plant Disease Resistance Genes.
Annu Rev Plant Physiol Plant Mol Biol 1997, 48:575-607.
2. Dangl JL, Jones JD: Plant pathogens and integrated defence
responses to infection. Nature 2001, 411(6839):826-833.
3. Staskawicz BJ, Mudgett MB, Dangl JL, Galan JE: Common and con-
trasting themes of plant and animal diseases. Science 2001,
292(5525):2285-2289.
4. Martin GB, Bogdanove AJ, Sessa G: Understanding the functions
of plant disease resistance proteins. Annual review of plant biology
2003, 54:23-61.
5. Meyers BC, Dickerman AW, Michelmore RW, Sivaramakrishnan S,
Sobral BW, Young ND: Plant disease resistance genes encode
members of an ancient and diverse protein family within the
nucleotide-binding superfamily. Plant J 1999, 20(3):317-332.
6. Pan Q, Wendel J, Fluhr R: Divergent evolution of plant NBS-
LRR resistance gene homologues in dicot and cereal
genomes. Journal of molecular evolution 2000, 50(3):203-213.
7. Meyers BC, Kozik A, Griego A, Kuang H, Michelmore RW:
Genome-wide analysis of NBS-LRR-encoding genes in Arabi-
dopsis. The Plant cell 2003, 15(4):809-834.
8. McHale L, Tan X, Koehl P, Michelmore RW: Plant NBS-LRR pro-
teins: adaptable guards. Genome biology 2006, 7(4):212.
9. Meyers BC, Morgante M, Michelmore RW: TIR-X and TIR-NBS
proteins: two new families related to disease resistance TIR-
NBS-LRR proteins encoded in Arabidopsis and other plant
genomes. Plant J 2002, 32(1):77-92.
10. Richly E, Kurth J, Leister D: Mode of amplification and reorgan-
ization of resistance genes during recent Arabidopsis thal-
iana evolution. Mol Biol Evol 2002, 19(1):76-84.
11. Monosi B, Wisser RJ, Pennill L, Hulbert SH: Full-genome analysis
of resistance gene homologues in rice. Theor Appl Genet 2004,
109(7):1434-1447.
12. Van der Biezen EA, Jones JD:
Plant disease-resistance proteins
and the gene-for-gene concept. Trends in biochemical sciences
1998, 23(12):454-456.
13. Innes RW: Guarding the goods. New insights into the central
alarm system of plants. Plant physiology 2004, 135(2):695-701.
14. Dodds PN, Lawrence GJ, Catanzariti AM, Teh T, Wang CI, Ayliffe
MA, Kobe B, Ellis JG: Direct protein interaction underlies gene-
for-gene specificity and coevolution of the flax resistance
genes and flax rust avirulence genes. Proceedings of the National
Academy of Sciences of the United States of America 2006,
103(23):8888-8893.
Additional file 1
Detailed summary of expression analyses of NBS-LRR-encoding and
related genes. Worksheet 1A provides the data structure of worksheet 1B
and 1C. Worksheet 1B provides full expression data of CC-NBS-LRR-
encoding and related genes. Worksheet 1C provides full expression data of
TIR-NBS-LRR-encoding and related genes. Data is also available online
[73].
Click here for file
[ />2229-7-56-S1.xls]
Additional file 2
The 38 NBS-LRR-encoding and related genes showing altered expression
in at least one of three time points (4, 28, or 52 hrs) post treatment with
salicylic acid in multiple accessions of Arabidopsis or following treatment
with flagellin in wild-type Ler (raw data from [79] and [78], respec-
tively). Fold change values are presented for each treatment x control com-
parison. Red indicates statistically significant up-regulation; blue
indicates statistically significant down-regulation. Columns 5 – 13 display
data from different ecotypes treated with SA. Column 14 contains data
from Ler treated with flagellin. NBS-LRR-encoding and related genes that
did not show statistically significant changes are not shown.
Click here for file
[ />2229-7-56-S2.xls]
BMC Plant Biology 2007, 7:56 />Page 17 of 20
(page number not for citation purposes)
15. Jones JD, Dangl JL: The plant immune system. Nature 2006,
444(7117):323-329.
16. Shen QH, Saijo Y, Mauch S, Biskup C, Bieri S, Keller B, Seki H, Ulker
B, Somssich IE, Schulze-Lefert P: Nuclear activity of MLA
immune receptors links isolate-specific and basal disease-
resistance responses. Science 2007, 315(5815):1098-1103.
17. Parniske M, Hammond-Kosack KE, Golstein C, Thomas CM, Jones
DA, Harrison K, Wulff BB, Jones JD: Novel disease resistance
specificities result from sequence exchange between tan-
demly repeated genes at the Cf-4/9 locus of tomato. Cell
1997, 91(6):821-832.
18. Thomas CM, Jones DA, Parniske M, Harrison K, Balint-Kurti PJ, Hatz-
ixanthis K, Jones JD: Characterization of the tomato Cf-4 gene
for resistance to Cladosporium fulvum identifies sequences
that determine recognitional specificity in Cf-4 and Cf-9. The
Plant cell 1997, 9(12):2209-2224.
19. Botella MA, Parker JE, Frost LN, Bittner-Eddy PD, Beynon JL, Daniels
MJ, Holub EB, Jones JD: Three genes of the Arabidopsis RPP1
complex resistance locus recognize distinct Peronospora
parasitica avirulence determinants. The Plant cell 1998,
10(11):1847-1860.
20. McDowell JM, Dhandaydham M, Long TA, Aarts MG, Goff S, Holub
EB, Dangl JL: Intragenic recombination and diversifying selec-
tion contribute to the evolution of downy mildew resistance
at the RPP8 locus of Arabidopsis. The Plant cell 1998,
10(11):1861-1874.
21. Meyers BC, Shen KA, Rohani P, Gaut BS, Michelmore RW: Recep-
tor-like genes in the major resistance locus of lettuce are
subject to divergent selection. The Plant cell 1998,
10(11):1833-1846.
22. Wang GL, Ruan DL, Song WY, Sideris S, Chen L, Pi LY, Zhang S,
Zhang Z, Fauquet C, Gaut BS, Whalen MC, Ronald PC: Xa21D
encodes a receptor-like molecule with a leucine-rich repeat
domain that determines race-specific recognition and is sub-
ject to adaptive evolution. The Plant cell 1998, 10(5):765-779.
23. Ellis JG, Lawrence GJ, Luck JE, Dodds PN: Identification of regions
in alleles of the flax rust resistance gene L that determine dif-
ferences in gene-for-gene specificity.
The Plant cell 1999,
11(3):495-506.
24. Noel L, Moores TL, van Der Biezen EA, Parniske M, Daniels MJ,
Parker JE, Jones JD: Pronounced intraspecific haplotype diver-
gence at the RPP5 complex disease resistance locus of Ara-
bidopsis. The Plant cell 1999, 11(11):2099-2112.
25. Dodds PN, Lawrence GJ, Ellis JG: Six amino acid changes con-
fined to the leucine-rich repeat beta-strand/beta-turn motif
determine the difference between the P and P2 rust resist-
ance specificities in flax. The Plant cell 2001, 13(1):163-178.
26. Wulff BB, Thomas CM, Smoker M, Grant M, Jones JD: Domain
swapping and gene shuffling identify sequences required for
induction of an Avr-dependent hypersensitive response by
the tomato Cf-4 and Cf-9 proteins. The Plant cell 2001,
13(2):255-272.
27. Hwang CF, Williamson VM: Leucine-rich repeat-mediated
intramolecular interactions in nematode recognition and
cell death signaling by the tomato resistance protein Mi.
Plant J 2003, 34(5):585-593.
28. Luck JE, Lawrence GJ, Dodds PN, Shepherd KW, Ellis JG: Regions
outside of the leucine-rich repeats of flax rust resistance pro-
teins play a role in specificity determination. The Plant cell
2000, 12(8):1367-1377.
29. Warren RF, Henk A, Mowery P, Holub E, Innes RW: A mutation
within the leucine-rich repeat domain of the Arabidopsis dis-
ease resistance gene RPS5 partially suppresses multiple bac-
terial and downy mildew resistance genes. The Plant cell 1998,
10(9):1439-1452.
30. Moffett P, Farnham G, Peart J, Baulcombe DC: Interaction
between domains of a plant NBS-LRR protein in disease
resistance-related cell death. The EMBO journal 2002,
21(17):4511-4519.
31. Belkhadir Y, Subramaniam R, Dangl JL: Plant disease resistance
protein signaling: NBS-LRR proteins and their partners. Cur-
rent opinion in plant biology 2004, 7(4):391-399.
32. Jones DA, Takemoto D: Plant innate immunity - direct and indi-
rect recognition of general and specific pathogen-associated
molecules. Current opinion in immunology 2004, 16(1):48-62.
33. van der Biezen EA, Jones JD:
The NB-ARC domain: a novel sig-
nalling motif shared by plant resistance gene products and
regulators of cell death in animals. Curr Biol 1998, 8(7):R226-7.
34. Tameling WI, Elzinga SD, Darmin PS, Vossen JH, Takken FL, Haring
MA, Cornelissen BJ: The tomato R gene products I-2 and MI-1
are functional ATP binding proteins with ATPase activity.
The Plant cell 2002, 14(11):2929-2939.
35. Tameling WI, Vossen JH, Albrecht M, Lengauer T, Berden JA, Haring
MA, Cornelissen BJ, Takken FL: Mutations in the NB-ARC
domain of I-2 that impair ATP hydrolysis cause autoactiva-
tion. Plant physiology 2006, 140(4):1233-1245.
36. Faigon-Soverna A, Harmon FG, Storani L, Karayekov E, Staneloni RJ,
Gassmann W, Mas P, Casal JJ, Kay SA, Yanovsky MJ: A constitutive
shade-avoidance mutant implicates TIR-NBS-LRR proteins
in Arabidopsis photomorphogenic development. The Plant cell
2006, 18(11):2919-2928.
37. Moutinho A, Hussey PJ, Trewavas AJ, Malho R: cAMP acts as a sec-
ond messenger in pollen tube growth and reorientation. Pro-
ceedings of the National Academy of Sciences of the United States of
America 2001, 98(18):10481-10486.
38. Mes JJ, van Doorn AA, Wijbrandi J, Simons G, Cornelissen BJ, Haring
MA: Expression of the Fusarium resistance gene I-2 colocal-
izes with the site of fungal containment. Plant J 2000,
23(2):183-193.
39. Clark SE, Williams RW, Meyerowitz EM: The CLAVATA1 gene
encodes a putative receptor kinase that controls shoot and
floral meristem size in Arabidopsis. Cell 1997, 89(4):575-585.
40. Li J, Chory J: A putative leucine-rich repeat receptor kinase
involved in brassinosteroid signal transduction. Cell 1997,
90(5):929-938.
41. Jeong S, Trotochaud AE, Clark SE: The Arabidopsis CLAVATA2
gene encodes a receptor-like protein required for the stabil-
ity of the CLAVATA1 receptor-like kinase. The Plant cell 1999,
11(10):1925-1934.
42. Wang ZY, Seto H, Fujioka S, Yoshida S, Chory J: BRI1 is a critical
component of a plasma-membrane receptor for plant ster-
oids.
Nature 2001, 410(6826):380-383.
43. Grant MR, Godiard L, Straube E, Ashfield T, Lewald J, Sattler A, Innes
RW, Dangl JL: Structure of the Arabidopsis RPM1 gene ena-
bling dual specificity disease resistance. Science 1995,
269(5225):843-846.
44. Dixon MS, Jones DA, Keddie JS, Thomas CM, Harrison K, Jones JD:
The tomato Cf-2 disease resistance locus comprises two
functional genes encoding leucine-rich repeat proteins. Cell
1996, 84(3):451-459.
45. Salmeron JM, Oldroyd GE, Rommens CM, Scofield SR, Kim HS, Lav-
elle DT, Dahlbeck D, Staskawicz BJ: Tomato Prf is a member of
the leucine-rich repeat class of plant disease resistance genes
and lies embedded within the Pto kinase gene cluster. Cell
1996, 86(1):123-133.
46. Parker JE, Coleman MJ, Szabo V, Frost LN, Schmidt R, van der Biezen
EA, Moores T, Dean C, Daniels MJ, Jones JD: The Arabidopsis
downy mildew resistance gene RPP5 shares similarity to the
toll and interleukin-1 receptors with N and L6. The Plant cell
1997, 9(6):879-894.
47. Milligan SB, Bodeau J, Yaghoobi J, Kaloshian I, Zabel P, Williamson VM:
The root knot nematode resistance gene Mi from tomato is
a member of the leucine zipper, nucleotide binding, leucine-
rich repeat family of plant genes. The Plant cell 1998,
10(8):1307-1319.
48. Shen KA, Chin DB, Arroyo-Garcia R, Ochoa OE, Lavelle DO, Wrob-
lewski T, Meyers BC, Michelmore RW: Dm3 is one member of a
large constitutively expressed family of nucleotide binding
site-leucine-rich repeat encoding genes. Mol Plant Microbe Inter-
act 2002, 15(3):251-261.
49. Ayliffe MA, Frost DV, Finnegan EJ, Lawrence GJ, Anderson PA, Ellis
JG: Analysis of alternative transcripts of the flax L6 rust
resistance gene. Plant J 1999, 17(3):287-292.
50. Marathe R, Anandalakshmi R, Liu Y, Dinesh-Kumar SP: The tobacco
mosaic virus resistance gene, N. Mol Plant Pathol 2002,
3(3):167-172.
51. Anderson PA, Lawrence GJ, Morrish BC, Ayliffe MA, Finnegan EJ, Ellis
JG: Inactivation of the flax rust resistance gene M associated
with loss of a repeated unit within the leucine-rich repeat
coding region. The Plant cell 1997,
9(4):641-651.
BMC Plant Biology 2007, 7:56 />Page 18 of 20
(page number not for citation purposes)
52. Zhang XC, Gassmann W: RPS4-mediated disease resistance
requires the combined presence of RPS4 transcripts with
full-length and truncated open reading frames. The Plant cell
2003, 15(10):2333-2342.
53. Borhan MH, Holub EB, Beynon JL, Rozwadowski K, Rimmer SR: The
arabidopsis TIR-NB-LRR gene RAC1 confers resistance to
Albugo candida (white rust) and is dependent on EDS1 but
not PAD4. Mol Plant Microbe Interact 2004, 17(7):711-719.
54. Schornack S, Ballvora A, Gurlebeck D, Peart J, Baulcombe D, Ganal
M, Baker B, Bonas U, Lahaye T: The tomato resistance protein
Bs4 is a predicted non-nuclear TIR-NB-LRR protein that
mediates defense responses to severely truncated deriva-
tives of AvrBs4 and overexpressed AvrBs3. Plant J 2004,
37(1):46-60.
55. Ferrier-Cana E, Macadre C, Sevignac M, David P, Langin T, Geffroy V:
Distinct post-transcriptional modifications result into seven
alternative transcripts of the CC-NBS-LRR gene JA1tr of
Phaseolus vulgaris. Theor Appl Genet 2005, 110(5):895-905.
56. Cai D, Kleine M, Kifle S, Harloff HJ, Sandal NN, Marcker KA, Klein-
Lankhorst RM, Salentijn EM, Lange W, Stiekema WJ, Wyss U, Grun-
dler FM, Jung C: Positional cloning of a gene for nematode
resistance in sugar beet. Science 1997, 275(5301):832-834.
57. Yoshimura S, Yamanouchi U, Katayose Y, Toki S, Wang ZX, Kono I,
Kurata N, Yano M, Iwata N, Sasaki T: Expression of Xa1, a bacte-
rial blight-resistance gene in rice, is induced by bacterial
inoculation. Proceedings of the National Academy of Sciences of the
United States of America 1998, 95(4):1663-1668.
58. Halterman DA, Wei F, Wise RP: Powdery mildew-induced Mla
mRNAs are alternatively spliced and contain multiple
upstream open reading frames. Plant physiology 2003,
131(2):558-567.
59. Gu K, Yang B, Tian D, Wu L, Wang D, Sreekala C, Yang F, Chu Z,
Wang GL, White FF, Yin Z: R gene expression induced by a type-
III effector triggers disease resistance in rice. Nature 2005,
435(7045):1122-1125.
60. Collins N, Drake J, Ayliffe M, Sun Q, Ellis J, Hulbert S, Pryor T: Molec-
ular characterization of the maize Rp1-D rust resistance
haplotype and its mutants. The Plant cell 1999, 11(7):1365-1376.
61. Wang ZX, Yano M, Yamanouchi U, Iwamoto M, Monna L, Hayasaka
H, Katayose Y, Sasaki T: The Pib gene for rice blast resistance
belongs to the nucleotide binding and leucine-rich repeat
class of plant disease resistance genes. Plant J 1999,
19(1):55-64.
62. Wang ZX, Yamanouchi U, Katayose Y, Sasaki T, Yano M: Expression
of the Pib rice-blast-resistance gene family is up-regulated by
environmental conditions favouring infection and by chemi-
cal signals that trigger secondary plant defences. Plant molec-
ular biology 2001, 47(5):653-661.
63. Donson J, Fang Y, Espiritu-Santo G, Xing W, Salazar A, Miyamoto S,
Armendarez V, Volkmuth W: Comprehensive gene expression
analysis by transcript profiling. Plant molecular biology 2002,
48(1-2):75-97.
64. Pollock JD: Gene expression profiling: methodological chal-
lenges, results, and prospects for addiction research. Chem
Phys Lipids 2002, 121(1-2):241-256.
65. Adams MD, Kerlavage AR, Fleischmann RD, Fuldner RA, Bult CJ, Lee
NH, Kirkness EF, Weinstock KG, Gocayne JD, White O, Sutton G,
Blake JA, Brandon RC, Chiu MW, Clayton RA, Cline RT, Cotton MD,
Earle-Hughes J, Fine LD, FitzGerald LM, FitzHugh WM, Fritchman JL,
Geoghagen NSM, Glodek A, Gnehm CL, Hanna MC, Hedblom E, Hin-
kle Jr. PS, Kelley JM, Klimek KM, et al.: Initial assessment of human
gene diversity and expression patterns based upon 83 million
nucleotides of cDNA sequence. Nature 1995, 377(6547
Suppl):3-174.
66. Velculescu VE, Zhang L, Vogelstein B, Kinzler KW: Serial analysis
of gene expression. Science 1995, 270(5235):484-487.
67. Brenner S, Johnson M, Bridgham J, Golda G, Lloyd DH, Johnson D,
Luo S, McCurdy S, Foy M, Ewan M, Roth R, George D, Eletr S, Albre-
cht G, Vermaas E, Williams SR, Moon K, Burcham T, Pallas M,
DuBridge RB, Kirchner J, Fearon K, Mao J, Corcoran K: Gene
expression analysis by massively parallel signature sequenc-
ing (MPSS) on microbead arrays. Nature biotechnology 2000,
18(6):630-634.
68. Brenner S, Williams SR, Vermaas EH, Storck T, Moon K, McCollum
C, Mao JI, Luo S, Kirchner JJ, Eletr S, DuBridge RB, Burcham T, Albre-
cht G: In vitro cloning of complex mixtures of DNA on
microbeads: physical separation of differentially expressed
cDNAs. Proceedings of the National Academy of Sciences of the United
States of America 2000, 97(4):1665-1670.
69. Rensink WA, Buell CR: Microarray expression profiling
resources for plant genomics. Trends in plant science 2005,
10(12):
603-609.
70. Galbraith DW: DNA microarray analyses in higher plants.
Omics 2006, 10(4):455-473.
71. Armstrong NJ, van de Wiel MA: Microarray data analysis: from
hypotheses to conclusions using gene expression data. Cell
Oncol 2004, 26(5-6):279-290.
72. Clarke JD, Zhu T: Microarray analysis of the transcriptome as
a stepping stone towards understanding biological systems:
practical considerations and perspectives. Plant J 2006,
45(4):630-650.
73. NibLrrs [
]
74. Arabidopsis MPSS database [ />]
75. Meyers BC, Lee DK, Vu TH, Tej SS, Edberg SB, Matvienko M, Tindell
LD: Arabidopsis MPSS. An online resource for quantitative
expression analysis. Plant physiology 2004, 135(2):801-813.
76. Meyers BC, Tej SS, Vu TH, Haudenschild CD, Agrawal V, Edberg SB,
Ghazal H, Decola S: The use of MPSS for whole-genome tran-
scriptional analysis in Arabidopsis. Genome research 2004,
14(8):1641-1653.
77. Meyers BC, Vu TH, Tej SS, Ghazal H, Matvienko M, Agrawal V, Ning
J, Haudenschild CD: Analysis of the transcriptional complexity
of Arabidopsis thaliana by massively parallel signature
sequencing. Nature biotechnology 2004, 22(8):1006-1011.
78. Zipfel C, Robatzek S, Navarro L, Oakeley EJ, Jones JD, Felix G, Boller
T: Bacterial disease resistance in Arabidopsis through flagel-
lin perception. Nature 2004, 428(6984):764-767.
79. Kliebenstein DJ, West MA, van Leeuwen H, Kim K, Doerge RW,
Michelmore RW, St Clair DA: Genomic survey of gene expres-
sion diversity in Arabidopsis thaliana. Genetics 2006,
172(2):1179-1189.
80. ELP [ />]
81. Springer PS, McCombie WR, Sundaresan V, Martienssen RA: Gene
trap tagging of PROLIFERA, an essential MCM2-3-5-like
gene in Arabidopsis. Science 1995, 268(5212):877-880.
82. Sundaresan V, Springer P, Volpe T, Haward S, Jones JD, Dean C, Ma
H, Martienssen R: Patterns of gene action in plant develop-
ment revealed by enhancer trap and gene trap transposable
elements. Genes & development 1995, 9(14):1797-1810.
83. Martienssen RA: Functional genomics: probing plant gene
function and expression with transposons. Proceedings of the
National Academy of Sciences of the United States of America 1998,
95(5):2021-2026.
84. Parinov S, Sevugan M, Ye D, Yang WC, Kumaran M, Sundaresan V:
Analysis of flanking sequences from dissociation insertion
lines: a database for reverse genetics in Arabidopsis. The Plant
cell 1999, 11(12):2263-2270.
85. Arabidopsis Gene Trap Website at Cold Spring Harbor Lab
[ />]
86. Institute of Molecular Agrobiology lines [bidop
sis.org/abrc/ima.jsp]
87. Gu Q, Ferrandiz C, Yanofsky MF, Martienssen R: The FRUITFULL
MADS-box gene mediates cell differentiation during Arabi-
dopsis fruit development. Development (Cambridge, England) 1998,
125(8):1509-1517.
88. Tsugeki R, Olson ML, Fedoroff NV: Transposon tagging and the
study of root development in Arabidopsis. Gravit Space Biol Bull
1998, 11(2):79-87.
89. TAIR [ />]
90. Maleck K, Levine A, Eulgem T, Morgan A, Schmid J, Lawton KA, Dangl
JL, Dietrich RA: The transcriptome of Arabidopsis thaliana
during systemic acquired resistance. Nature genetics 2000,
26(4):403-410.
91. Tao Y, Xie Z, Chen W, Glazebrook J, Chang HS, Han B, Zhu T, Zou
G, Katagiri F: Quantitative nature of Arabidopsis responses
during compatible and incompatible interactions with the
bacterial pathogen Pseudomonas syringae. The Plant cell 2003,
15(2):317-330.
92. Burch-Smith TM, Schiff M, Caplan JL, Tsao J, Czymmek K, Dinesh-
Kumar SP: A Novel Role for the TIR Domain in Association
with Pathogen-Derived Elicitors. PLoS Biol 2007, 5(3):e68.
BMC Plant Biology 2007, 7:56 />Page 19 of 20
(page number not for citation purposes)
93. Peart JR, Mestre P, Lu R, Malcuit I, Baulcombe DC: NRG1, a CC-
NB-LRR protein, together with N, a TIR-NB-LRR protein,
mediates resistance against tobacco mosaic virus. Curr Biol
2005, 15(10):968-973.
94. Gabriels SH, Vossen JH, Ekengren SK, van Ooijen G, Abd-El-Haliem
AM, van den Berg GC, Rainey DY, Martin GB, Takken FL, de Wit PJ,
Joosten MH: An NB-LRR protein required for HR signalling
mediated by both extra- and intracellular resistance pro-
teins. Plant J 2007, 50(1):14-28.
95. Marathe R, Guan Z, Anandalakshmi R, Zhao H, Dinesh-Kumar SP:
Study of Arabidopsis thaliana resistome in response to
cucumber mosaic virus infection using whole genome micro-
array. Plant molecular biology 2004, 55(4):501-520.
96. Arabidopsis splicing variations at TIGR [ />tdb/e2k1/ath1/altsplicing/splicing_variations.shtml]
97. Wang BB, Brendel V: Genomewide comparative analysis of
alternative splicing in plants. Proceedings of the National Academy
of Sciences of the United States of America 2006, 103(18):7175-7180.
98. Jordan T, Schornack S, Lahaye T: Alternative splicing of tran-
scripts encoding Toll-like plant resistance proteins - what's
the functional relevance to innate immunity? Trends in plant sci-
ence 2002, 7(9):392-398.
99. Dinesh-Kumar SP, Baker BJ: Alternatively spliced N resistance
gene transcripts: their possible role in tobacco mosaic virus
resistance. Proceedings of the National Academy of Sciences of the
United States of America 2000, 97(4):1908-1913.
100. Gassmann W, Hinsch ME, Staskawicz BJ: The Arabidopsis RPS4
bacterial-resistance gene is a member of the TIR-NBS-LRR
family of disease-resistance genes. Plant J 1999, 20(3):265-277.
101. Boyes DC, Nam J, Dangl JL: The Arabidopsis thaliana RPM1 dis-
ease resistance gene product is a peripheral plasma mem-
brane protein that is degraded coincident with the
hypersensitive response. Proceedings of the National Academy of Sci-
ences of the United States of America 1998, 95(26):15849-15854.
102. Century KS, Lagman RA, Adkisson M, Morlan J, Tobias R, Schwartz K,
Smith A, Love J, Ronald PC, Whalen MC: Short communication:
developmental control of Xa21-mediated disease resistance
in rice. Plant J 1999, 20(2):231-236.
103. van der Velden AW, Thomas AA: The role of the 5' untranslated
region of an mRNA in translation regulation during develop-
ment. The international journal of biochemistry & cell biology 1999,
31(1):87-106.
104. Willis AE: Translational control of growth factor and proto-
oncogene expression. The international journal of biochemistry & cell
biology 1999, 31(1):73-86.
105. Halterman D, Zhou F, Wei F, Wise RP, Schulze-Lefert P: The MLA6
coiled-coil, NBS-LRR protein confers AvrMla6-dependent
resistance specificity to Blumeria graminis f. sp. hordei in
barley and wheat. Plant J 2001, 25(3):335-348.
106. Altschul SF, Gish W, Miller W, Myers EW, Lipman DJ: Basic local
alignment search tool.
Journal of molecular biology 1990,
215(3):403-410.
107. Seki M, Narusaka M, Kamiya A, Ishida J, Satou M, Sakurai T, Nakajima
M, Enju A, Akiyama K, Oono Y, Muramatsu M, Hayashizaki Y, Kawai
J, Carninci P, Itoh M, Ishii Y, Arakawa T, Shibata K, Shinagawa A, Shi-
nozaki K: Functional annotation of a full-length Arabidopsis
cDNA collection. Science 2002, 296(5565):141-145.
108. TAIR BLAST [ />]
109. Pearson WR, Lipman DJ: Improved tools for biological sequence
comparison. Proceedings of the National Academy of Sciences of the
United States of America 1988, 85(8):2444-2448.
110. Affymetrix [
]
111. Raw array data for flagellin experiment [ />microarray-as/aer/dataselection?expid=295433876]
112. ELP finder [ />parental_survey_ELP_finder.htm]
113. Klimyuk VI, Carroll BJ, Thomas CM, Jones JD: Alkali treatment for
rapid preparation of plant material for reliable PCR analysis.
Plant J 1993, 3(3):493-494.
114. Jefferson RA, Kavanagh TA, Bevan MW: GUS fusions: beta-glu-
curonidase as a sensitive and versatile gene fusion marker in
higher plants. The EMBO journal 1987, 6(13):3901-3907.
115. Toriyama K, Thorsness MK, Nasrallah JB, Nasrallah ME: A Brassica
S locus gene promoter directs sporophytic expression in the
anther tapetum of transgenic Arabidopsis. Developmental biol-
ogy 1991, 143(2):427-431.
116. Bradford MM: A rapid and sensitive method for the quantita-
tion of microgram quantities of protein utilizing the princi-
ple of protein-dye binding. Analytical biochemistry 1976,
72:248-254.
117. Tamaki S, Dahlbeck D, Staskawicz B, Keen NT: Characterization
and expression of two avirulence genes cloned from Pseu-
domonas syringae pv. glycinea. Journal of bacteriology 1988,
170(10):4846-4854.
118. Debener T, Lehnackers H, Arnold M, Dangl JL: Identification and
Molecular Mapping of a Single Arabidopsis-Thaliana Locus
Determining Resistance to a Phytopathogenic Pseu-
domonas-Syringae Isolate. Plant J 1991, 1(3):289-302.
119. Century KS, Holub EB, Staskawicz BJ: NDR1, a locus of Arabidop-
sis thaliana that is required for disease resistance to both a
bacterial and a fungal pathogen. Proceedings of the National Acad-
emy of Sciences of the United States of America 1995,
92(14):6597-6601.
120. Parker JE, Holub EB, Frost LN, Falk A, Gunn ND, Daniels MJ: Char-
acterization of eds1, a mutation in Arabidopsis suppressing
resistance to Peronospora parasitica specified by several dif-
ferent RPP genes. The Plant cell 1996, 8(11):2033-2046.
121. Bent AF, Kunkel BN, Dahlbeck D, Brown KL, Schmidt R, Giraudat J,
Leung J, Staskawicz BJ: RPS2 of Arabidopsis thaliana: a leucine-
rich repeat class of plant disease resistance genes. Science
1994, 265(5180):1856-1860.
122. Mindrinos M, Katagiri F, Yu GL, Ausubel FM: The A. thaliana dis-
ease resistance gene RPS2 encodes a protein containing a
nucleotide-binding site and leucine-rich repeats. Cell 1994,
78(6):1089-1099.
123. Innes RW, Bent AF, Kunkel BN, Bisgrove SR, Staskawicz BJ: Molec-
ular analysis of avirulence gene avrRpt2 and identification of
a putative regulatory sequence common to all known Pseu-
domonas syringae avirulence genes. Journal of bacteriology 1993,
175(15):4859-4869.
124. Whalen MC, Innes RW, Bent AF, Staskawicz BJ: Identification of
Pseudomonas syringae pathogens of Arabidopsis and a bac-
terial locus determining avirulence on both Arabidopsis and
soybean. The Plant cell 1991, 3(1):49-59.
125. Hinsch M, Staskawicz B: Identification of a new Arabidopsis dis-
ease resistance locus, RPs4, and cloning of the corresponding
avirulence gene, avrRps4, from Pseudomonas syringae pv.
pisi. Mol Plant Microbe Interact 1996, 9(1):55-61.
126. Aarts N, Metz M, Holub E, Staskawicz BJ, Daniels MJ, Parker JE: Dif-
ferent requirements for EDS1 and NDR1 by disease resist-
ance genes define at least two R gene-mediated signaling
pathways in Arabidopsis. Proceedings of the National Academy of
Sciences of the United States of America 1998, 95(17):10306-10311.
127. Jenner C, Hitchin E, Mansfield J, Walters K, Betteridge P, Teverson D,
Taylor J: Gene-for-gene interactions between Pseudomonas
syringae pv. phaseolicola and Phaseolus. Mol Plant Microbe Inter-
act 1991, 4(6):553-562.
128. Simonich MT, Innes RW: A disease resistance gene in Arabidop-
sis with specificity for the avrPph3 gene of Pseudomonas
syringae pv. phaseolicola. Mol Plant Microbe Interact 1995,
8(4):637-640.
129. Rehmany AP, Gordon A, Rose LE, Allen RL, Armstrong MR, Whisson
SC, Kamoun S, Tyler BM, Birch PR, Beynon JL: Differential recog-
nition of highly divergent downy mildew avirulence gene
alleles by RPP1 resistance genes from two Arabidopsis lines.
The Plant cell 2005, 17(6):1839-1850.
130. van der Biezen EA, Freddie CT, Kahn K, Parker JE, Jones JD: Arabi-
dopsis RPP4 is a member of the RPP5 multigene family of
TIR-NB-LRR genes and confers downy mildew resistance
through multiple signalling components. Plant J 2002,
29(4):439-451.
131. McDowell JM, Cuzick A, Can C, Beynon J, Dangl JL, Holub EB:
Downy mildew (Peronospora parasitica) resistance genes in
Arabidopsis vary in functional requirements for NDR1,
EDS1, NPR1 and salicylic acid accumulation. Plant J
2000,
22(6):523-529.
132. Cooley MB, Pathirana S, Wu HJ, Kachroo P, Klessig DF: Members
of the Arabidopsis HRT/RPP8 family of resistance genes con-
fer resistance to both viral and oomycete pathogens. The
Plant cell 2000, 12(5):663-676.
133. Takahashi H, Miller J, Nozaki Y, Takeda M, Shah J, Hase S, Ikegami M,
Ehara Y, Dinesh-Kumar SP: RCY1, an Arabidopsis thaliana
Publish with BioMed Central and every
scientist can read your work free of charge
"BioMed Central will be the most significant development for
disseminating the results of biomedical research in our lifetime."
Sir Paul Nurse, Cancer Research UK
Your research papers will be:
available free of charge to the entire biomedical community
peer reviewed and published immediately upon acceptance
cited in PubMed and archived on PubMed Central
yours — you keep the copyright
Submit your manuscript here:
/>BioMedcentral
BMC Plant Biology 2007, 7:56 />Page 20 of 20
(page number not for citation purposes)
RPP8/HRT family resistance gene, conferring resistance to
cucumber mosaic virus requires salicylic acid, ethylene and a
novel signal transduction mechanism. Plant J 2002,
32(5):655-667.
134. Bittner-Eddy PD, Crute IR, Holub EB, Beynon JL: RPP13 is a simple
locus in Arabidopsis thaliana for alleles that specify downy
mildew resistance to different avirulence determinants in
Peronospora parasitica. Plant J 2000, 21(2):177-188.
135. Bittner-Eddy PD, Beynon JL: The Arabidopsis downy mildew
resistance gene, RPP13-Nd, functions independently of
NDR1 and EDS1 and does not require the accumulation of
salicylic acid. Mol Plant Microbe Interact 2001, 14(3):416-421.
136. Allen RL, Bittner-Eddy PD, Grenville-Briggs LJ, Meitz JC, Rehmany AP,
Rose LE, Beynon JL: Host-parasite coevolutionary conflict
between Arabidopsis and downy mildew. Science 2004,
306(5703):1957-1960.
137. Deslandes L, Olivier J, Theulieres F, Hirsch J, Feng DX, Bittner-Eddy
P, Beynon J, Marco Y: Resistance to Ralstonia solanacearum in
Arabidopsis thaliana is conferred by the recessive RRS1-R
gene, a member of a novel family of resistance genes. Proceed-
ings of the National Academy of Sciences of the United States of America
2002, 99(4):2404-2409.
138. Deslandes L, Olivier J, Peeters N, Feng DX, Khounlotham M, Boucher
C, Somssich I, Genin S, Marco Y: Physical interaction between
RRS1-R, a protein conferring resistance to bacterial wilt, and
PopP2, a type III effector targeted to the plant nucleus. Pro-
ceedings of the National Academy of Sciences of the United States of Amer-
ica 2003, 100(13):8024-8029.
139. Sinapidou E, Williams K, Nott L, Bahkt S, Tor M, Crute I, Bittner-Eddy
P, Beynon J: Two TIR:NB:LRR genes are required to specify
resistance to Peronospora parasitica isolate Cala2 in Arabi-
dopsis. Plant J 2004, 38(6):898-909.
140. Grant JJ, Chini A, Basu D, Loake GJ: Targeted activation tagging
of the Arabidopsis NBS-LRR gene, ADR1, conveys resistance
to virulent pathogens. Mol Plant Microbe Interact 2003,
16(8):669-680.
141. Staal J, Kaliff M, Bohman S, Dixelius C: Transgressive segregation
reveals two Arabidopsis TIR-NB-LRR resistance genes effec-
tive against Leptosphaeria maculans, causal agent of black-
leg disease.
Plant J 2006, 46(2):218-230.