báo cáo khoa học: " Transcriptomic identification of candidate genes involved in sunflower responses to chilling and salt stresses based on cDNA microarray analysis" pps
Bạn đang xem bản rút gọn của tài liệu. Xem và tải ngay bản đầy đủ của tài liệu tại đây (639.59 KB, 18 trang )
BioMed Central
Page 1 of 18
(page number not for citation purposes)
BMC Plant Biology
Open Access
Research article
Transcriptomic identification of candidate genes involved in
sunflower responses to chilling and salt stresses based on cDNA
microarray analysis
Paula Fernandez
1
, Julio Di Rienzo
2
, Luis Fernandez
1
, H Esteban Hopp
1,3
,
Norma Paniego
1
and Ruth A Heinz*
1,3
Address:
1
Instituto de Biotecnología, CICVyA, INTA Castelar, Las Cabañas y Los Reseros, (B1712WAA) Castelar, Provincia de Buenos Aires,
Argentina,
2
Cátedra de Estadística y Biometría, Facultad de Ciencias Agrarias, Universidad Nacional de Córdoba, Córdoba, Argentina and
3
Facultad
de Ciencias Exactas y Naturales, Universidad de Buenos Aires, Buenos Aires, Argentina
Email: Paula Fernandez - ; Julio Di Rienzo - ;
Luis Fernandez - ; H Esteban Hopp - ; Norma Paniego - ;
Ruth A Heinz* -
* Corresponding author
Abstract
Background: Considering that sunflower production is expanding to arid regions, tolerance to abiotic stresses as drought, low
temperatures and salinity arises as one of the main constrains nowadays. Differential organ-specific sunflower ESTs (expressed
sequence tags) were previously generated by a subtractive hybridization method that included a considerable number of putative
abiotic stress associated sequences. The objective of this work is to analyze concerted gene expression profiles of organ-specific
ESTs by fluorescence microarray assay, in response to high sodium chloride concentration and chilling treatments with the aim
to identify and follow up candidate genes for early responses to abiotic stress in sunflower.
Results: Abiotic-related expressed genes were the target of this characterization through a gene expression analysis using an
organ-specific cDNA fluorescence microarray approach in response to high salinity and low temperatures. The experiment
included three independent replicates from leaf samples. We analyzed 317 unigenes previously isolated from differential organ-
specific cDNA libraries from leaf, stem and flower at R1 and R4 developmental stage. A statistical analysis based on mean
comparison by ANOVA and ordination by Principal Component Analysis allowed the detection of 80 candidate genes for either
salinity and/or chilling stresses. Out of them, 50 genes were up or down regulated under both stresses, supporting common
regulatory mechanisms and general responses to chilling and salinity. Interestingly 15 and 12 sequences were up regulated or
down regulated specifically in one stress but not in the other, respectively. These genes are potentially involved in different
regulatory mechanisms including transcription/translation/protein degradation/protein folding/ROS production or ROS-
scavenging. Differential gene expression patterns were confirmed by qRT-PCR for 12.5% of the microarray candidate sequences.
Conclusion: Eighty genes isolated from organ-specific cDNA libraries were identified as candidate genes for sunflower early
response to low temperatures and salinity. Microarray profiling of chilling and NaCl-treated sunflower leaves revealed dynamic
changes in transcript abundance, including transcription factors, defense/stress related proteins, and effectors of homeostasis,
all of which highlight the complexity of both stress responses. This study not only allowed the identification of common
transcriptional changes to both stress conditions but also lead to the detection of stress-specific genes not previously reported
in sunflower. This is the first organ-specific cDNA fluorescence microarray study addressing a simultaneous evaluation of
concerted transcriptional changes in response to chilling and salinity stress in cultivated sunflower.
Published: 26 January 2008
BMC Plant Biology 2008, 8:11 doi:10.1186/1471-2229-8-11
Received: 30 May 2007
Accepted: 26 January 2008
This article is available from: />© 2008 Fernandez et al; licensee BioMed Central Ltd.
This is an Open Access article distributed under the terms of the Creative Commons Attribution License ( />),
which permits unrestricted use, distribution, and reproduction in any medium, provided the original work is properly cited.
BMC Plant Biology 2008, 8:11 />Page 2 of 18
(page number not for citation purposes)
Background
Sunflower (Helianthus annuus L.) is the third most impor-
tant source of edible vegetable oil worldwide which is also
thought to become an efficient source of biodiesel (Sun-
flower Statistics NSA 2007, USA) [1]. Considering that
sunflower production is expanding to arid regions in the
Mediterranean area, North America, India and Argentina,
tolerance to drought and salinity arises as important
issues for breeding programs [2-4]. In addition, require-
ments of early sow to maximize the growing season and
to escape to drought stress have increased the need of bet-
ter chilling tolerance, particularly at early stages of devel-
opment. Molecular mechanisms involved in response to
these stresses have been extensively studied in model spe-
cies like Arabidopsis thaliana [5-7] and in important crop
species like rice [8]. The expression of a number of plant
genes is regulated by abiotic environmental stresses
including drought, high salinity and cold [9-12]. Tran-
scriptome analysis using microarrays have proven to be a
powerful tool for discovery of many stressed-induced
genes involved in stress response and tolerance. Macro
and microarray studies of abiotic stress responses in Ara-
bidopsis and Oryza sativa allowed the identification of
genes involving both functional and regulatory proteins
[6,8,13-23]. The first group comprises membrane trans-
porters and water channel proteins, key enzymes for
osmolite biosynthesis; detoxification enzymes and mac-
romolecules protection proteins. The second group com-
prises transcription factors (TFs) (i.e. bZIP, MYC, MYB,
CREB/CBF, HD-ZIP), protein kinases and proteinases
involved in the regulation of signal transduction and gene
expression. These regulatory systems have been reported
either as dependent or independent on abscisic acid
(ABA) which indicate the existence of complex regulatory
mechanisms between perception of abiotic stress signals
and gene expression [20,21].
Cross talk signaling cascades among drought, cold and
salinity has been reported for A. thaliana and large
number of stress-inducible genes were isolated and char-
acterized including osmotic response genes as rd22BP1,
AtMYBB2, DREB1A and DREB2A, signaling molecules
that activates effectors as SOS3 (Ca
2+
binding protein),
SOS2 (Ca
2+
dependent kinase), SOS1 (Na
+
/H
+
membrane
antiporter) [8,22]. Regarding responses to low tempera-
tures, cold-induced genes were reported in many species
as lucerne [23], Arabidopsis [24-26], barley [27] and wheat
[28,29]. Many of these genes encode for proteins of
unknown function, being some of them described as LEA
proteins (Late Embryogenesis Abundant) [30]. Other
cold-resistance genes (COR) as LT1, KIN, RD and ERD
have been isolated mainly from Arabidopsis. These genes
present the CRT/DRE (C-repeat/dehydratation-responsive
elements) in the promoter region that bind CBF and
DREB (C-repeat binding factors/dehydration-responsive
elements binding proteins) TFs. While cis elements in cold
response genes bind DREB1/CBF TFs, regulatory regions
of drought response genes bind TFs belonging to DREB 2
type protein [5,31-33].
As mentioned, tolerance to a combination of different
abiotic stresses is a well-known breeding target for sun-
flower as well as for other crops. Studies of simultaneous
stress exposure were documented in various plant systems
[8,13,34-41]. Nevertheless, little is known about the com-
parative molecular mechanisms underlying the acclima-
tion responses of plants to a combination of different
stresses [42].
Gene expression databases are increasing exponentially
and the resulting information is stored and classified.
While powerful software algorithms allow structural
sequence similarity comparisons between species, diffi-
culties arise to predict molecular function based on com-
parisons with homologous genes identified as
determinant for a specific trait in different species. Identi-
fication of true orthologous among species is a powerful
tool for candidate gene detection, particularly when com-
paring species having their full genome sequenced and
those based on EST sequencing projects. In the case of
Asteraceae species (including sunflower), only small syn-
tenic fragments with Arabidopsis could be identified and
their evolution involving major chromosomal rearrange-
ments makes orthologous gene pairs difficult to identify
[43]. Even for other plant taxa comparative functional
transcriptomic studies among crop plant genomes is rela-
tively scarce [35]. A microarray analysis in A. thaliana to
identify simultaneously conserved and differentially
expressed genes in oat, poplar and Euphorbia esula L.
("leafy spurge") was recently reported [44].
Sunflower was described as normally susceptible to low
temperatures and salinity [45,46], however, available
information on gene expression in response to abiotic
stresses are still limited to few studies [35,45-49]. Recently
the detection of a large number of down-regulated genes
in plants exposed to extensive periods of low tempera-
tures was reported [35], indicating that acclimation to
chilling temperatures does not occur in sunflower. Mean-
while, transcriptional profiles in drought-tolerant and
non-tolerant sunflower genotypes in response to water-
stress allowed the identification of differential gene
expression related to amino acid and carbohydrate metab-
olisms and signal-transduction processes [49]. In this
work we report for the first time a concerted study on gene
expression in early responses to chilling and salinity using
a fluorescence microarray assay based on organ-specific
unigenes in sunflower. The aim of this work was to detect
candidate genes associated to regulatory and stress-
response pathways common to both stresses and at the
BMC Plant Biology 2008, 8:11 />Page 3 of 18
(page number not for citation purposes)
same time identify those genes exclusively expressed in
response to each kind of stress conditions.
Results and Discussion
Data analysis and accuracy of biological replicates
Differential expression of organ-specific sunflower
sequences previously obtained by suppression subtractive
hybridisation (SSH) [50] was evaluated with regard to the
response to chilling and salt stresses using cDNA fluores-
cence microarray hybridization followed by Northern
blot and qRT-PCR validation. Thus, three biological repli-
cates were evaluated for chilling and salinity stresses as
well as for control plants. The stress treatments were
designed considering that sunflower has been described
as normally susceptible to low temperatures and salinity
[45,46]. Regarding chilling tolerance, there is only one
report studying sunflower response to low temperatures
[35]. However, in that study only long-term acclimatizing
was evaluated, thus meaning that detected changes in
gene expression reflect mainly plant metabolism adapta-
tion to grow under suboptimal conditions more than
short term responses to chilling. No previous studies on
concerted gene expression of cultivated sunflower to
salinity were reported before. In the present work, an early
response to chilling and salinity is evaluated in order to
detect early transcriptional changes in genes induced at
the onset of the tolerance process.
A first step analysis was performed to determine the accu-
racy and reproducibility of these biological treatments by
Principal Component Analysis (PCA) applied to the gene
expression matrix (Figure 1). The resulting analysis
showed that biological samples of plants that were
stressed either with saline or chilling treatments showed
expected changes in their general expression parameters
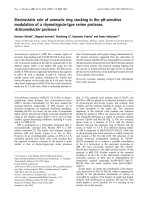
when compared to the controls. However, this analysis
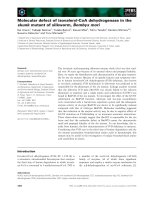
indicated that one of the biological control replicates (Ctrl
3) displayed a non-typical performance within the control
group (Figure 1). Graphical representation of biological
replicates in the space spanned by principal components
1,2; 1,3 and 2,3 is shown in Figure 1a, b and 1c, respec-
tively. It is clearly shown that Ctrl3 differed significantly
from the other control replicates and was discarded for
further analysis.
Candidate gene selection
Data normalization - Normalization within microarrays
Relationship between genes and treatments as well as the
magnitude of their association can be clearly visualized in
the bi-plot generated by the first two principal compo-
nents of the expression matrix, with rows and columns
representing genes and treatments (control, cold and
salinity) replicates, respectively (Figure 2). In this plot,
genes are displayed as points on the plane while treatment
replicates are represented by vectors rooted to the origin
(centre of the plot). These vectors describe directions
along which genes can be ordered according to treatment
response. Differentially expressed genes on a specific treat-
ment have a large projection along the axis defined by the
direction vector representing that treatment. Replicates
from a given treatment have similar orientation and small
angles among them, which emphasizes the identity of the
treatments (Figure 2). Genes displayed far from the centre
of the plot along the "cold vectors" correspond to those
over expressed in that treatment, whereas those following
the "salinity vectors" correspond to genes over expressed
under saline medium. On the other hand, genes placed at
the opposite direction of the previous ones are genes sub-
expressed under those conditions. Vectors representing
the control replicates are shorter than vectors representing
stress replicates. This finding supports the fact that a pool
of control plants was used as a reference through the
hybridization experiments and the expected log fold
change for the control treatment should be zero for every
gene.
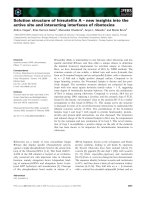
Principal axis 1, which retained 75.6% of the total varia-
bility, sorts genes according their fold change in over (on
the right) and under (on the left) expression conditions
independently of the stress condition applied. Principal
axis 2 retaining 17.2% of total variability emphasizes the
differences between cold and salinity treatments.
Although bi-plot representation revealed a clear picture of
the high quality of microarray data, it is not by itself an
inferential technique. Analysis of variance takes into
account variability between replicates to decide on the sig-
nificance of differential expression [35]. In order to select
differentially expressed genes a two step procedure was
used. First an analysis of variance for every gene was per-
formed and only those genes having p-values lower than
5% were retained for complementary analysis. It is known
that using the raw p-value as a selection criteria results in
a large number of false discoveries. This was a matter of
concern because nearly 50% of all evaluated ESTs were
significant at a 5% significance level. At this point we
decided to use information provided by the ordination
technique to filter genes and reduce the rate of false dis-
coveries. The rationality behind this procedure is that the
farther the gene is to the center of the plot, the larger the
fold change expression level. Under this assumption,
those genes located in the periphery of the bi-plot should
be the most dramatically involved in the responses to
stress. The calculation of the distance-to-the-origin in the
space spanned by the first two principal components is
the first step that serves as a scoring system to rank differ-
entially expressed genes. Thus, within those genes
retained by the p-value criteria we kept those that were at
BMC Plant Biology 2008, 8:11 />Page 4 of 18
(page number not for citation purposes)
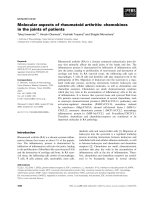
a distance-to-the-origin above the percentile 70
th
of the
distance-to-the-origin distribution (Figure 3). This cut-off
criterion was selected taking into account that EST T411
(contig of the EST T111, AN: BU671801) was already
experimentally validated as differentially expressed by
Northern-blot and qRT-PCR and that its position in the
distance-to-the-origin distribution corresponds to the 70
th
percentile (Figure 3). Therefore, 80 genes differentially
expressed were picked as candidate genes for early
response to low temperatures and salinity (see Additional
file 1).
Microarray validations
In order to experimentally validate differentially
expressed genes derived from microarray analysis, North-
ern blot analysis and qRT-PCR were performed for candi-
date gene T411 [GenBank: BU671801
], not only to
validate the differential expression of this gene but also to
Principal component analysis (PCA) applied to the gene expression matrixFigure 1
Principal component analysis (PCA) applied to the gene expression matrix. Graphical representation of three bio-
logical replicates for abiotic stress treatments: control (Ctrl), cold stress (C) and salinity stress (S).
-5.00 -2.50 0.00 2.50 5.00
PC 1 (49.1%)
-5.00
-2.50
0.00
2.50
5.00
PC 2 (26.9%)
CH21_1Ctrl 1
Ctrl 2
Ctrl 3
C 1
C 2
C 3
S 2
S 3
(a)
S 1
-5.00 -2.50 0.00 2.50 5.00
PC 1 (49.1%)
-5.00
-2.50
0.00
2.50
5.00
PC 3 (10.4%)
Ctrl 1
Ctrl 2
Ctrl 3
C 1
C 2
C 3
S 1
S 2
S 3
( b)
-3.00 -1.50 0.00 1.50 3.00
PC 2 (26.9%)
-3.00
-1.50
0.00
1.50
3.00
PC 3 (10.4%)
Ctrl 1
Ctrl 2
Ctrl 3
C 1
C 2
C 3
S 1
S 2
S 3
( c )
BMC Plant Biology 2008, 8:11 />Page 5 of 18
(page number not for citation purposes)
set the cut-off significance criteria in the Bi-plot analysis
within those genes retained by the p value criteria. This
gene is up-regulated under cold and salinity stresses (see
Additional files 2 and 3) and its position in the distance-
to-the-origin distribution corresponds to the 70
th
percen-
tile, as previously described.
A total of ten candidate genes were validated by qRT-PCR:
EF127 [GenBank: BU671885
], EF264 [GenBank:
BU671886
], EF502 [GenBank: BU671910], F171 [Gen-
Bank: BU671987
], F379 [GenBank: BU671983], F443
[GenBank: BU671999
], F455 [GenBank: BU672004],
H360 [GenBank: BU672086
], T124 [GenBank:
BU671806
] and T411 [GenBank: BU671801] using specif
oligonucleotides designed for each candidate gene (Table
1). Three biological replicates of each reaction derived
from independent cDNA synthesis were performed and
actin sequence from sunflower [GenBank: AAF82805
] was
used as an internal control to normalize gene expression
level. Quantification of the relative changes in gene
expression was performed using the 2
-ΔΔCT
method as
described by Livak and Schmittgen [51]. Comparison of
the results from real-time RT-PCR with those from micro-
array analysis revealed similar patterns of expression.
Pearson's correlation coefficient between cDNA microar-
ray and qRT-PCR fold changes was r = 0.60 (p = 0.0054)
(Table 2) (see Additional file 4). More than 10% of the
candidate genes detected by microarray assay in the
present study were validated by qRT-PCR. Considering
that average validation percentage is usually below 5%
out of total candidate genes for reported cDNA microar-
rays studies [35,49,52] the number of validated genes in
this work is highly representative of the transcription pro-
file patterns detected by the microarray technology
(12.5% out of total of differentially expressed genes)
(Table 2). In all cases, observed transcriptional changes
confirmed the results of microarray analysis.
Differences in transcriptional changes detected in organ-
specific cDNA libraries
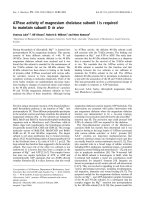
Differences in gene expression were analyzed according to
the differential organ-specific cDNA library from which
they were isolated as described before [50] (Figure 4). Leaf
library derived genes (comprising differential sequences
of leaf arrested with R4 flower bud) were mostly down-
regulated in response to either stress condition, whereas a
large number of genes derived from an R4 flower develop-
mental stage and stem libraries (representing differential
sequences of flower bud and stem arrested both with leaf,
respectively) showed an up-regulation transcriptional pat-
tern. Considering that transcriptional changes in response
to salt and chilling stresses are evaluated here in leaf tis-
sue, these results confirmed the efficiency of SSH tech-
nique in the generation of the differential organ specific
libraries [50]. ESTs from leaf library correspond to genes
that are highly expressed in control conditions while the
opposite situation takes place with ESTs isolated from the
flower and stem libraries. Thus, the majority of the genes
Bi-plot BFigure 3
Bi-plot B. Biplot of the expression matrix showing only
those genes having p-values lower than 0.05 in the F-test.
Genes with distance-to-the-origin greater than the 70
th
per-
centile of the distance-to-the-origin distribution are shown as
dotted circles. The circled dots represent the 80 differen-
tially expressed genes identified as differentially expressed
among the evaluated treatments: control (Ctrl), cold (C) and
salinity (S). Solid dots represent putative false positive genes.
-33.00 -16.50 0.00 16.50 33.00
PC 1 (75.6%)
-33.00
-16.50
0.00
16.50
33.00
PC 2 (17.2%)
Ctrl1
Ctrl2
C1
C2
C3
S1
S2
S3
Ctrl1
Ctrl2
C1
C2
C3
S1
S2
S3
Bi-plot AFigure 2
Bi-plot A. Biplot showing 287 genes whose expression lev-
els were studied in three treatments: control (Ctrl), cold (C)
and salinity (S). The ordination was obtained taking into
account the three (two in case of Ctrl) independent biologi-
cal replicates.
-33.00 -16.50 0.00 16.50 33.00
PC 1 (75.6%)
-33.00
-16.50
0.00
16.50
33.00
PC 2 (17.2%)
Ctrl1
Ctrl2
C1
C2
C3
S1
S2
S3
Ctrl1
Ctrl2
C1
C2
C3
S1
S2
S3
BMC Plant Biology 2008, 8:11 />Page 6 of 18
(page number not for citation purposes)
from the leaf library evaluated in this assay were down
regulated in response to stress conditions while genes
derived from stem and R4 flower bud libraries, represent-
ing genes at a lower expression level in control leaf,
appeared up-regulated in these assays. The set of genes
evaluated in the present study is composed mainly by
genes that are either at high expression levels in control
leaves (those from leaf library) or either genes that are at
low expression level in control leaves (those from stem
and flower bud libraries). Genes with similar transcrip-
tion levels in different plant organs under control condi-
tions are low represented in this array. These results also
explained the large transcription change/transcription
unchanged ratio detected in these assays, considering that
27.8% (80/287) of the evaluated genes appeared down or
up-regulated in either one or the other stress condition,
when compared to microarray analysis derived from non-
subtractive cDNA libraries [21].
Table 2: Comparison of gene expression levels obtained by cDNA microarray and qRT-PCR analysis for 10 differentially expressed
genes
GenBank
(dbEST)
Accession
Number
EST/Gene
Name
Fold change qRT-PCR Fold change microarray
Cold Salinity Cold Salinity
BU671885 EF127 4.6100 ↑ 5.6900 ↑ 1.7590 ↑ 1.7430 ↑
BU671886
EF264 14.1000 ↑ 88.1500 ↑ 0.2670 ↑ 1.1620 ↑
BU671910
EF502 4.8000 ↑ -2.1200 ↓ 1.1010 ↑ -1.1410 ↓
BU671987
F171 -0.8000 ↓ 6.2500 ↑ -1.7970 ↓ 1.6890 ↑
BU671983
F379 112.1500 ↑ 0.0280 ↑ 1.3060 ↑ 1.1190 ↑
BU671999
F443 -140.3200 ↓ -110.1200 ↓ -1.1790 ↓ -1.1030 ↓
BU672004
F455 48.1200 ↑ 82.5600 ↑ 1.5030 ↑ 1.3230 ↑
BU672086
H360 47.4000 ↑ 3.8500 ↑ 1.8140 ↑ 1.2460 ↑
BU671806
T124 13.5000 ↑ 22.3500 ↑ 1.3550 ↑ 1.5200 ↑
BU671801
T411 12.4200 ↑ 2.3800 ↑ 1.4980 ↑ 1.2820 ↑
Table 1: Oligonucleotides used for qRT-PCR validations
GenBank (dbEST) Accession
Number
EST/Gene name Forward primer 5'-3' Reverse primer 3'-5'
BU671885 EF127 GCATTGGGCAGATCTTGTTT GTCCCCTTTGGAGGCAGTA
BU671886
EF264 GGAGCTTGAGGATGCGATAC GAAACGTAAAGCCCCGATAA
BU671910
EF502 TGATCCATCAATCTCCGTCTT TGTAGGTGCATGGAACAAGC
BU671987
F171 AAAGGATCAGTCGCTGCTGT GCTTTTCCAAGATTGCATCC
BU671927
F126 CAAAATGCAACGACCCATTA TCTGTACGCCCTCATGTTCA
BU671928
F231 CAACAAAAGCAGACGCTGAA AGCATGTGGTGTTTGGACAG
BU671983
F379 CAGCCCGGAGAGGTTTAACT GGCAGGTACAGAATCGGCTA
BU671999
F443 AATCCCATCAATCCCCACTT GTTTCCACCCCTTCCATTTT
BU672004
F455 GCCGAGGTACAAACTGGAGA TGAGCATGATCTGAATATCTTGAA
BU672026
F543 ACGGAAGCGTTGTTTGGTAA TCAACATCCCACAGAAACGA
BU672017
F550 CAGAGACGTTCTTGCGTTGA CGCACACAACAAAGAAATGG
BU672042
F557 CGCAATTGCTATTGATGGAA ACACCGGTATGGTTGATGCT
BU672056
H110 ACGCGAGTCGGTTGTTTTAT TCATTTTCTCCACCCATGGTA
BU672069
H123 GGCAGGTACCAGGGGTTATT GAGGTTCATTCCGTCGTTGT
BU672102
H136 TTTGCAAGGATGAATGGTGA GTGACCCGAACTCCTTGGTA
BU672086
H360 GGCAGCCAATCCTCTTGATA CGACTCCGCCAAATACAGAT
BU672090
H385 TTCAGCCCGGAAAGAATATG AACTTTGCAGTGGGACCATC
BU671806
T124 GGAACACCGTGAAGGATGAG GGCAGGTACATCTTGGCCAAT
BU671875
T283 CTCACGAAAGCTTCCTGCTT GCAGGTACTCGGTTTGTTCC
BU671843
T340 AAGACGGTGGATTTGAGGTG AACCTTTGCCTGCTTTCTCA
BU671801
T411 GGCAAGGGAAAACACCACTA TGTTGAGGTGTGGCTCTGTC
AAF82805
sunflower actin AGGGCGGTCTTTCCAAGTAT ACATACATGGCGGGAACATT
BMC Plant Biology 2008, 8:11 />Page 7 of 18
(page number not for citation purposes)
Differences between cold and salinity treatments
Specific gene expression patterns in plants exposed to dif-
ferent treatments are evidenced when profile graphs by
gene are analyzed (see Additional file 2). Drought, salinity
and cold stress reduce water availability decreasing cell
water potential. In order to avoid dehydration, plant
responses include solute accumulation, cell wall compo-
nents modification, and synthesis of protective proteins,
avoiding or repairing cellular damage [53]. The activation
of these responses requires a complex signaling network
being many of them shared by various abiotic stresses as
those involving the DREB/CBF pathway [9,54] and other
ones typically from a determined abiotic stress [7,55].
Although heatmaps are largely used in microarray analysis
as a tool to visualize and detect differentially expressed
genes [56] (see Additional file 3), an alternative and more
reliable tool is the evaluation of individual gene transcrip-
tion profile (see Additional file 2). Indeed, several reports
on the usefulness of both methodologies to analyze
microarray results have been recently published [57].
The availability of microarray technology allowing the
comparison of large numbers of genes that are regulated
under certain condition represents a powerful tool for
many researchers. However, caution should be exercised
when interpreting the outcome results. For example, salt
stress treatment results in a rapid decline in photosynthe-
sis within minutes [37]. Therefore, genes that are regu-
lated by photosynthetic activities maybe affected but they
are not regulated by salt stress per se. In another study the
expression of 150 genes in response to wounding and
insect feeding was carried out [58], finding that some of
the responding genes, for which the inducing stimulus
was unclear in these processes, were also characterized as
induced by drought [59]. Thus, several factors could con-
tribute to a complex pattern of transcript levels in which
the interplay of stimuli that control gene expression can
override each another. The stress intensity and the time
course of gene induction are also important factors to be
considered [59]. The primary and the secondary stresses
may induce genes in different time frames.
In Arabidopsis studies on concerted genes expression
revealed a large number of cold- acclimation and freezing
tolerance genes [6,60-62], but there are only few studies
on acclimation to chilling temperature [63]. The ability of
sunflower plants to gain a frost tolerance after exposure to
a period of low temperature is still poorly understood.
Although, recent results suggest that sunflower plants are
non-acclimating plants under two conditions of low-term
long-temperature at 15°C and 7°C [35]. Thus, in the
present study the response of sunflower to low tempera-
tures has been focused at primary responses of young
plants to a 24 hs treatment at 10°C with the aim to detect
regulatory mechanisms induced at this early stage. Toler-
ance to low temperatures arise as an important trait con-
sidering that sunflower productive area is expanding to
marginal regions with suboptimal growing conditions
and the increasing requirement of early sow to maximize
Profile of gene expression by organ-specific cDNA libraryFigure 4
Profile of gene expression by organ-specific cDNA library. Transcriptional changes of the 80 differential genes were
evaluated according to the organ-specific library from which there were originally isolated. Most of the genes isolated from the
leaf cDNA library show a decrease in transcript abundance while genes isolated from R4 library showed an inverse pattern
under salt and cold stresses.
BMC Plant Biology 2008, 8:11 />Page 8 of 18
(page number not for citation purposes)
the growing season in many countries. Regarding toler-
ance to high NaCl contents, there is not much informa-
tion available for sunflower but expansion of crops to
more arid regions is associated to an increasing problem
of soil salinity.
The 80 sequences that showed changes in transcriptional
levels in response to salt and cold conditions were classi-
fied by putative functionality according to best hits on
sequence similarity analysis based on BLAST algorithms
and GO terminology (see Additional file 1) [64]. Gene
expression profile by clustering analysis using heatmap
representation (see Additional file 3) allowed the detec-
tion of gene patterns among treatments (chilling, salinity
and control) confirmed by individual gene transcription
profiles (see Additional file 2). Out of the 80 candidate,
50 genes were either up or down regulated under both
abiotic stresses, thus supporting common regulatory
mechanisms and general responses to low temperature
and salinity. Fifteen and 12 sequences were either up or
down-regulated respectively in a stress-specific manner
under chilling or salinity. Finally, 3 genes showed inverted
pattern of expression (F171, T107, E502) [GenBank:
BU671987
] [GenBank: BU671799] [GenBank:
BU671910
] and 39 differential ESTs correspond to genes
with unknown predicted function [64]. The number of
genes that were either up or down regulated under salt or
chilling stresses are showed in Figure 5 grouped by
assigned molecular and/or processes function. Changes in
transcriptional patterns in response to chilling and salin-
ity stresses are discussed below according to their pre-
dicted functionality classes (see Additional file 1) based
on the Gene Ontology [65]. Those accessions without
GO-term association were included in a particular cate-
gory by means of a manual procedure.
Central metabolism/Photosynthesis
Low-temperature exposure in combination with high irra-
diance causes rapid inhibition of photosynthesis in a
broad range of plants including tomato, cucumber and
maize. Several elements contributing to this inhibition
have been identified [66]. Damage to the reducing side of
photosystem II is well documented [67,68] and, for mod-
erately sensitive species such as maize, it may be the major
cause of impaired whole plant photosynthesis following
chilling. However, in the most chill-sensitive species, such
as tomato, impaired reductive activation of the stromal
biphosphatases appears to be the dominating factor lim-
iting carbon assimilation following chilling in the light
[69]. Low temperature at night can also cause severe
reductions in CO
2
fixation on the day after chilling. In this
work, genes that encode products with predicted func-
tions related to energy metabolism were down-regulated
under both stresses in sunflower. Among them, many
genes potentially encoding components involved in pho-
tosynthesis, such as photosystem proteins, chlorophyll-
binding proteins, Rubisco and light harvesting proteins
showed differential expression patterns in this study. Con-
sidering sunflower as a medium-tolerant plant to chilling
sensitivity [45], it has been suggested that decreasing
energy metabolism is one of the cellular processes associ-
ated with the sunflower response to low temperatures
[68]. Here, we show that this process is not only down-
regulated under chilling stress but also under salinity
Profile of gene expression by putative functional categoryFigure 5
Profile of gene expression by putative functional category. The number and direction of transcriptional changes of the
80 differential genes under cold and salinity stresses are presented by functional categories.
BMC Plant Biology 2008, 8:11 />Page 9 of 18
(page number not for citation purposes)
stress in H. annuus. Down-regulation of fructose-1,6
biphosfatase under drought stress in sunflower was
reported as mainly associated to the stomata closure pro-
duced during water deficit [69]. Yet, it was observed that
NaCl reduces photosynthetic activity in Phaseolus vulgaris
independent of stomata closure and by reducing the RuBP
pool size through an effect on the RuBP regeneration
potential [70]. Thus, decline in photosynthesis in
response to salinity has been attributed to the salinity
effect on both stomatal and non-stomatal controls [70].
However, the same enzyme from the halophytic wild rice,
Portesia coarctata, decreases its catalytic activity by salt and
may have intrinsic structural properties to withstand such
decline [71].
Calvin cycle is mainly affected under dehydration and
salinity stress in stress-sensitive plants as sunflower. How-
ever, the effect of a cold stress on this pathway is still
unknown. It has been previously reported that during
cold acclimation there is an increase in the availability of
Pi and phosphorylated intermediates in both the pathway
for Suc synthesis and the Calvin cycle, and increased
capacities of enzymes in both pathways [72]. However,
one consequence of these long-term changes in cytosolic
Pi availability and the capacity for Suc synthesis could be
to pull too much carbon out of the chloroplast via the tri-
ose-phosphate transporter. This would, in turn, reduce the
capacity of the Calvin cycle to regenerate RuBP and inhibit
photosynthesis. However, cold-tolerant species such as A.
thaliana and winter cereals are able to recover their photo-
synthetic capacity and resume growth after several days to
weeks at low temperature through cold acclimation proc-
ess [72-74], being actually little evidence available about
sunflower response during the days after cold stress.
There are many reports on defense signals induced by dif-
ferent stresses including cold, salinity and drought
[8,35,75-77]. In this category we report ten genes with dif-
ferential expression patterns (see Additional file 1). One
of them is up-regulated under both stresses (EST T411,
similar to a plastidic aldolase) [GenBank: BU671801
], a
second one is down-regulated under chilling stress (EST
T340, similar to a chloroplastic glutamine synthetase)
[GenBank: BU671843
] whereas a third one is specifically
down-regulated under salt stress conditions. Plastidic
aldolase genes characterized in Nicotiana plants can be
grouped in two sub-families: AldP1 and AldP2. It was first
reported that AldP2 was up-regulated by salt stress,
whereas AldP1 was suppressed by salt stress [78]. Thus,
EST T411 identified in this work as up-regulated in both
stresses would be hypothetically similar to an AldP2 type
due to the up-regulation observed under salinity stress.
On the other hand, down regulation of the transcriptional
profile of EST H136 (similar to a chloroplast drought-
induced stress protein) [GenBank: O04002
] under chill-
ing and salinity was observed. Typically, pathways leading
to CO
2
fixation and light harvesting are suppressed under
abiotic stresses; although there is evidence of an over
expression of glutamine synthase to enhance salinity tol-
erance in plants [79].
Signaling and transcription machinery
Regulatory proteins as TFs (bZIP, MYC, MYB and DREB)
as well as protein kinases and proteases are involved in
transcriptional changes under abiotic stresses [5]. The acti-
vation of the transcriptional machinery in regulation of
salt-dependent gene expression requires the induction of
specific TFs as well as RNA polymerases [80]. Many regu-
latory proteins, mainly identified in A. thaliana [76],
showed changes in TFs under environmental stresses. In
this analysis, and in agreement with a previous report
[35], an EST encoding a protein with similarity to a zinc
finger family protein was identified as up-regulated under
low temperature, although this transcription factor (TF)
does not show significant similarity to the one previously
reported. A zinc finger protein associated to saline stress in
Arabidopsis was recently reported [81] which is different
from the one previously identified as DREB1A [32].
Many candidate genes had been identified as TFs or as
sensing receptors for calcium signaling by in silico analysis,
showing the relative abundance of transcriptional
machinery related genes in the organ-specific cDNA
libraries developed by our group [50]. In the present
work, two DNA binding proteins isolated by stress organ-
specific cDNA libraries were detected as up-regulated spe-
cifically under salt (T187, T454) [GenBank: BU671817
]
[GenBank: BU671860
] and a zinc finger protein specifi-
cally induced under chilling treatment. The large amount
of TFs identified in Arabidopsis, indicating the complexity
in the secondary metabolism of the plants [82], could
explain the dramatic implication of those proteins in the
abiotic stress responses beyond the critical interaction
between plants and the environment and the level of
duplications found in the Arabidopsis genome [83]. A. thal-
iana TFs involved in stress response are traditional classi-
fied in ABA-dependent and ABA-independent regulatory
pathways. According to microarray analysis in this species
there are several independently responses to abiotic stress,
one of them involving the DREB/CBF regulon [34]. While
DREB1 genes are specifically induced by cold, DREB2
genes are induced by dehydration and high salt but not by
cold [7,32,84,85]. This response was also reported in rice
[33].
Recent studies have reported the importance of HD-ZIP
TFs in response to drought in an independent pathway
respect to the DREB transcriptional cascade [86]. In Arabi-
dopsis, ESTs libraries analysed by digital northern repre-
sented a 13% of signaling associated genes [87]. The up-
BMC Plant Biology 2008, 8:11 />Page 10 of 18
(page number not for citation purposes)
regulation of an ADP-ribosylation factor described in this
work (EF127) [GenBank: BU671885
] would explain the
regulation of the intracellular traffic through vesicles [88].
In addition, another gene under-regulated in both stresses
(T234) [GenBank: BU671830
] highly similar to an extra-
cellular Ca
2+
sensor was detected. That receptor was
recently identified in A. thaliana [89]. The authors demon-
strated that Ca
2+
extracellular level regulates Ca
2+
-depend-
ent intracellular signaling through specific sensors. In this
way those receptors would modulate calcium-dependant
kinases previously described as enzymes highly expressed
under chilling acclimation mainly. This knowledge was
reported for Medicago sativa plants evaluated after 10 min-
utes exposition at low temperatures [90,7]. The role of cal-
cium-dependent protein-kinases under different
environmental stresses was also reported in A. thaliana
[91] and rice [92].
Translation machinery
In general, genes involved in this cellular process were up-
regulated under abiotic stress as a protective mechanism
against key enzymes activity (see Additional file 1). Regu-
lation of the translational machinery is considered an
integral component in the cellular stress response [77,93].
It has been indicated that ribosomal proteins are not only
central to translational efficiency but have extra-ribos-
omal functions [94]. In the present assay, this is con-
firmed by up-regulation of ribosomal proteins under both
stresses. Besides, cDNAs encoding elongation factors were
detected as salt induced, as previously reported for stress-
associated genes in several systems [8,95].
Protein turnover/folding/protein interactions
Protein degradation during stress is a highly conserved
and regulated phenomenon in all the organisms reported
so far [96]. In this analysis, EST F443 [GenBank:
BU671999
] similar to a copper chaperone from tomato,
was down-regulated under both stresses, as previously
reported by a MALDI-TOF analysis of cold stress induc-
tion in rice seedlings [97]. This tomato's chaperone seems
to play a role in copper mobilization from decaying
organs towards reproductive structures, contributing to
growth in other parts of the plant [98]. In addition, EST
F231 [GenBank: BU671928
] similar to a cyclophilin, was
also down-regulated under chilling and salinity. Three
peptidylprolyl isomerases (PPI) were detected in Arabidop-
sis plants treated with NaCl being one of them similar to
a cyclophilin down-regulated under salinity stress [61].
By contrast, EST T124 [GenBank: BU671806
] similar to a
heat shock protein was up-regulated in both stresses. Heat
shock proteins (HSPs), often called the stress proteins, are
now recognized as important to a range of physiological
and cellular functions under both normal growth condi-
tions and in response to stresses other than heat shock
[99]. Starting in the mid-1980s, the concept of molecular
chaperones evolved from the work of biochemists and cell
biologists, and several HSPs were soon recognized as hav-
ing such chaperoning functions. Proteomic analysis
allowed the identification of several HSP's up-regulated in
poplar under chilling stress, being one of them strongly
similar to one of H. annuus detected in this work [38].
ROS-scavenging network
Cold stress, salinity and drought, combined with high
light conditions, result in enhanced production of ROS by
the photosynthetic apparatus because these conditions
limit the availability of CO
2
for the dark reaction, leaving
oxygen as one of the main reductive products of photo-
synthesis [100]. Drought, salt, and cold stress all induce
the accumulation of ROS such as super oxide, hydrogen
peroxide, and hydroxyl radicals [75]. H
2
O
2
is generated in
peroxisomes by the enzymatic activity of glycolate oxidase
[42]. In this study an EST with homology to a glycolate
oxidase (T120) [GenBank: BU671805
] was up-regulated
under both stresses, probably involved in a general gener-
ation of ROS under different abiotic stresses. These ROS
may be signals inducing ROS scavengers and other protec-
tive mechanisms, as well as damaging agents contributing
to stress injury in plants [101]. Many ESTs from leaf and
stem cDNA libraries encoding peroxidases, thioredoxins,
catalases and oxygen-evolving enhancer proteins showed
transcriptional changes in response to the studied stresses.
Most of those proteins were up-regulated in both stresses
due to the accumulation of these products along the oxi-
dative stress. However, a NADH-plastoquinone reductase
and a catalytic hydrolase were down-regulated. Genes
encoding proteins associated with cellular homeostasis
(respiration, cellular biogenesis and DNA repair) showed
a distinct decline under abiotic stresses [37].
Transport
Ion homeostasis during salt stress is affected by sodium
fluxes, transport and compartmentalization [8]. Abun-
dant transport-related genes have been described in a dif-
ferential gene expression study that involve hybrid
sunflower species, as preferentially expressed in Helian-
thus deserticola, a xerophytic species restricted to desert
habitat [102]. These genes seem to be important in the
extreme environment of desert soil, functioning as both
osmotic sensors and ionic regulators to prevent desicca-
tion [103,104].
In this work, EST H360 [GenBank: BU672086
] with simi-
larity to an ATP synthase was up-regulated in both
stresses, as happens with EST F557 [GenBank: BU672042
]
similar to a putative carrier protein. These transcriptional
changes could take place as a result of the large activity of
ion transporters during salt tolerance and potassium
nutrition [105]. Potassium transporters may function in
BMC Plant Biology 2008, 8:11 />Page 11 of 18
(page number not for citation purposes)
the transport of K
+
, which is an essential cofactor for many
enzymes [75]; or control K
+
uptake and regulate Na
2+
uptake, which can be an important determinant of salin-
ity tolerance [12,106]. Moreover, carrier proteins, water-
channel proteins and sugar transporters are thought to
function through plasma membranes and tonoplast to
adjust the osmotic pressure under stress conditions [21].
On the other hand, lipid transfer proteins (LTPs) are
another group of transport-related proteins associated to
fatty-acid metabolism which may have a function in
repairing stress-induced damage in membranes or
changes in the lipid composition of the membranes, per-
haps to regulate permeability to toxic ions and the fluidity
of the membrane [107,108]. Many LTPs have been shown
to affect cell wall extensibility or to be secreted in response
to NaCl stress [109]. Nearly half of the detectable LTP
transcripts in Arabidopsis root microarray were down-regu-
lated by NaCl treatment [61]. Moreover, LTPs with simi-
larity to Arabidopsis' LTPs were also detected as down-
regulated in sunflower under chilling stress [35]. In the
present work we identified an EST (EF502) highly similar
to an LTP protein [GenBank: BU671910
] being up-regu-
lated under chilling stress and down-regulated under
saline environment.
Secondary metabolism
EST H123 [GenBank: BU672069], which shows a high
identity to a myo-inositol phosphate synthase (MIPS pro-
tein, isomerase involved in inositol metabolism) [IUBMB
enzyme nomenclature: EC 5.5.1.4.] was down-regulated
in chilling and salinity. Inositol is a natural cell wall
osmoprotector subcellular synthesized into phosphatidyl-
inositol as part of a complex process and then recycled
into phosphatidyl-inositol cycle as a complex signaling
mechanism under abiotic stress conditions. Transgenic
tobacco tolerant to salinity mediated by a MIPS gene
product has been also described in P. coarctata [110]. By
contrast, in sesame, down-regulation by salt stress in seeds
during germination was reported for the SeMIPS1 gene
[111]. In addition, transcription of the MIPS gene was
found to be affected by salinity during biosynthesis of
myo-inositol and its derivatives [112,113], whereas evi-
dence was reported that expression of the MIPS gene is up-
regulated during salinity stress in salt-tolerant plants,
while its transcriptional levels are reduced in salt-sensitive
A. thaliana [114]. The down-regulation of EST H123 [Gen-
Bank: BU672069
] in sunflower (salt-sensitive crop)
reported here is strongly similar to a MIPS gene product in
sesame [GO Term GO: 0004512] [50].
Conclusion
This work presents the first cDNA sunflower fluorescence
microarray analysed by a combined statistical method,
studying transcriptional changes in early responses to
chilling and salinity. The statistical approach to select can-
didate genes combining a classical hypothesis test of
equal mean across treatment, i.e ANOVA, and an ordina-
tion technique based on principal component analysis
appears as an efficient methodology to identify differen-
tially expressed genes revealing a total of 80 candidate
genes either under chilling and/or salt stress. Even when
this represents a high percentage (28%) of differentially
expressed genes from the initial number of organ-specific
sequences evaluated, this is a lower proportion than that
identified by the ANOVA which was about 50%. The
reduction on the number of proposed differentially
expressed genes by the combined selection criteria men-
tioned above is useful to prevent against false discoveries.
Ten candidate genes from 12 selected ESTs representing
different expression patterns were successfully validated
by Real-Time quantitative PCR. Out of the 80 candidate
genes, 50 genes were found up or down-regulated under
abiotic stresses, supporting common regulatory mecha-
nisms and general responses to low temperature and
salinity. In addition, 15 and 12 genes were up or down-
regulated respectively under one specific stress whereas
the three remaining genes showed a contrasting transcrip-
tional profile, being induced under one stress and sup-
pressed under the other. Interestingly, almost half of the
differentially expressed genes (39) detected in this study
correspond to genes with unknown predicted function.
This result indicates that even though ESTs database for
Compositae plants comprises a large number of sequences
(509,904), many of them do not have an assigned puta-
tive function. The difficulty in finding orthologous pairs
in sequence comparisons with a fully sequenced genome
species as Arabidopsis which is highly divergent from the
Compositae species, could explain the large number of
unknown or unclassified ESTs in expression studies
involving partially sequenced genomes as sunflower.
There are many efforts from different research groups
reporting the use of ESTs in microarrays analysis to con-
tribute to the identification of those candidate genes
whose expression level changed in presence of abiotic
stresses [21,35,37,61,62,115]. However, many EST collec-
tions are not complete and are derived from cDNA librar-
ies of plants grown under non-stressed conditions, being
defense/stress ESTs under represented. In the case of sun-
flower, functional genomic studies targeting different
forms of water-deficit stress [49,89] have been conducted
using low scale thematic microarrays, though there are an
important number of ESTs available for this species. In
this sense, we consider that this work makes an essential
contribution to the knowledge of an oil crop plant
genome by its transcriptome characterization under two
abiotic stresses: chilling and salinity. It represents the first
work studying concerted gene expression of sunflower in
response to salinity, allowing the identification of genes
involved in common regulatory mechanisms to both
BMC Plant Biology 2008, 8:11 />Page 12 of 18
(page number not for citation purposes)
stresses from those specifically associated to either chilling
or salinity. Further studies exploring profile expression of
these candidate genes under different low temperatures
and salinity treatments combining different stress intensi-
ties and different stress extension periods will help to
understand their role at different points of the complex
regulatory mechanisms associated to stress response.
Selected candidate genes could be used ultimate to test
their molecular functions using expression studies for
over expression or suppression of target genes in trans-
genic plants. These candidate sequences constitute at the
same time a valuable tool to develop functional molecu-
lar markers based on SNPS/IndDels to assist selection in
breeding programs.
Methods
Plant material
Sunflower (H. annuus L.) plants belonging to inbred line
HA89 provided by sunflower breeding program from EEA
INTA Balcarce, Argentina were grown under standard con-
ditions in greenhouse (16 h photoperiod and 20–24°C
temperature) in pots of 1 liter (volume) containing com-
posite soil. Three pots, representing three biological sam-
ples, each of them containing 4 seedlings, were grown for
each treatment including control plants, watered daily
with tap water and fertilized weekly with Hakaphos
(COMPO
®
) 18-18-18 (NPK) at a final concentration of
100 ppm (0.55 W/V) during 2 weeks.
Chilling and salinity treatments
For high salinity treatment, 2-week old seedlings (2-full
expanded leaves) were watered with 150 mM salt solution
for three days (adapted from Liu and Baird) [48]. Control
seedlings were watered with tap water and grown under
the same conditions. For chilling stress, sunflower seed-
lings at the two-leaf stage were subjected to 10°C
(adapted from Huang et al.) [46]. All plants were grown in
growth chamber (Conviron
®
) during 24 hour with a 16
photoperiod provided by daylight fluorescent tubes
(Philips, Argentina). Leaves from control and stressed
seedlings were collected separately per biological repli-
cate, immediately frozen in liquid nitrogen and stored at
-80°C until processed for RNA extraction. Three biologi-
cal samples represented by three pots, each one composed
by four seedlings, were processed and evaluated inde-
pendently for each stress treatment: chilling, salinity and
control.
Amplification and preparation of cDNAs for microarrays
construction
Sunflower EST clones derived from different organ-specific
cDNA libraries were grouped in contigs using BioPipeline
[50]. Running BLASTN and BLASTX routines [116], 319
sunflower sequences with significant similarities (E value <
1.0 E
-10
or BLAST score > 80) to already known or predicted
genes involved in main stress/defense responses, primary
metabolic pathways, gene expression or signal transduction
were selected for microarray construction. BLAST-based
GO term prediction application were used to assign func-
tional categories to the defined unigene collection consid-
ered all three GO categories at the most specific term as
described in a previous work [50]. GO annotation updates
were done through AmiGO [65].
EST libraries amplification
Recombinant plasmid preparations from different organ-
specific cDNA libraries [50] that were previously used for
3' sequencing were used again for PCR amplification.
LacZ1 and 2 forward and reverse primers were used to
amplify the cloned inserts in 96 well plates using an
Eppendorf thermocycler.
(LacZ1) 5'-3' sequence: GCT TCC GGC TCG TAT GTT
GTG TG 5'-3'
(LacZ2) 5'-3'sequence: AAA GGG GGA TGT GCT GCA
AGG CG.
Four PCR reaction plates were prepared, one from each
cryogenic glycerol tube containing the cloned EST. Long
Expand Template PCR System kit (Roche Diagnostics,
Inc.) was used in a 50 μl final volume master mix consist-
ing of final concentrations of 1× PCR buffer 3, dNTPs 0.2
mM, 0.25 mM Lac Z primers, Taq Pol Mix 0.75 u. Forty
eight μl from this volume were aliquoted into each well of
a 96 well PCR reaction plate (MJ Research). A 2 μl aliquot
of an undiluted plasmid template DNA was aliquoted
into the 48 μl of master mix. The plates were briefly cen-
trifuged for 30 sec at 1500 rpm and placed into a Eppen-
dorf thermocycler at denaturing conditions (94°C) for 1
min, followed by 32 cycles of 94°C for 30 sec; annealing
temperatures were programmed at a descendant ramp
from 60°C to 55°C and 72°C for 30 sec and a final exten-
sion of 72°C for 5 minutes. A typical yield from the PCR
was about 50–150 ng/μl of amplified DNA.
Purification
The PCR products were loaded into a 96-well plate (Mill-
ipore #MANU3050) and vacuum filtered at 15 psi for
about 10 min until the wells were completely empty. Puri-
fied products (QIAquick 96 PCR Purification Kit, Qiagen,
Germany) were eluted in sterile water. One aliquot from
each sample was evaluated by electrophoresis on 1% aga-
rose electrophoresis gels to confirm amplification quality
and quantity. Low DNA Mass Ladder (Invitrogen
10068013, Invitrogen, Argentina) was simultaneously
run in the same electrophoresis gels to get a reliable PCR
product quantification by fluorescence comparison using
a Typhoon (GE Healthcare Life Sciences, Argentina) digi-
talization machine and software.
BMC Plant Biology 2008, 8:11 />Page 13 of 18
(page number not for citation purposes)
Spotting, microarray construction and post-print
processing
Five μl form each of the purified PCR cDNA products (317
in total) were transferred into a 384 well plate containing 5
μl of DMSO 100% and spotted onto coated glass-slides
(Ultragap II, Corning Systems, USA) by Gentron Genomic
Services (Gentron, Buenos Aires, Argentina), using VersAr-
ray Chip Writer (BioRad, USA). The array design consisted
in 4 supergrids, each containing 6 subgrids of 64 spots each
(8 × 8), being each cDNA printed in quadruplicate. Three
clones corresponding to house mouse (Mus musculus) were
used as negative controls [GenBank: NM009060
,
NM008690
, NM019476] while actin and rRNA sequences
from sunflower (H. annuus) [GenBank: AAF82805
] were
used as a positive control for expression analysis in all
microarray slides. The printed arrays were cross-linked to
the slide by UV irradiation at 250 mJ using UV Stratalinker
2400 (Stratagene, USA). The slides were stored in a dessica-
tor chamber until use. All the slides were hybridized with a
pooled control RNA used as reference hybridization.
The microarray derived data platform was entered in The
Gene Expression Omnibus database [117,118] from
which a platform accession number was assigned [GEO:
GPL 4366]. Thus, complete tables of sequence identifiers
and organ-specific unigenes accession numbers printed
on arrays are available [50].
RNA, extraction, purification, amplification and labeling
Total RNA was extracted from approximately 2 g of leaf
tissue using TRIzol
®
reagent following manufacturer rec-
ommendations (Invitrogen, Argentina). RNA integrity
was analyzed by checking its electrophoretic mobility on
1.5% agarose gels in ME buffer (400 mM MOPS, 100 mM
Na acetate, 10 mM EDTA pH 8.0, in diethyl-pyrocar-
bonate treated water). RNA was further purified by use of
RNeasy Mini columns (Qiagen, Germany) according to
manufacturer's instructions. To control biological varia-
tion between individuals, three biological samples from
the same tissue were pooled on one sample prior to probe
preparation. The reference (control) sample consisted of
pooled RNA extracted from sunflower seedlings growing
under unaltered environmental greenhouse conditions,
whereas chilling and salinity samples were RNA extracted
from sunflower seedlings growing in greenhouse under
those stressed conditions.
The RNA (800 ng) samples were labeled by using Super-
Script Indirect RNA Amplification System Kit (Invitrogen,
Argentina) based on the method previously reported
[119]. Following RNA amplification (with the incorpora-
tion of UTP aminoallyl), labeled product was achieved by
incubating with Cy3 or Cy5 esters in alkaline media.
Microarray hybridization reactions
The microarray slides were used in order to quantify the
relative expression of ESTs in control and treated leaves by
Cy3 and Cy5 hybridization technique. Dye-swaps were
used to correct for differences in incorporation and fluo-
rescent properties of both dyes, generating a number of 9
slides per experiment (three slides for control and three
slides for each treatment) with a total number of 18 slides
considering dye-swaps hybridizations. The microarray
slides were prehybridized by incubation in 5× SSC, 0.1%
SDS, 1% BSA at 42°C. In the next day, the cover slip was
removed and the slide was washed once in 1× SSC, 0.2%
SDS (prewarmed to 42°C); once in 0.2× SSC, 0.2% SDS at
room temperature; and once in 0.1× SSC at room temper-
ature. Washes were conduced with gentle shaking at 100
rpm for 5 minutes. Slides were subjected to low speed cen-
trifugation for 2 min at 500 rpm to dry them.
Slide scanning and signal quantitation
The hybridized slides were scanned using a VersArray
Chip Reader (BioRad, USA) scanner (two different chan-
nels for the two different dyes were used) at three different
detector sensitivities. Image analysis and signal quantifi-
cation were performed using free open source software
Spotfinder [120], quantifying signal intensity for each
spot. Then, data integration from multiple scanning proc-
esses was achieved.
Data normalization – Normalization within microarrays
Background subtraction was performed before calculating
ratios. The elements with either printing or hybridization
artifacts were flagged and discarded before analysis. Only
spots with an intensity of at least 1.5 times above the local
background in both channels were used for subsequent
analysis. The outcoming data from each slide were then
log transformed (using log base 2) and normalized using
3-D normalization (depending on spot intensity and it's
location in the array) (Alvarez et al., unpublished data)
using "The R statistical language" [121]. Potential artifacts
and false positives were eliminated and only those clones
that exhibited similar expression patterns between the
original hybridization and the corresponding dye swaps
were selected for further analysis [122]. A gene expression
matrix was generated and its analysis was focused on dif-
ferentially expressed genes.
Normalization between microarrays
Methodology used among biological replicates hypothe-
size that most of genes do not change their expression
level among treatments. In this context, quantiles equali-
zation or other normalization tools will not substantially
modify the change to detect patterns of different expres-
sion levels. However, according to exploratory data analy-
sis it was determined that an important fraction of the
BMC Plant Biology 2008, 8:11 />Page 14 of 18
(page number not for citation purposes)
organ-specific ESTs did show some expression level differ-
ences among treatments. So, no additional normalization
was applied under the risk of increasing the false positive
or negative identification discovery rates. In order to have
gene profiles ranged according to their experimental error,
the gene expression matrix was scaled in a gene by gene
basis, dividing by the common within-treatments stand-
ard deviation, thus generating the Gene Expression Matrix
(as it is referred in this work).
Gene expression matrix analysis
The whole analysis related to gene expression matrix was
performed using software Infostat 2006
®
[123]. A two step
procedure was used for candidate gene identification. First
an analysis of variance for every gene was performed and
only those genes having p-values lower that 5% were
retained for complementary analysis. The analysis of vari-
ance was run for a fixed effect model under a complete
random design. In a second step, the location of genes in
the space spanned by the two first principal components
of the gene expression matrix was used to filter genes and
reduce the rate of positive false discoveries. The rationality
behind this procedure is that the farther the gene is to the
origin of the space, the larger the fold change expression
level. Under this assumption, those genes located in the
periphery of the resulting bi-plot should be the most dra-
matically involved in the responses to stress. The cut-off
criterion was set as the distance-to-the-origin of the EST
T411 (contig of the EST T111, AN: BU671801). The main
basis of using this EST as cutting point was that it had
been already experimentally validated as differentially
expressed by Northern-blot and qRT-PCR. The position of
EST T411 in the distance-to-the-origin distribution corre-
sponds to the 70th percentile.
A graphical representation of the gene expressions among
treatment conditions is presented as a heatmap plot (see
Additional file 2). The average linkage method with Eucli-
dean distance was used to generate the clustering relation-
ships using the heatmap function in "The R statistical
language" [, #241].
Northern blotting
For northern blot analyses total RNA (20 ug) from leaves
was fractionated on 1.5% agarosa-MOPS 1× gel and blot-
ted onto nylon membranes (Hybond-N+, GE Healthcare
Life Sciences, Amersham, Argentina). In all cases, mem-
branes were cross-linked by UV illumination. Probes used
for northern hybridization were prepared by random
priming of the purified PCR products corresponding to
EST candidate gene clone using
[32P]
-dCTP (NEN Perkin
Elmer, USA). Hybridizations were performed at 42°C in
the presence of 50% formamide (Ambion ULTRAhyb
®
Ultrasensitive Hybridization Buffer, Ambion, USA) and
washes were also done at 42°C, according to provider's
instructions. Exposed to BIOMAX MR Kodak X-ray films
(KODAK, SIGMA Argentina) were scanned and analyzed
with the TN-image program in a Typhoon device to calcu-
late the relative signal intensities standardized with
respect to rRNA and actin sequence from sunflower [Gen-
Bank: AAF82805
] signals.
Real-time RT-PCR
To confirm the results obtained from microarrays experi-
ments, the transcript abundances of 10 differentially
expressed ESTs were tested. Gene-specific primers were
designed using Primer 3 [124]. Oligonucleotide primer
sequences are shown in Table 1. First-strand cDNA was
reverse transcribed from 500 ng of DNase treated RNA
according to manufacturer instructions (Invitrogen,
Argentina). The reaction was performed in a 30-ul volume
containing 15 ul QuantiTect™ SYBR
®
Green PCR (Qiagen,
Germany), 300 nm of each primer and 1 μl of cDNA
derived from RT product. The PCR reactions were run in
an ABI PRISM 7000 HT Sequence Detection System
(Applied Biosystems, USA) using the following program:
50°C for 2 min, 95°C for 10 min and 40 cycles of 95°C
for 15 sec and 60°C for 1 min. Following PCR amplifica-
tion, the reactions were subjected to a temperature ramp
to create the dissociation curve, measured as changes in
fluorescence readings as a function of temperature, allow-
ing the detection of non-specific products. The dissocia-
tion program was 95°C for 15 sec, 60°C for 15 sec,
followed by 20 min of slow ramp from 60°C to 95°C.
Three replicates of each reaction were performed and actin
sequence from sunflower [GenBank: AAF82805
] was used
as an internal control to normalize gene expression level.
Negative control reactions using untranscribed RNA were
also run to confirm absence of genomic DNA. Quantify-
ing the relative changes in gene expression was performed
using the 2
-ΔΔCT
method [51]. Comparative results
between qRT-PCR and microarray fold changes are pre-
sented in Table 2.
Authors' contributions
PF carried out subtracted cDNA libraries, DNA sequenc-
ing, DNA amplification for cDNA spotting, hybridization
probes and participated in data analysis and manuscript
preparation; JDR directed data microarray and statistical
analysis, LF participated in quantitative real time reac-
tions, HEH coordinated the workgroup, NP directed bio-
informatics and analytical routines and RH designed the
experiment, coordinated the whole analysis and drafted
the manuscript. All authors read and approved the final
manuscript.
BMC Plant Biology 2008, 8:11 />Page 15 of 18
(page number not for citation purposes)
Additional material
Acknowledgements
This research was supported by the ANPCyT/FONCYT; BID 1728 AC/AR
PID 267 and PAV 137 and INTA-PE 243.540. Dr. P. Fernandez holds a post-
doctoral fellowship from INTA, Luis Fernandez holds a technical position
at INTA, MSc. Julio Di Rienzo is Professor of Statistics and Biometry at
National University of Cordoba, Dr. R. Heinz and Dr. N. Paniego are career
members of the Consejo Nacional de Investigaciones Científicas y Técnicas
(CONICET, Argentina) and Dr. H.E. Hopp is a career member of the
Comisión de Investigaciones Científicas de la Provincia de Buenos Aires
(CIC) and Professor at the Facultad de Ciencias Exactas y Naturales, Uni-
versity of Buenos Aires (UBA).
References
1. National Sunflower Association [flow
ernsa.com/stats/table.asp?contentID=109&htm
lID=74&submit170=View&submit.x=57&submit.y=12)]
2. Connor D, Hall A: Sunflower physiology. Monograph No. 35. Mad-
ison, WI: ASA, CSSA, SSSA 1997.
3. Miller J, Gulya T: Registration of four maintainer (HA 382 to
HA 385) and four restorer (RHA 386 to RHA 389) sunflower
germplasm lines. Crop Science 1995, 35:286.
4. Paniego N, Heinz R, Fernandez P, Talia P, Nishinakamasu V, Hopp H:
Sunflower. In Genome Mapping and Molecular Breeding in Plants Vol-
ume 2. Edited by: Kole C. Berlin Heidelberg: Springer-Verlag;
2007:153-177.
5. Pradeep KA, Parinita A, Reddy M, Sopory Sudhir K: Role of DREB
transcription factors in abiotic and biotic stress tolerance in
plants. Plant Cell Reports 2006, 25(12):1263.
6. Seki M, Narusaka M, Abe H, Kasuga M, Yamaguchi-Shinozaki K, Carn-
inci P, Hayashizaki Y, Shinozaki K: Monitoring the expression pat-
tern of 1300 Arabidopsis genes under drought and cold
stresses by using a full-length cDNA microarray. Plant Cell
2001, 13(1):61-72.
7. Zhu JK: Plant salt tolerance. Trends Plant Sci 2001, 6(2):66-71.
8. Sahi C, Singh A, Kumar K, Blumwald E, Grover A: Salt stress
response in rice: genetics, molecular biology, and compara-
tive genomics. Funct Integr Genomics 2006, 6(4):263-284.
9. Bray E: Plant responses to water deficit. Trends in Plant Science
1997, 2:48-54.
10. Shinozaki K, Yamaguchi-Shinozaki K, Seki M: Regulatory network
of gene expression in the drought and cold stress responses.
Curr Opin Plant Biol 2003, 6(5):410-417.
11. Yamaguchi-Shinozaki K, Shinozaki K: Organization of cis- acting
regulatory elements in osmotic- and cold stress-responsive
promoters. Trends in Plant Science 2005, 10:1360-1385.
12. Thomashow MF: Plant Cold Acclimation: Freezing Tolerance
Genes and Regulatory Mechanisms. Annu Rev Plant Physiol Plant
Mol Biol 1999, 50:
571-599.
13. Kanesaki Y, Suzuki I, Allakhverdiev SI, Mikami K, Murata N: Salt
stress and hyperosmotic stress regulate the expression of
different sets of genes in Synechocystis sp. PCC 6803. Biochem
Biophys Res Commun 2002, 290(1):339-348.
14. Sahi C, Agarwal M, Reddy MK, Sopory SK, Grover A: Isolation and
expression analysis of salt stress-associated ESTs from con-
trasting rice cultivars using a PCR-based subtraction
method. Theor Appl Genet 2003, 106(4):620-628.
15. Kore-eda S, Cushman MA, Akselrod I, Bufford D, Fredrickson M,
Clark E, Cushman JC: Transcript profiling of salinity stress
responses by large-scale expressed sequence tag analysis in
Mesembryanthemum crystallinum. Gene 2004, 341:83-92.
16. Marin K, Kanesaki Y, Los DA, Murata N, Suzuki I, Hagemann M: Gene
expression profiling reflects physiological processes in salt
acclimation of Synechocystis sp. strain PCC 6803. Plant Physiol
2004, 136(2):3290-3300.
17. Sottosanto JB, Gelli A, Blumwald E: DNA array analysis of Arabi-
dopsis thaliana lacking a vacuolar Na+/H+ antiporter: impact
of AtNHX1 on gene expression. Plant J 2004, 40(5):752-771.
18. Taji T, Seki M, Satou M, Sakurai T, Kobayashi M, Ishiyama K, Narusaka
Y, Narusaka M, Zhu JK, Shinozaki K: Comparative genomics in
salt tolerance between Arabidopsis and Arabidopsis-related
halophyte salt cress using Arabidopsis microarray. Plant Physiol
2004, 135(3):1697-1709.
19. Shiozaki N, Yamada M, Yoshiba Y: Analysis of salt-stress-induci-
ble ESTs isolated by PCR-subtraction in salt-tolerant rice.
Theor Appl Genet 2005, 110(7):1177-1186.
20. Shinozaki K, Yamaguchi-Shinozaki K: Molecular responses to
dehydration and low temperature: differences and cross-talk
between two stress signaling pathways. Curr Opin Plant Biol
2000, 3(3):217-223.
21. Seki M, Narusaka M, Ishida J, Nanjo T, Fujita M, Oono Y, Kamiya A,
Nakajima M, Enju A, Sakurai T, Satou M, Akiyama K, Taji T,
Yamaguchi-Shinozaki K, Carninci P, Kawai J, Hayashizaki Y, Shinozaki
K:
Monitoring the expression profiles of 7000 Arabidopsis
genes under drought, cold and high-salinity stresses using a
full-length cDNA microarray. Plant J 2002, 31(3):279-292.
22. Chinnusamy V, Jagendorf A, Zhu J: Understanding and improving
salt tolerance in plants. Crop Science 2005, 45:437-448.
Additional file 1
Candidate genes (80) detected among treatments according top-value
in median comparison and PCA analysis. (1) Functional category is
based on the Gene Ontology Project. Letters in brackets refer to the corre-
sponding ontology category (B: biological process, C: cellular component
and M: molecular function). (2) The "relative to control expression" col-
umn indicates gene expression change as "Up"/"Down" regulated or no
changed ("NC") compared to the control, based on the analysis of vari-
ance. Differences between control and stress conditions are evaluated con-
sidering the variance of experimental error of each gene.
Click here for file
[ />2229-8-11-S1.pdf]
Additional file 2
Expression profile of selected candidate genes. Ctrl1 = control leaf 1,
Ctrl2 = control leaf 2, C1 = cold leaf 1, C2 = cold leaf 2, C3 = cold leaf
3, S1: salinity leaf 1, S2 = salinity leaf 2, S3 = salinity leaf 3.
Click here for file
[ />2229-8-11-S2.pdf]
Additional file 3
Heatmap plot of the 80 genes identified as differentially expressed
between treatments. Ctrl1 = control leaf 1, Ctrl2 = control leaf 2, C1 =
cold leaf 1, C2 = cold leaf 2, C3 = cold leaf 3, S1: salinity leaf 1, S2 =
salinity leaf 2, S3 = salinity leaf. 3.
Click here for file
[ />2229-8-11-S3.pdf]
Additional file 4
qRT-PCR for differentially expressed candidate genes. Normalized
report ( Rn) vs. cycle for the ten candidate genes validated. CtrlL = control
leaf, CL = cold leaf, SL: salinity leaf. Sunflower actin [GenBank:
AAF82805
) was used as reference "housekeeping" gene. Three biological
samples were tested starting from the same RNA used as microarray
hybridization probe. The average value for each of them was calculated
and analysed in the graph.
Click here for file
[ />2229-8-11-S4.pdf]
BMC Plant Biology 2008, 8:11 />Page 16 of 18
(page number not for citation purposes)
23. Wolfraim LA, Langis R, Tyson H, Dhindsa RS: cDNA sequence,
expression, and transcript stability of a cold acclimation-spe-
cific gene, cas18, of alfalfa (Medicago falcata) cells. Plant Physiol
1993, 101(4):1275-1282.
24. Gilmour SJ, Artus NN, Thomashow MF: cDNA sequence analysis
and expression of two cold-regulated genes of Arabidopsis
thaliana. Plant Mol Biol 1992, 18(1):13-21.
25. Nordin K, Heino P, Palva ET: Separate signal pathways regulate
the expression of a low-temperature-induced gene in Arabi-
dopsis thaliana (L.) Heynh. Plant Mol Biol 1991, 16(6):1061-1071.
26. Yamaguchi-Shinozaki K, Shinozaki K: Characterization of the
expression of a desiccation-responsive rd29 gene of Arabi-
dopsis thaliana and analysis of its promoter in transgenic
plants. Mol Gen Genet 1993, 236(2–3):331-340.
27. Dunn MA, Hughes MA, Zhang L, Pearce RS, Quigley AS, Jack PL:
Nucleotide sequence and molecular analysis of the low tem-
perature induced cereal gene, BLT4. Mol Gen Genet 1991,
229(3):389-394.
28. Houde M, Dhindsa RS, Sarhan F: A molecular marker to select
for freezing tolerance in Gramineae. Mol Gen Genet 1992,
234(1):43-48.
29. Oullet F, Vazquez-Tello A, Sarhan F: The wheat wcs120 promoter
is cold-inducible in both monocotyledonous and dicotyledo-
nous species. FEBS Letters 1998, 423:324-328.
30. Ingram J, Bartels D: The Molecular Basis of Dehydration Toler-
ance in Plants. Annu Rev Plant Physiol Plant Mol Biol 1996,
47:377-403.
31. Viswanathan C, Zhu JK: Molecular genetic analysis of cold-reg-
ulated gene transcription. Philos Trans R Soc Lond B Biol Sci 2002,
357(1423):877-886.
32. Maruyama K, Sakuma Y, Kasuga M, Ito Y, Seki M, Goda H, Shimada Y,
Yoshida S, Shinozaki K, Yamaguchi-Shinozaki K: Identification of
cold-inducible downstream genes of the Arabidopsis
DREB1A/CBF3 transcriptional factor using two microarray
systems. Plant J 2004, 38(6):982-993.
33. Dubouzet JG, Sakuma Y, Ito Y, Kasuga M, Dubouzet EG, Miura S, Seki
M, Shinozaki K, Yamaguchi-Shinozaki K: OsDREB genes in rice,
Oryza sativa L., encode transcription activators that function
in drought, high-salt and cold-responsive gene expression.
Plant J 2003, 33(4):751-763.
34. Fowler S, Thomashow MF: Arabidopsis transcriptome profiling
indicates that multiple regulatory pathways are activated
during cold acclimation in addition to the CBF cold response
pathway. Plant Cell 2002, 14(8):1675-1690.
35. Hewezi T, Leger M, El Kayal W, Gentzbittel L: Transcriptional pro-
filing of sunflower plants growing under low temperatures
reveals an extensive down-regulation of gene expression
associated with chilling sensitivity. J Exp Bot 2006,
57(12):3109-3122.
36. Karrenberg S, Edelist C, Lexer C, Rieseberg L: Response to salinity
in the homoploid hybrid species Helianthus paradoxus and its
progenitors H. annuus and H. petiolaris. New Phytol 2006,
170(3):615-629.
37. Kawasaki S, Borchert C, Deyholos M, Wang H, Brazille S, Kawai K,
Galbraith D, Bohnert HJ: Gene expression profiles during the
initial phase of salt stress in rice. Plant Cell 2001, 13(4):889-905.
38. Renaut J, Lutts S, Hoffmann L, Hausman J: Responses of poplar to
chilling temperatures: proteomic and physiological aspects.
BMC Plant Biology 2004, 6:81-90.
39. Cramer G, Ergül A, Grimplet J, Tillett R, Tattersall E, Bohlman M, Vin-
cent D, Sonderegger J, Evans J, Osborne C, Quilici D, Schlauch K,
Schooley D, Cushman J: Water and salinity stress in grapevines:
early and late changes in transcript and metabolite profiles.
Funct Integ Genomics 2007, 7:111-134.
40. Ozturk Z, Talamé V, Deyholos M, Michalowski C, Galbraith D,
Gozukirmizi N, Tuberosa R, Bohnert H: Monitoring large-scale
changes in transcript abundance in drought- and salt
stressed barley. Plant Molecular Biology 2002, 48:551-573.
41. Ueda A, Kathiresan A, Inada M, Narita Y, Nakamura T, Shi W, Takabe
T, Bennett J: Osmotic stress in barley regulates expression of
a different set of genes than salt stress does. Journal of Experi-
mental Botany 2005, 55:2213-2218.
42. Mittler R: Abiotic stress, the field environment and stress
combination. Trends in Plant Science 2006, 11(1):15-19.
43. Timms L, Jimenez R, Chase M, Lavelle D, McHale L, Kozik A, Lai Z,
Heesacker A, Knapp S, Rieseberg L, Michelmore R, Kesseli R: Anal-
yses of synteny between Arabidopsis thaliana and species in
the Asteraceae reveal a complex network of small syntenic
segments and major chromosomal rearrangements. Genetics
2006, 173(4):2227-2235.
44. Horvath D, Anderson J, Soto Suarez M, Chao W: Transcriptome
analysis of "leafy spurge" (Euphorbia esula) crown buds dur-
ing shifts in well-defined phases of dormancy. Weed Science
2006, 54(5):821-827.
45. Kratsch H, Wise R: The ultrastructure of chilling stress. Plant
Cell and Environment 2000, 23:337-350.
46. Huang L, Ye Z, Bell RW, Dell B: Boron nutrition and chilling tol-
erance of warm climate crop species. Ann Bot (Lond) 2005,
96(5):755-767.
47. Lai Z, Livingstone K, Zou Y, Church SA, Knapp SJ, Andrews J, Riese-
berg LH: Identification and mapping of SNPs from ESTs in
sunflower. Theor Appl Genet 2005, 111(8):1532-1544.
48. Liu X, Baird W: Differential expression of genes regulated in
response to drought or salinity stress in sunflower. Crop Sci-
ence 2003, 43:678-687.
49. Roche J, Hewezi T, Bouniols A, Gentzbittel L: Transcriptional pro-
files of primary metabolism and signal transduction-related
genes in response to water stress in field-grown sunflower
genotypes using a thematic cDNA microarray. Planta 2007.
50. Fernandez P, Paniego N, Lew S, Hopp HE, Heinz RA: Differential
representation of sunflower ESTs in enriched organ-specific
cDNA libraries in a small scale sequencing project. BMC
Genomics
2003, 4(1):40.
51. Livak K, Schmittgen T: Analysis of relative gene expression data
using real-time quantitative PCR and the 2
-ΔΔCt
method.
Methods 2001, 25:402-408.
52. Forment J, Gadea J, Huerta L, Abizanda J, Agusti S, Alamar E, Alos F,
Andres R, Arribas J, Beltran A, Berbel M, Blazquez J, Brumos L, Canas
M, Cercos J, Colmenero-Flores A, Conesa B, Estables M, Gandia J,
Garcia-Martinez J, Gimeno A, Gisbert G, Gomez L, Gonzalez-Cande-
las A, Granell J, Guerri M, F L, Madueno J, Marcos M, Marques F, Mar-
tinez M, Martinez-Godoy S, Miralles P, Moreno L, Navarro V, Pallas
M, Perez-Amador J, Perez-Valle C, Pons I, Rodrigo P, Rodriguez C,
Royo R, Serrano G, Soler F, Tadeo M, Talon J, Terol M, Trenor L,
Vaello O, Vicente C, Vidal L, Zacarias L, Conejero V: Development
of a citrus genome-wide EST collection and cDNA microar-
ray as resources for genomic studies. Plant Molecular Biology
2005, 57:375-391.
53. Verslues PE, Bray EA: Role of abscisic acid (ABA) and Arabidop-
sis thaliana ABA-insensitive loci in low water potential-
induced ABA and proline accumulation. J Exp Bot 2006,
57(1):201-212.
54. Chinnusamy V, Schumaker K, Zhu JK: Molecular genetic perspec-
tives on cross-talk and specificity in abiotic stress signaling in
plants. J Exp Bot 2004, 55(395):225-236.
55. Chinnusamy V, Ohta M, Kanrar S, Lee BH, Hong X, Agarwal M, Zhu
JK: ICE1: a regulator of cold-induced transcriptome and
freezing tolerance in Arabidopsis. Genes Dev 2003,
17(8):1043-1054.
56. Allison D, Xiangquin C, Grier P, Sabripour M: Microarray data
analysis: from disarray to consolidation and consensus.
Nature Reviews Genetics 2006, 7:55-65.
57. Lemaire-Chamley M, Petit J, Garcia V, Just D, Baldet P, Germain V,
Fagard M, Mouassite M, Cheniclet C, Rothan C: Changes in tran-
scriptional profiles are associated with early fruit tissue spe-
cialization in tomato. Plant Physiol 2005, 139(2):750-769.
58. Reymond P, Weber H, Damond M, Farmer EE: Differential gene
expression in response to mechanical wounding and insect
feeding in Arabidopsis. Plant Cell 2000, 12(5):707-720.
59. Xiong L, Schumaker KS, Zhu JK: Cell signaling during cold,
drought, and salt stress. Plant Cell 2002:S165-183.
60. Ma S, Gong Q, Bohnert J: Dissecting salt stress pathways. Journal
of Experimental Botany 2005, 57(5):
1097-1107.
61. Jiang Y, Deyholos MK: Comprehensive transcriptional profiling
of NaCl-stressed Arabidopsis roots reveals novel classes of
responsive genes. BMC Plant Biol 2006, 6:25.
BMC Plant Biology 2008, 8:11 />Page 17 of 18
(page number not for citation purposes)
62. Kreps JA, Wu Y, Chang HS, Zhu T, Wang X, Harper JF: Transcrip-
tome changes for Arabidopsis in response to salt, osmotic,
and cold stress. Plant Physiol 2002, 130(4):2129-2141.
63. Lee J, Prasad V, Yang P, Wu J, David Ho T, Charng Y, Chan M:
Expression of Arabidopsis CBF1 regulated by an ABA/stress
inducible promoter in transgenic tomato confers stress tol-
erance without affecting yield. Plant Cell and Environment 2003,
26(7):1181.
64. Camon E, Magrane M, Barrell D, Binns D, Fleischmann W, Kersey P,
Mulder N, Oinn T, Maslen J, Cox A, Apweiler R: The Gene Ontol-
ogy Annotation (GOA) project: implementation of GO in
SWISS-PROT, TrEMBL, and InterPro. Genome Res 2003,
13(4):662-672.
65. Ashburner M, Ball CA, Blake JA, Botstein D, Buttler H, Cherry JM,
Davis AP, Dolinsky K, Dwight SS, Eppig JT: Gene Ontology tool for
the unification of biology. Nature Genetics 2000, 25:25-29.
66. Martino-Catt S, Ort DR: Low temperature interrupts circadian
regulation of transcriptional activity in chilling-sensitive
plants. Proc Natl Acad Sci U S A 1992, 89(9):3731-3735.
67. Kee S, Martin B, Ort R: The effects of chilling in the dark and in
the light on photosynthesis of tomato: electron transfer
reactions. Photosynthesis research 1986, 8:41-51.
68. Percival M, Bradbury M, Hayden D, Baker N: Modification of the
photochemical apparatus in maize by photoinhibitory stress
at low temperature. Volume 4. Dordrecht, The Netherlands: Mar-
tinus Nijhoff; 1987.
69. Sassenrath G, Ort D, Portis A: Impaired reductive activation of
stromal biphosphatases in tomato leaves following low-tem-
perature exposure at high light. Arch Biochem Biophys 1991,
202:302-308.
70. Walker R, Torofalvy E, Subton W: Photosynthetic responses of
Citrus varieties Rangpur lime and Etrog Citron to salt treat-
ment. Australian Journal of Plant Pathology 1982, 9:783-790.
71. Ghosh S, Bagchi S, Majumder A: Chloroplast fructose-1,6-biphos-
phatase from Oryza differs in salt tolerance property from
the Porteresia enzyme and is protected by osmolytes. Plant
Science 2001, 160:1171-1181.
72. Hurry V, Hunner N: Low growth temperature effects a differ-
ential inhibition of photosynthesis in spring and winter-
wheat. Plant Physiology 1991, 93:491-497.
73. Levitt J: Chilling, freezing, and high temperature stresses.
New York 1980.
74. Strand Å, Hurry V, Gustafsson P, Gardeström P: Development of
Arabidopsis thaliana leaves at low temperatures releases the
suppression of photosynthesis and photosynthetic gene
expression despite the accumulation of soluble carbohy-
drates. Plant Journal 1997, 12:605-614.
75. Hasegawa P, Bressan R, Zhu J, Bohnert H: Plant cellular and
molecular responses to high salinity. Annual Review of Plant Phys-
iology and Plant Molecular Biology 2000, 51:463-499.
76. Chen W, Provart N, Glazebrook J, Katagiri F, Chang H, Eulgem T,
Mauch F, Luan S, Zou G, Whitham S, Budworth P, Tao Y, Xie Z, Chen
X, Lam S, Kreps J, Harper J, Si-Ammour A, Mauch-Mani B, Heinlein M,
Kobayash iK, Hohn T, Dangl J, Wang X, Zhu T: Expression profile
matrix of Arabidopsis transcription factor genes suggests
their putative functions in response to environmental
stresses. The Plant Cell 2002, 14:559-574.
77. Dhanaraj A, Alkharouf N, Beard H, Chouikha I, Matthews B, Wei H,
Arora R, Rowland L: Major differences observed in transcript
profiles of blueberry during cold acclimation under field and
cold room conditions. Planta 2006.
78. Yamada S, Toshiyuki K, Akiko H, Kuwata S, Hidemasa I, Tomoaki K:
Differential expression of plastidic aldolase genes in Nico-
tiana plants under salt stress. Plant Science 2000, 154:61-69.
79. Hoshida H, Tanaka Y, Hibino T, Hayashi Y, Tanaka A, Takabe T:
Enhanced tolerance to salt stress in transgenic rice that
overexpresses chloroplast glutamine synthetase. Plant Molec-
ular Biology 2000, 43(103–111):.
80. Estruch F: Stress-controlled transcription factors, stress-
induced genes and stress tolerance in budding yeast. FEMS
Microbiol Rev 2000, 25:
469-486.
81. Rodriguez Milla M, Townsend J, Feng Chang I, Cushman J: The Ara-
bidopsis AtDi19 gene family encodes a novel type of Cys2/
His2 zinc-finger protein implicated in ABA-independent
dehydration, high-salinity stress and light signaling pathways.
Plant Molecular Biology 2006, 61:13-30.
82. Szathmáry E, Jordán F, Pál C: Can genes explain biological com-
plexity? Science 2001, 292:1315-1316.
83. Arabidopsis GI: Analysis of the genome sequence of the flow-
ering plant Arabidopsis thaliana. Nature 2000, 408:796-815.
84. Liu J, Zhu JK: A calcium sensor homolog required for plant salt
tolerance. Science 1998, 280(5371):1943-1945.
85. Nagashima A, Hanaoka M, Motohashi R, Seki M, Shinozaki K, Kan-
amaru K, Takahashi H, Tanaka K: DNA microarray analysis of
plastid gene expression in an Arabidopsis mutant deficient in
a plastid transcription factor sigma, SIG2. Biosci Biotechnol Bio-
chem 2004, 68(3):694-704.
86. Manavella PA, Arce AL, Dezar CA, Bitton F, Renou JP, Crespi M, Chan
RL: Cross-talk between ethylene and drought signaling path-
ways is mediated by the sunflower Hahb-4 transcription fac-
tor. Plant J 2006, 48(1):125-137.
87. Mahalingam R, Gomez-Buitrago A, Eckardt N, Shah N, Guevara-Gar-
cia A, Day P, Raina R, Fedoroff Nina V: Characterizing the stress/
defense transcriptome of Arabidopsis. Genome Biology 2003,
4:R20.
88. Song X, Yang C, Liu J, Yang W: RPA, a class II ARFGAP protein,
activates ARF1 and U5 and plays a role in root hair develop-
ment in Arabidopsis. Plant Physiology 2006, 141(3):.
89. Han S, Tang R, Anderson L, Woerner T, Pei Z: A cell surface
receptor mediates extracellular Ca
2+
sensing in guard cells.
Nature 2003, 425:196-200.
90. Thomashow MF: So what's new in the field of plant cold accli-
mation? Lots! Plant Physiol 2001, 125(1):89-93.
91. Choi H, Park HJ, Park JH, Kim S, Im MY, Seo HH, Kim Y-W, Hwang
I, Kim SY: Arabidopsis Calcium-Dependent Protein Kinase
AtCPK32 interacts with ABF4, a transcriptional regulator of
abscisic acid-responsive gene expression, and modulates its
activity. Plant Physiology 2005, 139(4):.
92. Wan B, Lin Y, Mou T: Expression of rice Ca
(2+)
-dependent pro-
tein kinases (CDPKs) genes under different environmental
stresses. FEBS Letters 2007, 581(6):1179-1189.
93. Wood A, Oliver M: Translational control in plant stress: for-
mation of messenger ribonucleoprotein complexes
(mRNPs) in Tortula ruralis in response to desiccation. Plant
Journal 1999, 18:359-370.
94. Wool I: Extraribosomal functions of ribosomal proteins.
Trends in Biochemical Sciences 1996, 21:164-165.
95. Harding H, Calfon M, Urano F, Novoa I, Ron D: Transcriptional
and translational control in the mammalian unfolded protein
response. Annu Rev Cell Dev Biol 2002, 18:575-599.
96. Vierstra R, Callis J: Polypeptide tags, ubiquitous modifiers for
plant protein regulation. Plant Molecular Biology 1999, 41:435-442.
97. Cui S, Huang F, Wang J, Ma X, Cheng Y, Liu J: A proteomic analysis
of cold stress response in rice seedlings. Proteomics 2005,
5:3162-3172.
98. Mira H, Martínez-García F, Peñarrubia L: Evidence for the plant-
specific intercellular transport of the Arabidopsis copper
chaperone CCH. Plant Journal 2001, 25:521-528.
99. Grover A: Molecular biology of stress responses. Cell Stress and
Chaperones 2002, 1:1-5.
100. Mittler R: Oxidative stress, antioxidants, and stress tolerance.
Plant Science 2002, 7:405-410.
101. Prasad T, Anderson M, Martin B, Stewart C: Evidence for chilling-
induced oxidative stress in maize seedlings and a regulatory
role for hydrogen peroxide. The Plant Cell 1994, 6(1):65-74.
102. Lai Z, Gross BL, Zou Y, Andrews J, Rieseberg LH: Microarray anal-
ysis reveals differential gene expression in hybrid sunflower
species. Mol Ecol 2006, 15(5):1213-1227.
103. Jang J, Kim D, Kim Y, Kim J, Kang H: An expression analysis of a
gene family encoding plasma membrane aquaporins in
response to abiotic stresses in Arabidopsis thaliana. Plant
Molecular Biology 2004, 54:713-725.
104. Zhu J: Salt and drought stress signal transduction in plants.
Annu Rev Plant Biol 2002, 53:247-273.
105. Blumwald E, Grover A: Salt tolerance. UK: John Wiley and Sons
Ltd; 2006.
106. Walia E, Wilson C, Zeng L, Ismail A, Condamine P, Close T:
Genome-wide transcriptional analysis of salinity stressed
japonica and indica rice genotypes during panicle initiation
stage. Plant Molecular Biology 2007, 63:609-623.
Publish with BioMed Central and every
scientist can read your work free of charge
"BioMed Central will be the most significant development for
disseminating the results of biomedical research in our lifetime."
Sir Paul Nurse, Cancer Research UK
Your research papers will be:
available free of charge to the entire biomedical community
peer reviewed and published immediately upon acceptance
cited in PubMed and archived on PubMed Central
yours — you keep the copyright
Submit your manuscript here:
/>BioMedcentral
BMC Plant Biology 2008, 8:11 />Page 18 of 18
(page number not for citation purposes)
107. Torres-Schumann S, Godoy J, Pintor-Toro J: A probable lipid
transfer protein gene is induced by NaCl stems of tomato
plants. Plant Molecular Biology 1992, 18:749-757.
108. Holmberg N, Bülow L: Improving stress tolerance in plants by
gene transfer. Trends in Plant Science 1998, 3:61-66.
109. Nieuwland J, Feron R, Huisman B, Fasolino A, Hilbers C, Derksen J,
Mariani C: Lipid transfer proteins enhance cell wall extension
in tobacco. The Plant Cell 2005, 7:2007-2019.
110. Das-Chatterjee A, Goswami L, Maitra S, Ghosh Dastidar K, Ray S,
Majumder A: Introgression of a novel salt-tolerant L-myo-
inositol 1-phosphate synthase from Porteresia coarctata
(Roxb.) Tateoka (PcINO1) confers salt tolerance to evolu-
tionary diverse organisms. FEBS Letters 2006, 580:3980-3988.
111. Chun J-A, Jin U-H, Lee J-W, Yi Y-B, Hyung N-I, Kang M-H, Pyee J-H,
Suh M, Kang C-W, Seo H-Y, Lee S-W, Chung C-H: Isolation and
characterization of a myo-inositol 1-phosphate synthase
cDNA from developing sesame (Sesamum indicum L.) seeds:
functional and differential expression, and salt-induced tran-
scription during germination. Planta 2003, 216:874-880.
112. Nelson D, Rammesmayer G, Bohnert H: Regulation of cell-spe-
cific inositol metabolism and transport in plant salinity toler-
ance. The Plant Cell 1998, 10:753-764.
113. Nelson D, Koukoumanos M, Bohnert H: Myo-inositol-dependent
sodium uptake in ice plant. Plant Physiology 1999, 119:165-172.
114. Ishitani M, Majumder A, Bornhouser A, Michalowski C, Jensen R,
Bohnert H: Coordinate transcriptional induction of myo-inosi-
tol metabolism during environmental stress. Plant Journal
1996, 9:537-548.
115. Terol J, Conesa A, Colmenero J, Cercos M, Tadeo F, Agustí J, Alós E,
Andres F, Soler G, Brumos J, Iglesias D, Stefan G, Legaz F, Argout X,
Courtois B, Ollitrault P, Dossat C, Wincker P, Morillon R, Talon M:
Analysis of 13,000 unique Citrus clusters associated with fruit
quality, production and salinity tolerance. BMC Genomics 2007,
8(31):.
116. Altschul S, Gish W, Miller W, Myers E, Lipman D:
Basic local align-
ment search tool. Journal of Molecular Biology 1990, 215:403-410.
117. Edgar R, Domrachev M, Lash A: Gene Expression Omnibus:
NCBI gene expression and hybridization array data reposi-
tory. Nucleic Acid Research 2002, 30(1):207-210.
118. Barrett T, Troup D, Wilhite S, Ledoux P, Rudnev D, Evangelista C,
Kim I, Soboleva A, Tomashevsky M, Edgar R: NCBI GEO: mining
tens of millions of expression profiles-database and tools
update. Nucleic Acid Research 2006:760-765.
119. Eberwine J, Spencer C, Miyashiro K, Mackler S, Finnell R: Comple-
mentary DNA synthesis in situ: methods and applications.
1992.
120. Saeed A, Sharov V, White J, Li J, Liang W, Bhagabati N, Braisted J,
Klapa M, Currier T, Thiagarajan M, Sturn A, Snuffin M, Rezantsev A,
Popov D, Ryltsov A, Kostukovich E, Borisovsky I, Liu Z, Vinsavich A,
Trush V, Quackenbush J: TM4: a free, open-source system for
microarray data management and analysis. Biotechniques 2003,
34(2):374-378.
121. "The R statistical language" [ />]
122. Yang Y, Dudoit S, Luu P, Lin D, Peng V, Ngai J, Speed T: Normaliza-
tion for cDNA microarray data: a robust composite method
addressing single and multiple slide systematic variation.
Nucleic Acid Research 2002, 30(4):e15.
123. Infostat 2006
®
[]
124. Rozen S, Skaletsky H: Primer3 on the WWW for general users
and for biologist programmers. Totowa, NJ: Humana Press;
2000.
Publish with BioMed Central and every
scientist can read your work free of charge
"BioMed Central will be the most significant development for
disseminating the results of biomedical research in our lifetime."
Sir Paul Nurse, Cancer Research UK
Your research papers will be:
available free of charge to the entire biomedical community
peer reviewed and published immediately upon acceptance
cited in PubMed and archived on PubMed Central
yours — you keep the copyright
Submit your manuscript here:
/>BioMedcentral