báo cáo khoa học: " Comparative BAC end sequence analysis of tomato and potato reveals overrepresentation of specific gene families in potato" doc
Bạn đang xem bản rút gọn của tài liệu. Xem và tải ngay bản đầy đủ của tài liệu tại đây (383.49 KB, 16 trang )
BioMed Central
Page 1 of 16
(page number not for citation purposes)
BMC Plant Biology
Open Access
Research article
Comparative BAC end sequence analysis of tomato and potato
reveals overrepresentation of specific gene families in potato
Erwin Datema
1,2
, Lukas A Mueller
3
, Robert Buels
3
, James J Giovannoni
4
,
Richard GF Visser
5
, Willem J Stiekema
2,6
and Roeland CHJ van Ham*
1,2
Address:
1
Applied Bioinformatics, Plant Research International, PO Box 16, 6700 AA, Wageningen, The Netherlands,
2
Laboratory of
Bioinformatics, Wageningen University, Transitorium, Dreijenlaan 3, 6703 HA Wageningen, The Netherlands,
3
Department of Plant Breeding and
Genetics, Cornell University, Ithaca, New York 14853, USA,
4
United States Department of Agriculture and Boyce Thompson Institute for Plant,
Research, Cornell University, Ithaca, New York 14853, USA,
5
Laboratory of Plant Breeding, Wageningen University, P.O. Box 386, 6700 AJ
Wageningen, The Netherlands and
6
Centre for BioSystems Genomics (CBSG), PO Box 98, 6700 AB Wageningen, The Netherlands
Email: Erwin Datema - ; Lukas A Mueller - ; Robert Buels - ;
James J Giovannoni - ; Richard GF Visser - ; Willem J Stiekema - ;
Roeland CHJ van Ham* -
* Corresponding author
Abstract
Background: Tomato (Solanum lycopersicon) and potato (S. tuberosum) are two economically
important crop species, the genomes of which are currently being sequenced. This study presents
a first genome-wide analysis of these two species, based on two large collections of BAC end
sequences representing approximately 19% of the tomato genome and 10% of the potato genome.
Results: The tomato genome has a higher repeat content than the potato genome, primarily due
to a higher number of retrotransposon insertions in the tomato genome. On the other hand,
simple sequence repeats are more abundant in potato than in tomato. The two genomes also differ
in the frequency distribution of SSR motifs. Based on EST and protein alignments, potato appears
to contain up to 6,400 more putative coding regions than tomato. Major gene families such as
cytochrome P450 mono-oxygenases and serine-threonine protein kinases are significantly
overrepresented in potato, compared to tomato. Moreover, the P450 superfamily appears to have
expanded spectacularly in both species compared to Arabidopsis thaliana, suggesting an expanded
network of secondary metabolic pathways in the Solanaceae. Both tomato and potato appear to
have a low level of microsynteny with A. thaliana. A higher degree of synteny was observed with
Populus trichocarpa, specifically in the region between 15.2 and 19.4 Mb on P. trichocarpa
chromosome 10.
Conclusion: The findings in this paper present a first glimpse into the evolution of Solanaceous
genomes, both within the family and relative to other plant species. When the complete genome
sequences of these species become available, whole-genome comparisons and protein- or repeat-
family specific studies may shed more light on the observations made here.
Published: 11 April 2008
BMC Plant Biology 2008, 8:34 doi:10.1186/1471-2229-8-34
Received: 5 October 2007
Accepted: 11 April 2008
This article is available from: />© 2008 Datema et al; licensee BioMed Central Ltd.
This is an Open Access article distributed under the terms of the Creative Commons Attribution License ( />),
which permits unrestricted use, distribution, and reproduction in any medium, provided the original work is properly cited.
BMC Plant Biology 2008, 8:34 />Page 2 of 16
(page number not for citation purposes)
Background
The Solanaceae, or Nightshade family, is a dicot plant fam-
ily that includes many economically important genera
that are used in agriculture, horticulture, and other indus-
tries. Family members include the tuber bearing potato
(Solanum tuberosum); a large number of fruit-bearing veg-
etables, such as peppers (Capsicum spp), tomatoes (S. lyco-
persicum), and eggplant (S. melongena); leafy tobacco
(Nicotiana tabacum); and ornamental flowers from the
Petunia and Solanum genera.
Tomato is generally considered to be a model crop plant
species, for which many high-quality genetic and genomic
resources are available, such as high-density molecular
maps [1], many well-characterized near-isogenic lines
(NILs), and rich collections of ESTs and full-length cDNAs
[2,3]. Potato is the most important crop within the
Solanaceae, ranking fourth as a world food crop following
wheat, maize and rice. Similar resources are available for
potato, including an ultra-high density linkage map [4], a
collection of phenotype data [5], and a large transcript
database [6]. Like most other nightshades, tomato and
potato both have a basic chromosome number of twelve,
and there is genome-wide colinearity between their
genomes [7].
Much effort is currently being invested to sequence the
nuclear and organellar genomes of these organisms. The
International Tomato Genome Sequencing Project [8] is
sequencing the tomato (S. lycopersicum cv. Heinz 1706)
genome in the context of the family-wide Solanaceae
Project (SOL). Rather than sequencing the complete
genome, which is approximately 950 Mb [9], only the
gene-rich euchromatic regions (estimated at 240 Mb) are
being sequenced using a BAC-by-BAC walking approach
[10]. The Potato Genome Sequencing Consortium
(PGSC) [11] aims to sequence the complete potato (S.
tuberosum, genotype RH89-039-16) genome of approxi-
mately 840 Mb [4] using a similar marker-anchored BAC-
by-BAC sequencing strategy.
Both sequencing projects rely heavily on BAC libraries, of
which three exist for tomato (HindIII [12], MboI, and
EcoRI) and two exist for potato (HindIII and EcoRI). The
tomato libraries are available through the SOL Genomics
Network (SGN) [13] and the potato libraries will soon by
available at through the PGSC [11]. All of these libraries
have been end-sequenced to support BAC-by-BAC
sequencing and extension, and to provide a base of
genome-wide survey sequences to support studies such as
the one presented here.
This paper describes the detailed sequence analysis of
310,580 tomato BAC End Sequences (BESs), representing
181.1 Mb (~19%) of the tomato genome, and 128,819
potato BESs, corresponding to 87.0 Mb (~10%) of the
potato genome (for an overview of the tomato and potato
BES data, see Table 1). This comparative genomics study
aims to gain insight into the similarity between the
tomato and potato genomes, both on the structural level
through repeat and gene content analyses and on the
functional level through gene function analyses. Further-
more, we investigate micro-syntenic relationships
between these two Solanaceous genomes, and several
other sequenced plant genomes. The sequence content of
BESs from a particular library is biased by which restric-
tion enzyme was used to make the library. To avoid com-
paring sequence sets with different biases, tomato-potato
comparisons are made only between BESs from libraries
made with the same enzyme.
Results
Repeat density and categorization
Based on similarity searches of the repeat database,
between 13.0% and 22.9% of the nucleotides in the
tomato BESs were identified as belonging to a repeat (see
Table 2, second through fourth columns). The most com-
mon repeat families in the tomato libraries were the
Gypsy (5.0 – 11.6%) and Copia (4.2 – 5.3%) classes of
retrotransposons. Another prominent class of repeats
comprised the ribosomal RNA genes (<0.1 – 8.6%). The
tomato Eco (EcoRI) library had the lowest repeat density
at 13.0%, which can be attributed to a lower amount of
Table 1: Overview of tomato and potato BES data
Number of sequences Total length Average length GC content
Tomato 310,580 181,076,819 583 36.1%
HBa (HindIII) 144,307 89,649,564 621 35.5%
Eco (EcoRI) 77,141 46,398,406 601 35.2%
Mbo (MboI) 89,132 45,028,849 505 38.3%
Potato 128,819 86,972,687 675 35.6%
POT (HindIII) 76,930 52,695,698 685 36.0%
PPT (EcoRI) 51,889 34,276,989 661 35.0%
The sequences are subdivided into libraries, which are labeled with a three-letter code, with the corresponding restriction enzyme listed between
brackets.
BMC Plant Biology 2008, 8:34 />Page 3 of 16
(page number not for citation purposes)
Gypsy retrotransposons (5.0%). The highest repeat con-
tent was found in the tomato Mbo (MboI) library
(22.9%), more than a third of which (8.6%) consisted of
ribosomal RNA genes. Note that, since the repeat detec-
tion was based on sequence similarity, different segments
in a BES could be assigned to more than one repeat family.
As a result, the sum of the repeat content per repeat type
can be slightly larger than the total repeat content.
In contrast to the tomato BESs, only between 10.0% and
12.5% of the nucleotides in the potato BESs showed sim-
ilarity to known Magnoliaphytae repeats (see Table 2, fifth
and sixth columns). As in tomato, the majority of the
repeats were found in the Gypsy (5.4 – 8.6%) and Copia
(2.5 – 2.6%) retrotransposon families, whereas the frac-
tion of ribosomal RNA genes was small (<0.1 – 0.5%).
Potato appeared to contain approximately two times as
many LINE and SINE elements as tomato (see Table 2),
although the absolute percentages were low. Furthermore,
a higher percentage of class II DNA transposons was
observed in potato (1.0 – 1.2%, versus 0.5 – 0.7% in
tomato), the majority of which could not be classified. In
agreement with the differences observed between the
tomato HBa (HindIII) and Eco libraries, the potato PPT
(EcoRI) library had an overall lower repeat content than
the POT (HindIII) library, and more specifically, a lower
amount of Gypsy retrotransposons (5.4% versus 8.6% in
the POT library). The PPT library was also enriched in
ribosomal RNA genes in comparison to the POT library
(0.5% versus less than 0.1%), just as was found compar-
ing the Eco library to the HBa library in tomato.
Since similarity-based repeat detection can be limited by
the size and diversity of the repeat database, a self-com-
parison of the BESs was performed in order to estimate the
redundancy within the BESs. Even with the stringent
Table 2: Classification and distribution of known plant repeats in the BAC end sequences
Tom. HBa Tom. Eco Tom. Mbo Pot. POT Pot. PPT
Class I retrotransposons 16.95 9.30 13.81 11.42 8.19
LTR retrotransposons 16.81 9.19 13.72 11.16 7.92
Ty1/Copia 5.25 4.17 4.39 2.55 2.48
Ty3/Gypsy 11.56 5.02 9.33 8.60 5.43
Unclassified 0.00 0.00 0.00 0.01 0.01
Non-LTR retrotransposons 0.14 0.11 0.09 0.26 0.27
LINE 0.09 0.06 0.05 0.15 0.13
SINE 0.05 0.05 0.04 0.11 0.14
Class II DNA transposons 0.64 0.66 0.49 1.03 1.23
En-Spm 0.26 0.26 0.21 0.27 0.27
Harbinger 0.00 0.00 0.00 0.00 0.00
Mariner 0.00 0.00 0.00 0.00 0.00
MuDR 0.07 0.09 0.05 0.10 0.11
Pogo 0.02 0.03 0.02 0.03 0.08
Stowaway 0.02 0.02 0.02 0.01 0.02
TcMar-Stowaway x x x 0.00 0.00
Tourist x x 0.00 0.00 x
hAT 0.02 0.04 0.02 0.05 0.19
hAT-Ac 0.01 0.00 0.01 0.01 0.01
hAT-Tip100 0.02 0.02 0.02 0.11 0.10
Unclassified 0.22 0.20 0.14 0.45 0.45
Satellites 0.00 0.00 0.00 0.04 0.03
Centromeric 0.00 x 0.00 0.00 0.00
Subtelomeric x x x 0.00 0.00
Unclassified 0.00 0.00 0.00 0.04 0.03
Ribosomal genes 0.04 2.98 8.58 0.03 0.53
rRNA 0.04 2.98 8.58 0.03 0.53
Unclassified 0.08 0.11 0.07 0.07 0.11
Centromeric x x x 0.00 x
Composite x x x x 0.00
RC/Helitron 0.08 0.11 0.07 0.06 0.11
Unknown 0.00 0.00 0.00 0.01 0.00
Total 17.66 13.01 22.91 12.54 10.02
Numbers represent percentages of nucleotides that show similarity to a repeat of the indicated category. An 'x' represents the absence of a repeat
family; '0.00' indicates that the repeat is present, but at a frequency lower than 0.005 % of the nucleotides in the BESs. Species names have been
abbreviated as follows: Tom.: tomato; Pot.: potato.
BMC Plant Biology 2008, 8:34 />Page 4 of 16
(page number not for citation purposes)
requirement that at least 50% of a given query sequence
match another BES with at least 90% identity, 52.0% of
the nucleotides in the tomato BESs had a match to one or
more other tomato BESs, and 19.0% matched five or more
other BESs. The redundancy in the potato BESs was lower
than in tomato; 39.0% of the nucleotides in the potato
BESs had a hit to at least one other potato BESs, and
12.9% had a hit to five or more BESs. This difference could
not be attributed solely to the larger number of tomato
BESs, compared to the number of potato BESs; a self-com-
parison of the tomato HBa library, which is of approxi-
mately the same size as the potato POT and PPT libraries
combined, showed that 50.7% of the nucleotides in this
library matched at least one other HBa BES, and 16.8%
matched five or more other HBa BESs. The percentage of
nucleotides in both species that matched five or more
other BESs was only slightly higher than the findings from
the RepeatMasker analysis (see Table 2), suggesting that
the repeat database used in this study was sufficient to
detect the majority of highly abundant repeats in these
species. These findings also confirm the observation from
the similarity-based repeat detection that the tomato BESs
are more repetitive than the potato BESs.
Simple sequence repeats
A total of 28,423 SSRs with a motif length between one
and five nt, and a total length of at least 15 nt were
detected in the tomato BESs, representing one SSR per 6.4
kb of genomic sequence. The term 'motif length' is used
here to describe the length of the motif that is repeated in
the SSR; for example, an ATATAT repeat has a motif length
of two (with AT being the motif). The most abundant
motif length was five nucleotides (11,177 SSRs), followed
by motif lengths of two (6,588 SSRs), four (4,596 SSRs),
three (4,135 SSRs), and lastly one (1,927 SSRs).
In potato, 19,019 SSRs were found, out of which 3,964
(21%) belonged to class I (i.e., SSRs containing more than
10 motif repeats). Thus, the potato BESs had one SSR per
4.6 kb of genomic sequence, which is higher than that in
tomato (one SSR per 6.4 kb). As in tomato, the most
abundant motif length in the potato SSRs was five nucle-
otides (7,922 SSRs). However, the next most abundant
length was three (3,941 SSRs), followed by motif lengths
of two (3,270 SSRs), four (1,980 SSRs) and one (1,906
SSRs).
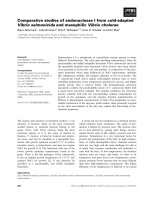
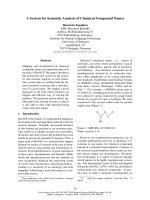
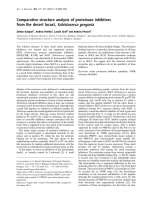
Figure 1 shows the distribution of the primary SSR motifs
in the tomato and potato BESs, ordered by motif length
and relative frequency within the motifs of the same
length. The most abundant SSR motifs in both datasets
were AT-rich, with the di-nucleotide repeat AT/TA being
the most abundant (16.6% of all tomato and 14.7% of all
potato SSRs, respectively). Several motifs, such as AG/CT,
AC/GT, AATT/AATT and AAAG/CTTT were more frequent
in tomato than in potato, whereas other motifs, such as
AAG/CTT, AAC/GTT, AACTC/GAGTT and AAACC/GGTTT
were found predominantly in potato.
Considering only the class I SSRs, the most abundant SSR
motifs in tomato and potato were AT/TA (50.8 and 39.1%
of all class I SSRs, respectively) and A/T (25.8 and 42.1%).
In tomato, the di-nucleotide motifs AC/GT (6.3%) and
AG/CT (5.7%) were the most abundant after these two,
whereas in potato the mononucleotide C/G (6.0%) and
tri-nucleotide AAT/ATT (4.5%) and AAG/CTT (3.7%)
occurred at the second, third and fourth highest fre-
quency, respectively. This suggests that the differences in
primary motif frequencies between tomato and potato
also hold when considering only class I SSRs.
Distribution of the most abundant SSR motifs in the tomato and potato BESsFigure 1
Distribution of the most abundant SSR motifs in the tomato and potato BESs. The values on the Y axis represent
the fraction of SSRs for each dataset that consist of the motifs listed on the X axis.
BMC Plant Biology 2008, 8:34 />Page 5 of 16
(page number not for citation purposes)
Gene content
In the tomato BESs, the percentage of nucleotides that
matched by at least one database sequence ranged from
21.3% for the Eco library, to 30.5% for the Mbo library.
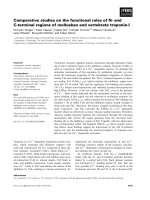
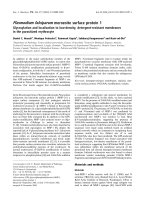
Figure 2 presents a breakdown of these BLAST hits into
three main categories ('coding', 'repeats', and 'other'),
based on the keyword filtering described in Materials and
Methods. Each category was then subdivided into
'masked' and 'unmasked' subcategories, with 'masked'
indicating an overlap with repetitive sequences identified
by RepeatMasker, and 'unmasked' indicating a lack of
such overlap. In this way, the BLAST and RepeatMasker
results were combined in order to generate the best possi-
ble estimation of the percentage of putative protein-cod-
ing nucleotides in the BESs. The 'coding' category
represents the percentage of nucleotides that matched one
or more database sequences, and were not identified as
repetitive by the keyword filtering. After removing the
overlap with repeats identified by RepeatMasker, the per-
centage of coding nucleotides in the three libraries ranged
from 3.5% for the Mbo library to 4.6% for the HBa library
(the 'coding unmasked' category in Figure 2). The Mbo
library had the highest percentage of the three libraries in
the 'coding masked' category, which is likely the result of
the high number of ribosomal repeat sequences in this
library that have escaped the keyword filtering. The
'repeats' category contains the BLAST matches to transpo-
son and other repeat related sequences. In all three librar-
ies, there was a considerable fraction of nucleotides that
the keyword filtering assigned to the 'repeats' category but
that did not overlap with the repeats identified by Repeat-
Masker (i.e. the 'repeats unmasked' category). This frac-
tion ranged from 6.9% in the Eco library to 8.4% in the
HBa library and may represent a combination of repeats
that were missed by RepeatMasker and true protein-cod-
ing genes that were miss-classified by the keyword filter-
ing. The final category in Figure 2, 'other', represents all
non-transposon-related repetitive sequences that were
identified by the keyword filtering (all keyword terms
other than "Transposon terms" from Additional File 1).
In the potato POT and PPT libraries, 24.3 and 20.5% of
the nucleotides matched the protein database, respec-
tively. While these numbers were slightly lower than those
for the tomato HBa and Eco libraries (28.5 and 21.3%,
respectively), the percentage of nucleotides assigned to
the 'coding' category (6.8 and 6.3%) was larger than those
of the corresponding tomato libraries (4.6 and 3.9%),
suggesting that potato may have a larger gene repertoire
than tomato. Furthermore, the number of transposon
regions and other repeat-related regions that was found in
this comparison to the protein database was more than
1.5-fold higher for tomato than for potato. This is consist-
ent with the difference in transposon content that was
found in the repeat analysis.
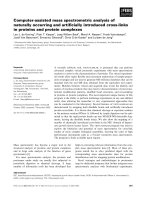
Figure 3 shows the results of the BLASTN comparison of
the BESs to species-specific EST databases. The matches
Percentage of nucleotides in the BESs covered by BLASTX hits to the non-redundant protein databaseFigure 2
Percentage of nucleotides in the BESs covered by BLASTX hits to the non-redundant protein database. The
BLAST hits have been divided into three categories ('coding', ' repeats', 'other') based on keyword filtering. Each category has
subsequently been divided into 'masked' (i.e., overlapping with repeats identified by RepeatMasker) and 'unmasked' (i.e., no
overlap with repeats identified by RepeatMasker) subcategories. Species names have been abbreviated as follows: Tom.:
tomato; Pot.: potato.
BMC Plant Biology 2008, 8:34 />Page 6 of 16
(page number not for citation purposes)
were divided into two categories, 'masked' and
'unmasked'. The 'masked' category contains the nucle-
otides that had a match in the EST database, but were
found to be repetitive in the RepeatMasker analysis; the
'unmasked' category contains the nucleotides that did not
overlap with repeats. In the tomato libraries, between
10.2 and 19.1% of the nucleotides matched one or more
tomato EST sequences. The Mbo library had the highest
EST coverage (19.1%), but more than half of these
matches (10.3%) were 'masked'. The percentage of nucle-
otides in the 'unmasked' category ranged from 6.8% in the
Eco library to 8.8% in the Mbo library.
For the potato BESs, 11.1% (POT) and 11.5% (PPT) of the
nucleotides had match in the potato EST database, which
is in fairly good agreement with the tomato HBa and Eco
comparisons versus the tomato database (11.3 and
10.2%, respectively; see also Figure 3). Fewer matches in
the potato BESs were 'masked' than in tomato, confirming
the observation from the BLASTX comparison to the pro-
tein database that the potato BESs have more protein cod-
ing nucleotides and lower repeat content.
Functional annotation
A total of 30,335 GO terms, out of which 585 unique
terms, were assigned to the tomato HBa BESs based
matches in the Pfam database (see Additional Files 2, 3, 4,
5 for an overview of all GO terms and their corresponding
frequencies in the tomato and potato BESs). Although
there were more than half as many Eco BESs as HBa BESs,
only 7,647 GO terms (403 unique terms) were assigned to
them. In potato, 17,060 terms (544 unique terms) were
assigned to the POT library, whereas only 9,312 terms
(419 unique terms) were assigned to the PPT library.
Comparing the GO annotations of tomato to those of
potato (for libraries generated with the same restriction
enzyme) resulted in 18 significantly overrepresented
terms between the HindIII digested libraries (seven in
tomato HBa, and eleven in potato POT; P values are found
in Additional File 3) and nine significantly overrepre-
sented terms between the EcoRI digested libraries (seven
in tomato Eco, and two in potato PPT; P values are found
in Additional File 2).
In both species, many of the terms that were overrepre-
sented in the HindIII libraries compared to their EcoRI
counterparts were related to retrotransposon activity, such
as DNA binding (GO:0003677), DNA integration
(GO:0015074), RNA-directed DNA polymerase activity
(GO:0005634), and chromatin-related terms
(GO:0000785, GO:0003682, GO:0006333). Further-
more, many of these transposon-related terms were signif-
icantly overrepresented in tomato, compared to potato (P
value < 10-4; individual P values are found in Additional
Files 2 and 3). This is consistent with the findings from the
RepeatMasker and BLAST analyses discussed above. Sur-
prisingly, some terms that were overrepresented in both
the EcoRI digested libraries could be linked to transcrip-
Percentage of nucleotides in the BESs covered by BLASTN hits to the species-specific transcript databasesFigure 3
Percentage of nucleotides in the BESs covered by BLASTN hits to the species-specific transcript databases.
The BLAST hits have been divided into 'masked' (i.e., overlapping with repeats identified by RepeatMasker) and 'unmasked' (i.e.,
no overlap with repeats identified by RepeatMasker) categories. Species names have been abbreviated as follows: Tom.:
tomato; Pot.: potato.
BMC Plant Biology 2008, 8:34 />Page 7 of 16
(page number not for citation purposes)
tion factor genes. In tomato, zinc ion binding
(GO:0008270), DNA-dependent regulation of transcrip-
tion (GO:0006355), and transcription factor activity
(GO:0003700) were overrepresented in the Eco library.
The potato PPT library was enriched for zinc ion binding
(GO:0008270), nucleic acid binding (GO:0003676), and
transcription factor activity (GO:0003700).
Analysis of the protein families identified by PANTHER
revealed similar trends for the number of matches, both
within and between the tomato and potato libraries (see
Additional Files 6, 7, 8, 9 for an overview of all PANTHER
terms and their corresponding frequencies in the tomato
and potato BESs). In tomato, 1,064 distinct families were
found in the HBa BESs for a total of 28,984 hits, and 8,226
hits representing 654 families were found in the Eco BESs.
Analysis of the potato POT library revealed 951 distinct
PANTHER families for a total of 13,821 hits; however,
only 6,926 hits to 716 families were found in the PPT
BESs. Two and three PANTHER families were found to be
overrepresented in the tomato HBa and Eco libraries,
compared to eleven and five overrepresented families in
the potato POT and PPT libraries, respectively.
Consistent with the greater abundance of Gypsy retro-
transposons in the HindIII libraries of both tomato and
potato, the GAG/POL/ENV polyprotein (PTHR10178)
PANTHER family was found to be overrepresented in
both HindIII libraries, compared to the corresponding
EcoRI libraries. Furthermore, the GAG-POL-related retro-
transposon (PTHR11439) PANTHER family was relatively
more abundant in the EcoRI libraries, which also agrees
with the difference in the Gypsy:Copia ratio between the
HindIII and EcoRI libraries (see also Table 2). Both of
these retrotransposon-related terms were found to be sig-
nificantly (P value < 10-4; individual P values are found in
Additional Files 6 and 7) overrepresented in tomato when
compared to potato. In the tomato Eco library, transcrip-
tion-factor related terms such as zinc finger CCHC
domain contain protein (PTHR23002), zinc finger pro-
tein (PTHR11389) and MADS box protein (PTHR11945)
were significantly overrepresented (P values 4.0*10-13,
7.8*10-7, and 1.5*10-6, respectively), confirming the
results from the GO analysis. No transcription-factor
related PANTHER families were significantly overrepre-
sented in the potato PPT library.
Between tomato and potato, the majority of the overrep-
resented terms in potato corresponded to important bio-
logical and biochemical processes. For example, zinc
finger CCHC domain containing proteins (PTHR23002)
and general transcription factor 2-related zinc finger pro-
teins (PTHR11697) occurred with a significantly (P value
2.2*10
-16
for both) higher frequency in potato POT than
in tomato HBa; the latter was also overrepresented in the
potato PPT library. This was also reflected in the GO
annotation through terms such as nucleic acid binding
(GO:0003676) and zinc ion binding (GO:0008270). The
overrepresentation of these terms relative to tomato sug-
gests an expansion of transcription factors or other genes
for DNA binding proteins in the potato genome.
Another example is the cytochrome P450 superfamily
(PTHR19383), which was also found in the GO analysis
through terms such as iron ion binding (GO:0005506)
and mono-oxygenase activity (GO:0004497). Cyto-
chrome P450 proteins play important roles in the biosyn-
thesis of secondary metabolites, and the
overrepresentation of these proteins in potato could indi-
cate an expanded network of pathways that synthesize sec-
ondary metabolites in potato.
A final example involves the large family of plant-type ser-
ine-threonine protein kinases (PTHR23258), which are
known to play important roles in disease resistance in var-
ious plant species (for example, the Pto gene in tomato
[14]). In the PANTHER database, this family consists of
104 different subfamilies, 71 of which were found in the
tomato and potato BESs. Out of these 71 subfamilies, 15
were found only in tomato, and five were unique to
potato. Most of the subfamilies that were found in both
species were overrepresented in potato, such as LRR recep-
tor-like kinases (PTHR23258:SF462) and LRR transmem-
brane kinases (PTHR23258:SF474). Several subfamilies
occurred at a higher frequency in tomato, including ser-
ine/threonine specific receptor-like protein kinases
(PTHR23258:SF416) and Pto-like kinases
(PTHR23258:SF418). Thus, while the complement of ser-
ine-threonine protein kinases in potato exceeds that of
tomato, several of the subfamilies have expanded specifi-
cally in tomato. This may reflect an adaptation for resist-
ance to different pathogens, or a difference in the
dominant mechanism of pathogen resistance between
these species.
Comparative genome mapping
Out of the 135,842 pairs of tomato BESs that were com-
pared to the A. thaliana genome, 15,283 pairs had one or
more matches. These matches were divided into five cate-
gories, as is shown in the last five columns of Table 3. The
'single end' category represents the BAC end pairs from
which only one of the two sequences had a match to the
A. thaliana genome, and contained the majority of the
matches (10,191). Paired end matches, in which the BESs
from the same BAC each had a match to a different chro-
mosome, were assigned to the 'non-linear' category. The
'gapped' category contained 4,836 BAC end pairs that
matched to the same A. thaliana chromosome with a dis-
tance between the paired matches that was either smaller
than 50 kb or larger than 500 kb. The final two categories
BMC Plant Biology 2008, 8:34 />Page 8 of 16
(page number not for citation purposes)
represented the BACs from which both end sequences
were matched to the genome within a distance of 50 to
500 kb of each other, either in the correct orientation with
respect to each other ('colinear'), or rearranged with
respect to each other ('rearranged'). Out of the 4,840
tomato BES pairs that hit to the same A. thaliana chromo-
some, three pairs fell into the 'colinear' category, and one
pair fell into the 'rearranged' category, suggesting the pres-
ence of four putative micro-syntenic regions between
tomato and A. thaliana.
Potato had 55,662 pairs of BESs, out of which 117 pairs
were mapped to the A. thaliana genome, with both BESs
of the pair matching the same chromosome. Two potato
BACs displayed putative microsynteny based on the end
sequence matches, one of which was colinear, whereas the
other represented a possible rearrangement. In compari-
son to tomato, potato had very few BACs that fell into the
'gapped' category, although the smaller PPT library had
more than five times as many sequences in this category
as the POT library. Interestingly, the large majority of the
tomato BACs that fell into this category was from the Eco
and Mbo libraries (1,279 and 3,507, respectively). The
EcoRI and MboI digested libraries were found to contain
a high fraction of ribosomal RNA genes in the RepeatMas-
ker analysis, and indeed more than 80% of the sequences
from these libraries that fell into the 'gapped' category
contained ribosomal RNA genes.
Repeating the same analysis against the P. trichocarpa
genome, only 708 of the tomato BES pairs matched with
both ends to the same chromosome (the sum of the last
three columns in Table 4). It should be noted here that P.
trichocarpa has both a larger number of chromosomes
than A. thaliana (19 versus 5) and approximately twenty-
two thousand additional contig sequences that have not
yet been integrated into the chromosome pseudomole-
cules. Based on these numbers alone, one would expect a
smaller number of paired BESs to map to the same chro-
mosome or contig sequence. Even so, P. trichocarpa dis-
played more regions of micro-synteny with tomato than
A. thaliana: 73 pairs of BESs mapped within a distance
between 50 and 500 kb of the other BES in the pair. More
than two-thirds of these matches (51, the 'colinear' cate-
gory in Table 4) showed colinearity between tomato and
P. trichocarpa, whereas the remaining 22 hits represented
rearrangements in their respective regions of micro-syn-
teny.
Consistent with the difference between the tomato – A.
thaliana and tomato – P. trichocarpa mappings, a smaller
number of potato BES pairs (75) could be mapped with
both ends to the same chromosome in P. trichocarpa, than
in A. thaliana. Of these, there were 41 regions of potential
microsynteny, out of which 24 were colinear. Compared
to tomato, the 'non-linear' and to a lesser extent the
'gapped' categories were underrepresented in potato.
Again these differences seem to originate from the fact
that many of the BESs in the Eco and Mbo libraries con-
tain ribosomal RNA genes. The majority of these
sequences fell into the 'non-linear' category in the P. tri-
chocarpa comparison, rather than the 'gapped' category as
was the case with A. thaliana, due to the ribosomal RNA
genes being contained in some of the unassembled contig
sequences rather than in the chromosomal pseudomole-
cules.
Discussion
Sequence properties
Based on the differences between the libraries in both
tomato and potato, it seems unlikely that any of these par-
tial digestion-based libraries represents an unbiased cross
section of the genome. For example, in tomato the Mbo
library has a higher GC percentage than the HBa and Eco
libraries. This difference is likely caused by the length and
GC content of the restriction sites that were targeted in the
digestion of the genome: both the HindIII and EcoRI sites
(AAGCTT and GAATTC, respectively) have a length of six
nucleotides and a GC content of 33.3%, whereas the MboI
site (GATC) has a length of four nucleotides and a GC
content of 50%. The consequences of this are clearly visi-
ble in the results of the gene and repeat content analyses
presented in this paper: results differ markedly among
libraries made with different enzymes. However, we think
it reasonable to assume that tomato and potato libraries
derived from digestion with the same restriction enzyme
would have similar sequence bias. Using this assumption,
we strive to minimize any effect of sequence bias on our
Table 3: BLASTN hits between the tomato and potato BESs, and the A. thaliana genome
No hit Single end Non-linear Gapped Colinear Rearranged
Tomato 120,559 10,191 252 4,836 3 1
HBa 57,489 5,469 159 50 1 1
Eco 30,529 1,655 33 1,279 2 0
Mbo 32,541 3,067 60 3,507 0 0
Potato 51,361 4,102 82 115 1 1
POT 31,568 2,718 57 18 1 0
PPT 19,793 1,384 25 97 0 1
BMC Plant Biology 2008, 8:34 />Page 9 of 16
(page number not for citation purposes)
results by maintaining logical separation of BESs from dif-
ferent libraries, and only directly comparing data for BESs
from libraries constructed with the same restriction
enzymes.
The tomato BESs (and specifically the Mbo BESs) are
shorter than the potato BESs on average. The difference in
average sequence length between the tomato HindIII and
EcoRI libraries and their potato counterparts is approxi-
mately 60 nt for both libraries and is most likely the result
of a difference in sequencing quality and equipment.
However, we think it reasonable to assume that a differ-
ence in sequence length on this scale would not influence
the results of the similarity-based analyses that have been
performed in this study.
Repeat density and categorization
Both the tomato and potato libraries vary in total repeat
content and in ratios between repeat types. For example,
ribosomal DNA sequences are overrepresented in the
tomato Mbo and Eco, and the potato PPT libraries, rela-
tive to the tomato HBa and potato POT library, respec-
tively. This phenomenon was also observed in a study of
Zea mays BESs [15], where it was attributed to the presence
of many MboI sites in the Z. mays ribosomal DNA cluster,
compared to one EcoRI site, and no HindIII sites. By sim-
ilar reasoning, the under-representation of Gypsy retro-
transposons in the Eco and PPT libraries might result from
a lower frequency of EcoRI sites in this element compared
to HindIII and MboI sites.
The discrepancy between the repeats identified by Repeat-
Masker (Table 2) and BLASTX (Figure 2) indicates the
need for tomato- and potato-specific repeat databases. A
repeat database had previously been generated from the
tomato BESs (L. Mueller, unpublished data), however
comparing the tomato BESs to this database using Repeat-
Masker resulted in approximately 60% of the tomato BESs
being annotated as repetitive (data not shown). The
majority of these repeats could however not be assigned to
a known repeat family. Thus, while the findings in this
paper may present an underestimation of the actual repeat
content of the tomato and potato BESs, the findings from
the RepeatMasker and BLASTX analyses both clearly sug-
gest a higher repeat content in the tomato BESs than in the
potato BESs.
A correlation between genome size and retrotransposon
content has previously been identified in the Brassicaceae
[16]. There, it was found that the retrotransposon content
increases with genome size, from approximately 7 to 10%
in A. thaliana (genome size 125 Mb), to 14% in Brassica
rapa (genome size 530 Mb), to 20% in B. olacerea
(genome size 700 Mb). Comparing this to cereal crops
such as Oryza sativa (genome size 430 Mb, 35% retrotrans-
posons [17] and Z. mays (genome size 2,365 Mb, 56% ret-
rotransposons [15]) suggests that while the actual
retrotransposon content in cereals is higher than in Brassi-
caceae, the correlation with genome size may be univer-
sally present in plants. The data presented in this research
indicate that genome expansion in the Solanaceae is also
associated with retrotransposon amplification; potato
(genome size 840 Mb) has an estimated retrotransposon
content between 8.2 (PPT) and 11.4% (POT), whereas
that of tomato (genome size 950 Mb) is notably higher
(9.3% for the Eco library, and 17.0% for the HBa library).
The ratio between Gypsy and Copia retrotransposon
sequences in the tomato BESs is between 1:1 and 2:1,
whereas this ratio in the potato BESs is between 2:1 and
3:1. While this ratio clearly differs within each species
between libraries generated with a different restriction
enzyme, the difference in ratios between tomato and
potato is observed in both the HindIII and the EcoRI
digested libraries (see Table 2). In A. thaliana [18], B. rapa
[16], Carica papaya [19] and Z. mays [15], this ratio is
approximately 1:1. The tomato and potato genomes
appear more similar to the O. sativa genome in this
respect, where the Gypsy to Copia ratio was found to be
around 2:1 [17]. The difference in the Gypsy:Copia ratio
between tomato and potato suggests that the retrotrans-
poson amplification associated with the genome expan-
sion in tomato is predominantly the result of additional
Copia copies.
Table 4: BLASTN hits between the tomato and potato BESs, and the P. trichocarpa genome
No hit Single end Non-linear Gapped Colinear Rearranged
Tomato 110,633 18,904 5,597 635 51 22
HBa 52,083 10,297 666 68 38 17
Eco 28,630 3,341 1,174 344 6 3
Mbo 29,920 5,266 3,757 223 7 2
Potato 46,189 8,844 554 34 24 17
POT 28,116 5,899 300 19 17 11
PPT 18,073 2,945 254 15 7 6
BMC Plant Biology 2008, 8:34 />Page 10 of 16
(page number not for citation purposes)
Simple sequence repeats
The most abundant SSRs in all size categories for both
tomato and potato were AT-rich. This is consistent with
findings in other plant species, such as A. thaliana [20], B.
rapa [16], C. papaya [19], Glycine max [21], and Musa acu-
minata [22]. In both potato and tomato, penta-nucleotide
repeats are the most common form of SSRs, and AAAAT is
the predominant repeat motif. This is in sharp contrast to
previously studied plant species, in which di- and penta-
nucleotide repeats generally occur least frequently [23]. In
many plant species, such as A. thaliana, B. rapa [16], and
O. sativa [24,25], tri-nucleotide repeats are the most abun-
dant microsatellites. However, BES analysis of C. papaya
[19], G. max [21] and M. acuminata [22] suggests that di-
nucleotide repeats are more common in these plant spe-
cies. Thus, both tomato and potato display a unique dis-
tribution of microsatellite frequencies compared to other
studied plant species.
The tomato BESs have a higher fraction of di- and tetra-
nucleotide repeats compared to the potato BESs. This may
be because one or more of the tomato BAC end libraries
are enriched for BACs that are derived from centromeric
regions in the tomato genome, as these regions have pre-
viously been found to be enriched for long, class I di- and
tetra-nucleotide repeats [26]. However, the relative
enrichment for di- and tetra-nucleotide repeats in tomato
compared to potato is observed in all three tomato librar-
ies; this would only be compatible with the hypothesis of
enrichment for centromeric regions if these regions con-
tain more HindIII, EcoRI and MboI sites than average for
the tomato genome.
Gene content
After repeat masking and keyword filtering, the percentage
of nucleotides in the potato POT and PPT BESs that have
a match in the non-redundant protein database is 1.5- to
1.6-fold that of the tomato HBa and Eco BESs, respec-
tively. Both the percentage of nucleotides and the number
of BESs having a hit to the protein database after repeat
masking and keyword filtering are higher in potato
(13.8% in the POT library; 12.9% in the PPT library) than
in tomato (8.7% in the HBa library; 7.9% in the Eco
library), supporting the hypothesis that potato has more
putative protein-coding regions than tomato. In the
BLASTN comparison of the BESs to the ESTs, a similar dis-
crepancy between potato and tomato was observed, with
potato having a 1.3- to 1.4-fold higher EST coverage than
tomato. Furthermore, cross-comparisons of the tomato
BESs to the potato ESTs and vice versa confirmed that the
difference in EST coverage of the BESs was not caused by
a difference in number of unique transcripts between the
tomato and potato EST collections (data not shown). The
difference between the BLAST comparisons to the protein
and transcript databases may be attributed to the presence
of full-length cDNA sequences in the tomato transcript
data, whereas these are not present in the potato data,
resulting in an overrepresentation in the tomato BESs for
the interior regions of coding sequences. Even if one
assumes that this more conservative lower bound is cor-
rect, the results still suggest that potato has a larger gene
repertoire than tomato since the tomato genome is only
approximately 1.1 times larger than the potato genome.
In both tomato and potato, a smaller percentage of nucle-
otides show similarity to the EST database than to the pro-
tein database, while the percentage of non-repetitive
coding sequence in the EST database comparison (the
'unmasked' category in Figure 3) is higher than that in the
protein database comparison (the 'coding unmasked' cat-
egory in Figure 2). Surprisingly, the majority of the
matches to the protein and transcript databases do not
overlap. For example, in the tomato HBa library, 8.1%
and 4.6% of the nucleotides have a match in the EST and
protein databases, respectively, while only 1.6% have a
match in both. Similarly, for the potato POT library, only
2.5% of the nucleotides have a match in both the tran-
script and protein sequences, whereas the individual per-
centages of nucleotides that have a match in these
databases are 10.2% and 6.8%, respectively. On one
hand, the matches to the EST databases that do not over-
lap with matches to the protein database may represent
unique, taxon- or species-specific protein-coding genes
that are not represented in the non-redundant protein
database, or transcribed but untranslated regions in these
genomes. On the other hand, matches to the protein data-
base that do not overlap with matches in the EST database
may indicate either the presence of genes that were not
sufficiently expressed in the tissues under the conditions
that were sampled during EST library construction, or mis-
annotated or otherwise incorrect sequences in the protein
database.
The EST data likely provides the most reliable sampling of
the true protein coding regions in these genomes, since it
is based on experimental data that contain species-specific
sequences not available in the protein database. Due to
the selection for poly-A tails that is normally used in the
construction of EST libraries, the number of non-protein
coding transcripts will be relatively small. Taking the
nucleotides from the HBa and Eco libraries that match
ESTs and do not overlap with repeats as a measure of cod-
ing sequences, the tomato genome (950 Mb) is estimated
to contain between 64.8 and 77.1 Mb of coding regions.
Similarly, assuming a genome size of 840 Mb, the total
coding region length for potato would be between 82.5
and 85.4 Mb. These numbers set lower bounds on the esti-
mated coding content of these genomes, as the EST data is
unlikely to represent the full complement of full-length
protein-coding sequences in these genomes.
BMC Plant Biology 2008, 8:34 />Page 11 of 16
(page number not for citation purposes)
Previous estimates put the gene content of tomato at
35,000 genes, based on an analysis of 27,274 UniGenes
and 6 BAC sequences [27]. If these 35,000 genes are
indeed represented by 71.0 Mb of coding sequence (the
average of the estimations for the HBa and Eco libraries),
then the average transcript length of tomato would be
approximately 2.0 kb. This is longer than the average tran-
script length in A. thaliana, which is 1.2 kb according to
the TAIR7 genome annotation [28]. Assuming the same
average transcript length, potato (84.0 Mb of coding
sequence, averaged over the two libraries) would contain
approximately 41,400 genes, or 6,400 more genes than
tomato. Since the data presented here are based on simi-
larity-searches on short genomic sequences only, this dif-
ference does not necessarily represent a difference in
functional genes, but may also reflect a larger proportion
of pseudogenes or otherwise non-functional alleles in
potato.
Functional annotation
The results from the GO and PANTHER analysis generally
show a similar trend. The tomato BESs have more GO
terms and PANTHER families associated to them than the
potato BESs do. However, the potato BESs have a larger
number of unique terms associated to them. This agrees
with the results of the BLASTX comparison to the non-
redundant protein database, where it was found that the
tomato BESs have a higher overall coverage of BLAST hits,
but a lower percentage of putative protein coding regions
(see also Figure 2).
In both the GO term and PANTHER family analyses, the
majority of the terms occur at a relatively low frequency.
For example, in the tomato HBa versus potato POT com-
parison, only 131 out of the 730 distinct GO terms that
were assigned to the BESs occurred ten or more times in at
least one of the species. This group of 131 GO terms con-
tained all 18 of the terms that were significantly (P values
< 10
-4
) overrepresented in one of the species in this com-
parison. Moreover, 39 out of these 131 terms were found
at least 50 times in at least one species, and this subgroup
contained 16 out of the 18 significantly overrepresented
terms. Similarly, in the PANTHER family analysis, 119 out
of the 1,352 distinct families that were found in the BESs
occurred at least ten times in at least one species, out of
which 12 families were found at least 50 times. The 119
families that were found at least ten times contained every
one of the 13 families that were significantly overrepre-
sented in one of the species; ten of these were counted
more than 50 times in at least one species. While only the
tomato HBa versus potato POT comparison is shown
here, the other comparisons show a similar pattern, indi-
cating that many of the highly abundant GO terms and
PANTHER families are significantly overrepresented in
either tomato or potato. The majority of these overrepre-
sented terms and families are most abundant in potato,
and represent biologically important functions and proc-
esses. In tomato, a smaller number of terms and families
is overrepresented; these are primarily connected to struc-
tural genomic features such as retrotransposons.
The overrepresentation of transposon-related GO terms
and PANTHER families in tomato was consistent with the
results of the repeat analysis, confirming the observations
that tomato is richer in retrotransposons than potato.
However, in the PANTHER analysis, reverse transcriptases
(PTHR19446) were significantly overrepresented in
potato. At first glance, this does not correspond well with
the overrepresentation of RNA-directed DNA polymerase
activity (GO:0003964) and RNA-dependent DNA replica-
tion (GO:0006278) in tomato. However, in both tomato
and potato, the large majority of the reverse transcriptases
originated from non-LTR retroelements
(PTHR19446:SF34), which in fact is consistent with the
higher frequency of non-LTR retrotransposons in potato
found in the RepeatMasker analysis (see also Table 2).
The cytochrome P450 mono-oxygenases represent a large
gene superfamily in plants that are commonly associated
with the biosynthesis of secondary metabolites. In A. thal-
iana, at least 272 P450 genes have been found, represent-
ing approximately one percent of the gene complement of
this species. In O. sativa, this family is even larger, with
458 P450 genes identified so far [29]. Not all the P450s in
these genomes represent true protein-coding sequences;
in A. thaliana, 90% of the genes are truly protein coding,
compared to 72% in O. sativa. In total, 66 distinct families
of P450 genes were identified in A. thaliana and O. sativa,
several of which were found to be overrepresented in
either of these species. Moreover, some families were
present in one, but completely absent in the other species
[30]. In the HindIII and EcoRI libraries, 186 and 209 BESs
that could be associated with the cytochrome P450 PAN-
THER family (PTHR19383) were found in tomato and
potato, respectively. Since these BAC end sequences repre-
sent approximately 14% and 10% of their respective
genomes, these data suggest an enormous expansion of
P450 genes in the Solanaceae. This could be the result of an
expansion of specific P450 families, but also of the evolu-
tion of species- or family-specific P450s. For example, the
allene oxide synthase has currently only been found in
Solanaceous species, including tomato and Petunia inflata
[31]. The overrepresentation of P450s in potato compared
to tomato may be another result of species-specific P450
families, but may also indicate expansion of families that
are shared between these species.
Comparative genome mapping
In this study, paired BAC ends have been exploited to
detect regions of microsynteny between the Solanaceous
BMC Plant Biology 2008, 8:34 />Page 12 of 16
(page number not for citation purposes)
species tomato and potato, and the model plant organ-
isms A. thaliana and P. trichocarpa. Using similar
approaches, microsynteny has been observed between A.
thaliana and B. rapa [16]; C. papaya and P. trichocarpa [19];
and M. acuminata and O. sativa [22].
A higher number of tomato and potato BACs display
microsynteny to P. trichocarpa, than to A. thaliana. The
reduced level of microsynteny between tomato/potato
and A. thaliana is not likely a difference in evolutionary
distances between these species. Both A. thaliana and P.
trichocarpa are part of the rosids clade, whereas tomato
and potato belong to the asterids clade. It may be the
result of a recent duplication of the A. thaliana genome,
followed by the loss of roughly 70% of the duplicated
genes [32]. Assuming that this loss occurred randomly,
the large majority of possible microsyntenic regions that
existed before the duplication will have disappeared due
to the major local expansions and contractions that would
be associated with such a duplication and subsequent
loss. This hypothesis is strengthened by the observation
that only approximately 1% of 12,000 A. thaliana BES
pairs could previously be mapped within 300 kb to the P.
trichocarpa genome, indicating that the organization of
these genomes is indeed vastly different [19].
Regions of microsynteny have previously been detected
between tomato/potato and A. thaliana. A 57 kb region of
tomato chromosome 7 containing five genes was shown
to be syntenic with a 30 kb region on A. thaliana chromo-
some 1, although the order and orientation of the genes
suggested two inversion events [33]. In another study, a
105 kb BAC sequence matched to four different segments
on A. thaliana chromosomes 2, 3, 4, and 5; however, each
of the four regions in A. thaliana were shorter than their
tomato counterpart [34]. Recently, five microsyntenic
blocks were detected between a region on potato chromo-
some 5 harbouring a QTL for resistance to late blight and
root cyst nematodes, and A. thaliana chromosomes 1, 3
and 5 [35]. These syntenic blocks spanned between three
and seven ORFs, and were interrupted by non-syntenic
blocks. In each of these examples, the microsynteny
between tomato/potato and A. thaliana involves shorter
regions on the A. thaliana genome than the average
tomato and potato BAC sequence length. Furthermore,
regions of (micro-)synteny are often detected between
coding sequences, whereas the fraction of coding
sequences in the tomato and potato BESs is relatively low
(< 10%), providing a good explanation for the reduced
amount of microsynteny between these species observed
here.
Synteny between potato and A. thaliana has also been
identified on a genome-wide level using a comparative
mapping approach. This revealed 90 putative syntenic
blocks between potato and A. thaliana that cover 41% of
the potato genetic map, and 50% of the A. thaliana physi-
cal map [36]. These syntenic blocks were unevenly distrib-
uted over the potato genetic map, and redundant in
respect to the number of areas on the A. thaliana genome
that displayed synteny to most areas on the potato map.
The regions of microsynteny between tomato/potato and
A. thaliana that were found with the BES-based approach
described in this study could not be used to confirm or
renounce any putative higher-order syntenic regions, due
to the relatively short distances between the BAC ends.
Six paired tomato BAC end matches cluster in the 16.0 –
20.2 Mb interval of P. trichocarpa chromosome 10. Fur-
thermore, seven pairs of potato BESs map to the partially
overlapping interval between 15.2 – 19.4 Mb, indicating
the presence of either a number of distinct microsyntenic
regions, or possibly a single region of macrosynteny,
between the tomato/potato and P. trichocarpa genomes.
These findings provide an interesting starting point for a
detailed comparison between these species in this region,
once more tomato and potato genomic sequences
become available.
Conclusion
The large scale analysis of tomato and potato BESs pre-
sented in this paper revealed many interesting structural
and functional differences between the genomes of these
closely related species. We have shown that the tomato
genome is not only more repetitive than the potato
genome, but that these genomes also differ in their repeat
composition, most importantly in the distribution of
Gypsy and Copia retrotransposons. In contrast to other
studied plant genomes, we have shown that the tomato
and potato genomes contain a large number of SSRs with
a motif length of five, which may be a unique feature of
Solanaceous genomes.
Comparative analysis of the putative protein coding
regions in these BESs revealed an enrichment of these
regions in the potato genome. Moreover, several protein
families were found to be overrepresented in potato com-
pared to tomato, such as cytochrome P450 mono-oxyge-
nases and serine-threonine protein kinases. The P450
superfamily appears to have expanded dramatically in
both species compared to A. thaliana, suggesting an
expanded network of secondary metabolic pathways in
the Solanaceae.
Both tomato and potato appear to have low microsynteny
with A. thaliana, which is likely a result of this species' rel-
atively recent genomic rearrangement. A higher degree of
synteny was observed with P. trichocarpa. Difference in
evolutionary distances is not likely to be the reason for
this increased microsynteny, since both A. thaliana and P.
BMC Plant Biology 2008, 8:34 />Page 13 of 16
(page number not for citation purposes)
trichocarpa are part of the rosids clade, whereas tomato
and potato belong to the asterids clade.
Taken together, these findings present a first glimpse into
the evolution of Solanaceous genomes, both within the
family and relative to other plant species. When the com-
plete genomic sequences of these species become availa-
ble, whole-genome comparisons and protein- or repeat-
family specific studies may shed more light on the intrigu-
ing observations made in this paper.
Methods
BAC end sequences
Tomato BESs from the HBa (HindIII), Eco (EcoRI) and
Mbo (MboI) libraries were obtained from SGN FTP site
[13]. For all analyses, the 'screened_and_trimmed' sets
(bacends_combined_screened_and_trimmed.v4.seq)
were used, in which low-quality regions and vector
sequences have been trimmed, and sequences shorter
than 150 nt have been removed. Additionally, this file
excludes BESs with hits to the mitochondrial genome of
Arabidopsis thaliana [28] and the chloroplast genome of N.
tabacum (NCBI GenBank accession NC_001879.2
), based
on a BLASTN search with an E-value cutoff of 10
-10
. Potato
BESs, which have undergone quality and vector clipping,
were downloaded from the GSS section of NCBI GenBank
[37] using the query "RHPOKEY". All sequences shorter
than 150 nt and sequences with BLASTN (blastall 2.2.15)
[38] hits to the A. thaliana mitochondrial or N. tabacum
chloroplast genomes with a E-value lower than 10
-10
were
removed in order to be consistent with the tomato data.
Recently, the tomato and potato chloroplast genomes
have become available; however, it can be assumed that
the A. thaliana mitochondrial genome is sufficiently simi-
lar to these genomes, and as such additional filtering was
not deemed necessary [39,40].
Repeat density and categorization
Repeats were identified in the tomato and potato BESs
through similarity searches to the Magnoliaphyta section of
the RepBase repeat database (release 2006-10-06) [41],
using RepeatMasker 3.1.5 [42] and cross_match 0.990319
[43]. The repeat density was then calculated as the per-
centage of nucleotides in the BESs that had one or more
hits to the repeat database. Classification of repeat fami-
lies was derived from the annotation in the RepBase data-
base. Redundancy in the BESs was detected with BLASTN
(blastall 2.2.15), by comparing the tomato and potato
BES data to itself and removing all matches of a sequence
to itself. The E-value cutoff was set to 10
-5
and BLAST hits
were removed if they did not have a minimum coverage
of 50% of the query sequence with 90% identity.
Simple sequence repeats
Microsatellites were detected using a modified version of
the Sputnik software [44]. Running parameters were set to
return all SSRs spanning at least 15 nucleotides, with a
motif length between 1 and 5 (i.e., mono-, di-, tri-, tetra-,
and penta-nucleotide repeats), and a minimum score of 8.
Microsatellites identified in this manner were divided into
two classes; class I, which has 10 or more motif repeats;
and class II, which has fewer than 10 motif repeats [21].
Gene content
The gene content of the BESs was estimated through
BLAST searches using blastall 2.2.15. The BESs were com-
pared to the NCBI GenBank non-redundant protein data-
base (release 2007-02-16) [45] using BLASTX, and to the
Kazusa KTU2 tomato EST database [46] and the CAB
PotatEST potato EST database (January 2007 release) [6]
using BLASTN. For all BLAST searches an E-value cutoff of
10
-5
was used, and the best five hits were evaluated. Addi-
tionally, a 90% identity cutoff was used for the BLASTN
searches to the transcript databases.
In order to distinguish between true, putative protein-cod-
ing regions, and transposon- or contamination-related
regions, the BLAST matches to the non-redundant protein
database were filtered based on keyword matches in the
BLAST hit descriptions. An overview of the keywords that
were used to filter the BLAST results can be found in Addi-
tional File 1. In general, these keywords described
sequences that show similarity to bacterial contamina-
tion, transposon-related, chloroplast, mitochondrial and
ribosomal protein sequences. Any BLAST match that was
not filtered out by any of the keywords was considered to
represent a non-repetitive, protein-coding region.
Functional annotation
Tomato HBa and Eco, and potato POT and PPT BESs were
functionally annotated through comparisons against the
Pfam (version 21.0) [47] and PANTHER (version 6.1)
[48] protein family databases, using InterProScan 4.3.1
[49]. GO terms from the Pfam annotations, and PAN-
THER family (but not subfamily) identifiers from the
PANTHER annotations, were extracted from the merged
output file of InterProScan. For each GO term and PAN-
THER family, the number of matching tomato and potato
BESs was counted; if a single GO term or PANTHER family
was assigned to the same sequence multiple times, for
example due to multiple open reading frames in the same
sequence, it was only counted once.
Subsequently, the counts were compared pairwise using a
two-sided Fisher's exact test from the R software suite [50].
Note that GO term annotations are not always assigned
independently of each other (as is required by Fisher's
exact test), meaning that some terms often or exclusively
BMC Plant Biology 2008, 8:34 />Page 14 of 16
(page number not for citation purposes)
occur together as they both describe different aspects of a
single biological process or function. However, for sim-
plicity, these higher order dependencies between GO
terms are ignored, which may lead to an overestimation of
the number of distinct overrepresented terms. Addition-
ally, to mitigate error caused by differences in bias
between libraries made with different restriction enzymes,
direct inter-species comparisons are made only between
BESs from libraries made with the same restriction
enzyme. Lastly, the null hypothesis here is that there is no
difference in abundance for a GO term or PANTHER fam-
ily between the tomato and potato BESs, whereas the
alternative hypothesis indicates a difference. A conserva-
tive P value cut-off of 10
-4
was selected to distinguish sig-
nificant differences from non-significant differences.
Comparative genome mapping
To determine potential areas of microsynteny between the
Solanaceous species studied here and dicot model plants,
paired BESs were selected and mapped to the A. thaliana
and Populus trichocarpa genome sequences with BLASTN
alignments. Paired end sequences were available for
135,842 tomato BACs (63,169 HBa, 33,498 Eco and
39,175 Mbo) and 55,662 potato (34,362 POT and 21,300
PPT) BACs. Whole genome sequences of A. thaliana and P.
trichocarpa were downloaded from TAIR [28] and JGI [51],
respectively. The P. thrichocarpa genome sequence used in
this study was not finished, but rather consisted of a pseu-
domolecule sequence for each of the 19 chromosomes
plus an additional 177,7 Mb in 21,993 contig sequences.
For each BES, only the best match to the respective
genome sequence with an E-value lower than 10
-5
was
evaluated, and the hit was rejected if the distance between
subsequent HSPs was larger than 2000 nt. A BAC was con-
sidered to have microsynteny to the target genome if both
ends mapped within a distance of between 50 and 500 kb
of one another. When both ends were oriented properly
with respect to each other, the region was considered
colinear; otherwise, the region was considered to be rear-
ranged between the two species.
List of abbreviations
BAC = Bacterial Artificial Chromosome; BES = BAC End
Sequence; Eco = Tomato EcoRI digested BAC library; EST
= Expressed Sequence Tag; GO = Gene Ontology; HBa =
Tomato HindIII digested BAC library; HSP = High-scoring
Segment Pair; kb = kilobases; Mb = Megabases; Mbo =
Tomato MboI digested BAC library; nt = nucleotides; POT
= Potato HindIII digested BAC library; PPT = Potato EcoRI
digested BAC library; SSR = Simple Sequence Repeat.
Authors' contributions
ED conceived the study, performed all computational
analyses and drafted the manuscript. LM, RB, JG were
responsible for the BAC end sequencing of tomato and
together with RV contributed to the interpretation of the
computational analyses and provided feedback on the
final draft version of the manuscript. WS and RvH partic-
ipated in the design and coordination of the study, and
helped to draft the manuscript. All authors read and
approved the final manuscript.
Additional material
Additional file 1
This file describes the keyword filtering that has been applied after the
BLASTX searches to the non-redundant protein database, in order to dis-
tinguish between true putative protein-coding regions, and repetitive and/
or contamination-related sequences.
Click here for file
[ />2229-8-34-S1.doc]
Additional file 2
This file describes the Gene Ontology terms found in the InterProScan
analysis of the tomato and potato EcoRI digested BAC end sequences. The
columns in this Table describe the GO term, the number of BAC end
sequences in the tomato Eco and potato PPT library that had this term
assigned to them, and the P value of Fisher's exact test for the difference
of relative abundance of this GO term between these two libraries. A P
value lower than 10
-4
indicates a significant difference in the abundance
of a GO term between these libraries.
Click here for file
[ />2229-8-34-S2.xls]
Additional file 3
This file describes the Gene Ontology terms found in the InterProScan
analysis of the tomato and potato HindIII digested BAC end sequences.
The columns in this Table describe the GO term, the number of BAC end
sequences in the tomato HBa and potato POT library that had this term
assigned to them, and the P value of Fisher's exact test for the difference
of relative abundance of this GO term between these two libraries. A P
value lower than 10
-4
indicates a significant difference in the abundance
of a GO term between these libraries.
Click here for file
[ />2229-8-34-S3.xls]
Additional file 4
This file describes the Gene Ontology terms found in the InterProScan
analysis of the potato HindIII and EcoRI digested BAC end sequences. The
columns in this Table describe the GO term, the number of BAC end
sequences in the potato POT and PPT library that had this term assigned
to them, and the P value of Fisher's exact test for the difference of relative
abundance of this GO term between these two libraries. A P value lower
than 10
-4
indicates a significant difference in the abundance of a GO term
between these libraries.
Click here for file
[ />2229-8-34-S4.xls]
BMC Plant Biology 2008, 8:34 />Page 15 of 16
(page number not for citation purposes)
Acknowledgements
ED was supported by a grant from the Dutch Organization for Scientific
Research (NWO). LM, RB and JG were supported by grants from the
National Science Foundation (NSF).
References
1. Tanksley SD, Ganal MW, Prince JP, de Vicente MC, Bonierbale MW,
Broun P, Fulton TM, Giovannoni JJ, Grandillo S, Martin GB, Messeguer
R, Miller JC, Miller L, Paterson AH, Pineda O, Röder MS, Wing RA,
Wu W, Young ND: High density molecular linkage maps of the
tomato and potato genomes. Genetics 1992, 132(4):1141-1160.
2. D'Agostino N, Aversano M, Frusciante L, Chiusano ML: TomatEST
database: in silico exploitation of EST data to explore
expression patterns in tomato species. Nucleic Acids Res 2007,
35(Database issue):D901-D905.
3. Yano K, Watanabe M, Yamamoto N, Tsugane T, Aoki K, Sakurai N,
Shibata D: MiBASE: A database of a miniature tomato cultivar
Micro-Tom. Plant Biotechnology 2006, 23:195-198.
4. Van Os H, Andrzejewski S, Bakker E, Barrena I, Bryan GJ, Caromel B,
Ghareeb B, Isidore E, De Jong W, Van Koert P, Lefebvre V, Milbourne
D, Ritter E, Rouppe van der Voort JNAM, Rousselle-Bourgeois F, Van
Vliet J, Waugh R, Visser RGF, Bakker J, Van Eck HJ: Construction of
a 10,000-Marker Ultradense Genetic Recombination Map of
Potato: Providing a Framework for Accelerated Gene Isola-
tion and a Genomewide Physical Map. Genetics 2006,
173(2):1075-1087.
5. Wageningen UR Plant Breeding CBSG Potato & Tomato
Genomics Database [ />]
6. PotatEST DB [ />]
7. Bonierbale MW, Plaisted RL, Tanksley SD: RFLP Maps Based on a
Common Set of Clones Reveal Modes of Chromosomal Evo-
lution in Potato and Tomato. Genetics 1988, 120(4):1095-1103.
8. Mueller LA, Tanksley SD, Giovannoni JJ, Van Eck J, Stack S, Choi D,
Kim BD, Chen M, Cheng Z, Li C, Ling H, Xue Y, Seymour G, Bishop
G, Bryan G, Sharma R, Khurana J, Tyagi A, Chattopadhyay D, Singh
NK, Stiekema W, Lindhout P, Jesse T, Klein Lankhorst R, Bouzayen
M, Shibata D, Tabata S, Granell A, Botella MA, Giuliano G, Frusciante
L, Causse M, Zamir D: The Tomato Sequencing Project, the
first cornerstone of the International Solanaceae Project
(SOL). Comparative and Functional Genomics 2005, 6(3):153-158.
9. Arumuganathan K, Earle ED: Nuclear DNA content of some
important plant species. Plant Mol Biol 1991, 9(3):208-218.
10. Mueller LA, Solow TH, Taylor N, Skwarecki B, Buels R, Binns J, Lin C,
Wright MH, Ahrens R, Wang Y, Herbst EV, Keyder ER, Menda N,
Zamir D, Tanksley SD: The SOL Genomics Network: a compar-
ative resource for Solanaceae biology and beyond. Plant Phys-
iol 2005, 138(3):1310-1317.
11. Potato Genome Sequencing Consortium [a
togenome.net/]
12. Budiman MA, Mao L, Wood TC, Wing RA: A Deep-Coverage
Tomato BAC Library and Prospects Toward Development
of an STC Framework for Genome Sequencing. Genome Res
2000, 10(1):129-136.
13. SOL Genomics Network [ />]
Additional file 5
This file describes the Gene Ontology terms found in the InterProScan
analysis of the tomato HindIII and EcoRI digested BAC end sequences.
The columns in this Table describe the GO term, the number of BAC end
sequences in the tomato HBa and Eco library that had this term assigned
to them, and the P value of Fisher's exact test for the difference of relative
abundance of this GO term between these two libraries. A P value lower
than 10
-4
indicates a significant difference in the abundance of a GO term
between these libraries.
Click here for file
[ />2229-8-34-S5.xls]
Additional file 6
This file describes the PANTHER families found in the InterProScan anal-
ysis of the tomato and potato EcoRI digested BAC end sequences. The col-
umns in this Table describe the PANTHER family, the number of BAC
end sequences in the tomato Eco and potato PPT library that had this term
assigned to them, and the P value of Fisher's exact test for the difference
of relative abundance of this GO term between these two libraries. A P
value lower than 10
-4
indicates a significant difference in the abundance
of a GO term between these libraries.
Click here for file
[ />2229-8-34-S6.xls]
Additional file 7
This file describes the PANTHER families found in the InterProScan anal-
ysis of the tomato and potato HindIII digested BAC end sequences. The
columns in this Table describe the PANTHER family, the number of BAC
end sequences in the tomato HBa and potato POT library that had this
term assigned to them, and the P value of Fisher's exact test for the differ-
ence of relative abundance of this GO term between these two libraries. A
P value lower than 10
-4
indicates a significant difference in the abundance
of a GO term between these libraries.
Click here for file
[ />2229-8-34-S7.xls]
Additional file 8
This file describes the PANTHER families found in the InterProScan anal-
ysis of the potato HindIII and EcoRI digested BAC end sequences. The col-
umns in this Table describe the PANTHER family, the number of BAC
end sequences in the potato POT and PPT library that had this term
assigned to them, and the P value of Fisher's exact test for the difference
of relative abundance of this GO term between these two libraries. A P
value lower than 10
-4
indicates a significant difference in the abundance
of a GO term between these libraries.
Click here for file
[ />2229-8-34-S8.xls]
Additional file 9
This file describes the PANTHER families found in the InterProScan anal-
ysis of the tomato HindIII and EcoRI digested BAC end sequences. The
columns in this Table describe the PANTHER family, the number of BAC
end sequences in the tomato HBa and Eco library that had this term
assigned to them, and the P value of Fisher's exact test for the difference
of relative abundance of this GO term between these two libraries. A P
value lower than 10
-4
indicates a significant difference in the abundance
of a GO term between these libraries.
Click here for file
[ />2229-8-34-S9.xls]
BMC Plant Biology 2008, 8:34 />Page 16 of 16
(page number not for citation purposes)
14. Martin GB, Brommonschenkel SH, Chunwongse J, Frary A, Ganal
MW, Spivey R, Wu T, Earle ED, Tanksley SD: Map-based cloning
of a protein kinase gene conferring disease resistance in
tomato. Science 1993, 262(5138):1432-1436.
15. Messing J, Bharti AK, Karlowski WM, Gundlach H, Kim HR, Yu Y, Wei
F, Fuks G, Soderlund CA, Mayer KF, Wing RA: Sequence compo-
sition and genome organization of maize. Proc Natl Acad Sci U
S A 2004, 101(40):14349-14354.
16. Hong CP, Plaha P, Koo DH, Yang TJ, Choi SR, Lee YK, Uhm T, Bang
JW, Edwards D, Bancroft I, Park BS, Lee J, Lim YP: A Survey of the
Brassica rapa genome by BAC-end sequence analysis and
comparison with Arabidopsis thaliana. Mol Cells 2006,
22(3):300-307.
17. International Rice Genome Sequencing Project: The map-based
sequence of the rice genome. Nature 2005, 436(7052):793-800.
18. Arabidopsis Genome Initiative: Analysis of the genome sequence
of the flowering plant Arabidopsis thaliana. Nature 2000,
408(6814):796-815.
19. Lai CW, Yu Q, Hou S, Skelton RL, Jones MR, Lewis KL, Murray J, Eus-
tice M, Guan P, Agbayani R, Moore PH, Ming R, Presting GG: Analy-
sis of papaya BAC end sequences reveals first insights into
the organization of a fruit tree genome. Mol Genet Genomics
2006, 276(1):1-12.
20. Katti MV, Ranjekar PK, Gupta VS: Differential distribution of sim-
ple sequence repeats in eukaryotic genome sequences. Mol
Biol Evol 2001, 18(7):1161-1167.
21. Shultz JL, Kazi S, Bashir R, Afzal JA, Lightfoot DA: The development
of BAC-end sequence-based microsatellite markers and
placement in the physical and genetic maps of soybean. The-
oretical and Applied Genetics 2007, 114(6):1081-1090.
22. Cheung F, Town CD: A BAC end view of the Musa acuminata
genome. BMC Plant Biol 2007, 7(29):.
23. Mun JH, Kim DJ, Choi HK, Gish J, Debellé F, Mudge J, Denny R, Endré
G, Saurat O, Dudez AM, Kiss GB, Roe B, Young ND, Cook DR: Dis-
tribution of microsatellites in the genome of Medicago trun-
catula: a resource of genetic markers that integrate genetic
and physical maps. Genetics 2006, 172(4):2541-2555.
24. Goff SA, Ricke D, Lan TH, Presting G, Wang R, Dunn M, Glazebrook
J, Sessions A, Oeller P, Varma H, Hadley D, Hutchison D, Martin C,
Katagiri F, Lange BM, Moughamer T, Xia Y, Budworth P, Zhong J,
Miguel T, Paszkowski U, Zhang S, Colbert M, Sun WL, Chen L,
Cooper B, Park S, Wood TC, Mao L, Quail P, Wing R, Dean R, Yu Y,
Zharkikh A, Shen R, Sahasrabudhe S, Thomas A, Cannings R, Gutin A,
Pruss D, Reid J, Tavtigian S, Mitchell J, Eldredge G, Scholl T, Miller RM,
Bhatnagar S, Adey N, Rubano T, Tusneem N, Robinson R, Feldhaus J,
Macalma T, Oliphant A, Briggs S: A draft sequence of the rice
genome (Oryza sativa L. ssp. japonica). Science 2002,
296(5565):92-100.
25. Yu J, Hu S, Wang J, Wong GK, Li S, Liu B, Deng Y, Dai L, Zhou Y,
Zhang X, Cao M, Liu J, Sun J, Tang J, Chen Y, Huang X, Lin W, Ye C,
Tong W, Cong L, Geng J, Han Y, Li L, Li W, Hu G, Huang X, Li W, Li
J, Liu Z, Li L, Liu J, Qi Q, Liu J, Li L, Li T, Wang X, Lu H, Wu T, Zhu
M, Ni P, Han H, Dong W, Ren X, Feng X, Cui P, Li X, Wang H, Xu X,
Zhai W, Xu Z, Zhang J, He S, Zhang J, Xu J, Zhang K, Zheng X, Dong
J, Zeng W, Tao L, Ye J, Tan J, Ren X, Chen X, He J, Liu D, Tian W,
Tian C, Xia H, Bao Q, Li G, Gao H, Cao T, Wang J, Zhao W, Li P,
Chen W, Wang X, Zhang Y, Hu J, Wang J, Liu S, Yang J, Zhang G,
Xiong Y, Li Z, Mao L, Zhou C, Zhu Z, Chen R, Hao B, Zheng W, Chen
S, Guo W, Li G, Liu S, Tao M, Wang J, Zhu L, Yuan L, Yang H: A draft
sequence of the rice genome (Oryza sativa L. ssp. indica). Sci-
ence 2002, 296(5565):79-92.
26. Areshchenkova T, Ganal MW: Long tomato microsatellites are
predominantly associated with centromeric regions. Genome
1999, 42(3):536-544.
27. Van der Hoeven R, Ronning C, Giovannoni J, Martin G, Tanksley S:
Deductions about the number, organization, and evolution
of genes in the tomato genome based on analysis of a large
expressed sequence tag collection and selective genomic
sequencing. The Plant Cell 2002, 14(7):1441-1456.
28. TAIR [ />]
29. Schuler MA, Werck-Reichhart D: Functional genomics of P450s.
Annu Rev Plant Biol 2003, 54:629-667.
30. Nelson DR, Schuler MA, Paquette SM, Werck-Reichhart D, Bak S:
Comparative genomics of rice and Arabidopsis. Analysis of
727 cytochrome P450 genes and pseudogenes from a mono-
cot and a dicot. Plant Physiol 2004, 135(2):756-772.
31. Xu Y, Ishida H, Reisen D, Hanson MR: Upregulation of a tono-
plast-localized cytochrome P450 during petal senescence in
Petunia inflata. BMC Plant Biol 2006, 6(8):.
32. Bowers JE, Chapman BA, Rong J, Paterson AH: Unravelling
angiosperm genome evolution by phylogenetic analysis of
chromosomal duplication events. Nature 2003,
422(6930):433-438.
33. Rossberg M, Theres K, Acarkan A, Herrero R, Schmitt T, Schumacher
K, Schmitz G, Schmidt R: Comparative sequence analysis
reveals extensive microcolinearity in the lateral suppressor
regions of the tomato, Arabidopsis, and Capsella genomes.
The Plant Cell 2001, 13(4):979-988.
34. Ku HM, Vision T, Liu J, Tanksley SD: Comparing sequenced seg-
ments of the tomato and Arabidopsis genomes: large-scale
duplication followed by selective gene loss creates a network
of synteny. Proc Natl Acad Sci U S A 2000, 97(16):9121-9126.
35. Ballvora A, Jöcker A, Viehöver P, Ishihara H, Paal J, Meksem K,
Bruggmann R, Schoof H, Weisshaar B, Gebhardt C: Comparative
sequence analysis of Solanum and Arabidopsis in a hot spot
for pathogen resistance on potato chromosome V reveals a
patchwork of conserved and rapidly evolving genome seg-
ments. BMC Genomics 2007, 8(112):.
36. Gebhardt C, Walkemeier B, Henselewski H, Barakat A, Delseny M,
Stüber K: Comparative mapping between potato (Solanum
tuberosum) and Arabidopsis thaliana reveals structurally
conserved domains and ancient duplications in the potato
genome. The Plant Journal 2003, 34(4):529-541.
37. SOL Genomics Network [ />]
38. TAIR [ />]
39. NCBI dbGSS [ />]
40. Altschul SF, Madden TL, Schaffer AA, Zhang J, Zhang Z, Miller W, Lip-
man DJ: Gapped BLAST and PSI-BLAST: a new generation of
protein database search programs. Nucleic Acids Res 1997,
25:3389-3402.
41. Chung HJ, Jung DJ, Park HW, Kim JH, Cha HW, Min SR, Jeong WJ, Liu
JR: The complete chloroplast genome sequences of Solanum
tuberosum and comparative analysis with Solanaceae spe-
cies identified the presence of a 241-bp deletion in cultivated
potato chloroplast DNA sequence. Plant Cell Reports 2006,
25(12):1369-1379.
42. Daniell H, Lee SB, Grevich J, Saski C, Quesada-Vargas T, Guda C,
Tomkins J, Jansen RK: Complete chloroplast genome
sequences of Solanum bulbocastanum, Solanum lycopersi-
cum and comparative analyses with other Solanaceae
genomes. Theoretical and Applied Genetics 2006, 112(8):1503-1518.
43. Jurka J, Kapitonov VV, Pavlicek A, Klonowski P, Kohany O, Walichie-
wicz J: Repbase Update, a database of eukaryotic repetitive
elements. Cytogenet Genome Res 2005, 110:462-467.
44. RepeatMasker [ />]
45. Green Group [ />]
46. EST-SSRs From Wheat, Barley And Rice [http://
wheat.pw.usda.gov/ITMI/EST-SSR/LaRota/]
47. GenBank [ />]
48. Micro-Tom Database [ />]
49. Finn RD, Mistry J, Schuster-Bockler B, Griffiths-Jones S, Hollich V,
Lassmann T, Moxon S, Marshall M, Khanna A, Durbin R, Eddy SR, Son-
nhammer EL, Bateman A: Pfam: clans, web tools and services.
Nucleic Acids Res 2006, 34(Database issue):D247-D251.
50. Mi H, Guo N, Kejariwal A, Thomas PD: PANTHER version 6: pro-
tein sequence and function evolution data with expanded
representation of biological pathways. Nucleic Acids Res 2007,
35(Database issue):D247-D252.
51. Mulder NJ, Apweiler R, Attwood TK, Bairoch A, Bateman A, Binns D,
Bork P, Buillard V, Cerutti L, Copley R, Courcelle E, Das U, Daugh-
erty L, Dibley M, Finn R, Fleischmann W, Gough J, Haft D, Hulo N,
Hunter S, Kahn D, Kanapin A, Kejariwal A, Labarga A, Langendijk-
Genevaux PS, Lonsdale D, Lopez R, Letunic I, Madera M, Maslen J,
McAnulla C, McDowall J, Mistry J, Mitchell A, Nikolskaya AN,
Orchard S, Orengo C, Petryszak R, Selengut JD, Sigrist CJ, Thomas
PD, Valentin F, Wilson D, Wu CH, Yeats C: New developments in
the InterPro database. Nucleic Acids Res 2007, 35(Database
issue):D224-D228.
52. The R Project For Statistical Computing [http://www.r-
project.org/]
53. Joint Genome Institute [ />]