Biodiversity Databases: Techniques, Politics, and Applications - Chapter 5 ppsx
Bạn đang xem bản rút gọn của tài liệu. Xem và tải ngay bản đầy đủ của tài liệu tại đây (1.21 MB, 26 trang )
37
5
A Comparison between
Morphometric and
Artificial Neural Network
Approaches to the Automated
Species Recognition
Problem in Systematics
Norman MacLeod, M. O’Neill and Steven A. Walsh
CONTENTS
Abstract 37
5.1 Introduction 38
5.1.1 The Need for Automated Species Recognition in Systematics 38
5.1.2 Approaches 40
5.1.3 Objectives 43
5.1.4 Materials and Methods 43
5.1.5 Results 47
5.1.6 Discussion 53
5.1.6.1 Which Approach? 53
5.1.6.2 Scope for Synthesis? 57
5.1.6.3 Further Research Directions? 57
5.1.6.4 Status within the Systematics Community? 58
5.2 Summary and Conclusions 60
Acknowledgements 61
References 61
ABSTRACT
One approach to addressing long-standing concerns associated with the taxonomic imped-
iment and occasional low reproducibility of taxonomic data is through development of
automated species identication systems. Such systems can, in principle, be combined
with image-based or image- and text-based taxonomic databases to add elements of expert
system functionality. Two generalized approaches are considered relevant in this context:
morphometric systems based on some form of linear discriminant analysis (LDA) and
TF1756.indb 37 3/26/07 1:12:26 PM
© 2007 by Taylor & Francis Group, LLC
38 Biodiversity Databases
articial neural networks (ANNs). In this investigation, digital images of 202 specimens
representing seven modern planktonic foraminiferal species were used to compare and
contrast these approaches in terms of system accuracy, generality, speed and scalability.
Results demonstrate that both approaches could yield systems whose models of morpholog-
ical variation are over 90% accurate for small data sets. Performance of distance- and land-
mark-based LDA systems was enhanced substantially through application of least-squares
superposition methods that normalize such data for variations in size and (in the case of
landmark data) two-dimensional orientation. Nevertheless, this approach is practically lim-
ited to the detailed analysis of small numbers of species by a variety of factors, including
the complexity of basis morphologies, speed and sample dependencies. An ANN variant
based on the concept of a plastic self-organizing map combined with an n-tuple classier
was found to be marginally less accurate, but far more exible, much faster and more robust
to sample dependencies. Both approaches are considered valid within their own analytic
domains, and both can be usefully synthesized to compensate for their complementary
deciencies. Based on these results (as well as others reviewed here), it is concluded that
fast and efcient automated species recognition systems can be constructed using available
hardware and software technology. These systems would be sufciently accurate to be of
great practical value notwithstanding the fact that the already impressive performance of
current systems can be improved further with additional development.
5.1 INTRODUCTION
5.1.1 the Need for automated SpecieS recoGNitioN iN SyStematicS
The automated identication of biological species has been something of a holy grail among
taxonomists and morphometricians for several decades. Many multivariate morphometrics
textbooks of the 1970s and 1980s contained chapters dealing with aspects of the discrimi-
nation problem, often basing those discussions on R.A. Fisher’s classic treatment of dis-
criminations among three Iris species (e.g., Sokal and Sneath 1963; Blackith and Reyment
1971; Pimentel 1979; Neff and Marcus 1980; Reyment et al. 1984). Despite these introduc-
tions to the quantitative side of the object classication problem, progress in designing
and implementing practical systems for fully automated species identication has proven
frustratingly slow. Discounting passive taxonomic databases, some of which contain semi-
automated interactive keys (e.g., MacLeod 2000, 2003), we are aware of no such systems in
routine operation within any area of biological or palaeontological systematics.
The reasons for this lack of progress are many-fold. Development of such systems pres-
ents a formidable challenge that, until recently, was beyond the technological capabilities of
existing information technology. Even though these hardware limitations of such systems
have largely been addressed, software development remains complex and well beyond the
programming skills of most classically trained systematists. This, combined with (1) a lack
of interest in and appreciation of the subtleties of taxonomic identication by most pro-
gramming specialists, mathematicians, articial intelligence experts, etc.; (2) the enormous
range of morphologies that must be dealt with in order to construct a practical identica-
tion system for any but trivial purposes; and (3) a genuine reticence on the part of the sys-
tematics community to prioritize such a technology-driven research programmes have (we
believe) conspired to limit the progress that clearly needs to be achieved in this area.
TF1756.indb 38 3/26/07 1:12:26 PM
© 2007 by Taylor & Francis Group, LLC
A Comparison between Morphometric and Artificial Neural Network Approaches 39
The reasons why progress in this area must be made are also manifold. Perhaps most
important of these is the looming taxonomic impediment. Put crudely, the world is running
out of specialists who can identify the very biodiversity whose preservation has become
such a global concern (e.g., Gaston and May 1992). This expertise deciency cuts as deeply
into those commercial industries that rely on accurate species identications (e.g., agricul-
ture, biostratigraphy) as it does into the capabilities of a wide range of pure and applied
research programmes (e.g., conservation, biological oceanography, climatology, ecology).
While most scientists recognize the existence and serious implications of this phenomenon,
hard data on the taxonomic impediment’s size are difcult to come by.
One indication, however, is provided by a recent American Geological Institute report
on the status of academic geoscience departments that shows that, between the 1980s and
1990s, the number of palaeontology–stratigraphy theses and dissertations completed per
annum declined by 50%, and the number of palaeontology–stratigraphy faculty positions
fell by a greater amount than for any other geoscience discipline (e.g., geophysics, structure/
tectonics). Moreover, the average age of geoscience faculty members in 2000 was almost
twice the average age in 1986. In commenting on this problem in palaeontology as long ago
as 1993, Roger Kaesler recognized the following:
…[W]e are running out of systematic paleontologists who have anything approaching synop-
tic knowledge of a major group of organisms [p. 329]. Paleontologists of the next century are
unlikely to have the luxury of dealing at length with taxonomic problems…[and] will have to
sustain its level of excitement without the aid of systematists, who have contributed so much
to its success [p. 330].
A second reason why research effort is needed in the systematic application of auto-
mated object recognition technology centers around the need to improve the consistency
and reproducibility of taxonomic data. At present it is commonly, though informally,
acknowledged that the technical, taxonomic literature of all organismal groups is littered
with examples of inconsistent and incorrect identications (e.g., Godfrey 2002). This is due
to a variety of factors, including authors being insufciently skilled in making distinctions
between species; insufciently detailed original species descriptions and/or illustrations;
authors using different rules of thumb in recognizing the boundaries between morpho-
logically similar species; authors having inadequate access to the current monographs and
well-curated collections; and, of course, authors having different opinions regarding the
status of different species concepts. Peer review only weeds out the most obvious errors
of commission or omission in this area and then only when the author provides adequate
illustrations of the specimens in question. Systematics is not alone among intellectual disci-
plines in confronting problems of this sort, but systematics is well behind other sciences in
making progress toward their resolution or, indeed, even in acknowledging their scope.
Another reason for considering an automated approach to the species identication
problem is that classical systematics has much to gain, practically and theoretically, from
such an initiative. It is now widely recognized that the days of taxonomy as the individu-
alistic pursuit of knowledge about species in splendid isolation from funding priorities and
economic imperatives are rapidly drawing to a close. In order to attract personnel and
resources, morphology-based taxonomy must transform itself into a ‘large, coordinated,
international scientic enterprise’ (Wheeler, 2003, p. 4). Many have recently touted use of
TF1756.indb 39 3/26/07 1:12:27 PM
© 2007 by Taylor & Francis Group, LLC
40 Biodiversity Databases
the Internet, especially via the World Wide Web, as the medium through which this trans-
formation can be made (e.g., Godfrey 2002; Wheeler 2003; Wheeler et al. 2004). While
establishment of a virtual, GeneBank-like system for accessing morphological information
would be a signicant step in the right direction (see MacLeod 2002a), improved access to
specimen images and text-based descriptions alone will not address the taxonomic impedi-
ment or low reproducibility issues successfully.
Instead, the inevitable subjectivity associated with making critical decisions on the
basis of qualitative criteria must be reduced or, at the very least, embedded within a more
formally analytical context. A properly designed, exible, robust, automated species recog-
nition system organized around the principles of a distributed computing architecture can,
in principle, produce such a system.
In addition, the process of taxonomic identication must be endowed with better ways of
capturing the memory and preserving the reasoning behind particular taxonomic decisions
so that these can be reconstructed objectively and independently for subsequent evaluation.
This would allow taxonomy to accumulate information over time in a much more efcient
way than it does now and so achieve the highly desirable property of ever increasing accu-
racy through use. Continued reliance on individualistic and entirely qualitative forms of
identication and data recording will not achieve this goal.
To be of optimal use, an automated identication system could be designed to operate
in authoritative (for routine identications) or interactive modes, the latter of which could
be used by specialists to develop and/or test hypotheses of character-state identication/dis-
tribution that bear on the question of species discrimination and/or group membership. In
this way, such systems could function as active partners in systematic research as well as
passive bookkeepers or databases of research results, even to the point of checking exist-
ing museum collections for identication correctness and consistency. Finally, all this must
be done in a manner that does not impose particular types of species concepts on users or
constrain the types of information that can be used to delineate taxonomic groups.
5.1.2 a
pproacheS
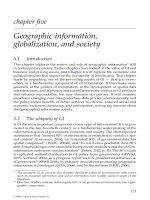
To date, there have been two generalized approaches to the design of systematic species
recognition systems. The morphometric approach (Figure 5.1A) uses a series of linear dis-
tance variables or landmarks to quantify the size and size/spatial distribution (respectively)
of a specimen’s morphological features relative to one another (e.g., Young et al. 1996).
By sampling aspects of the morphology that characterizes known species in the form of
training sets of authoritatively identied specimens, models of intraspecic variation can
be constructed. Models so constructed for different species can then be contrasted with one
another using a variety of multivariate procedures (e.g., cluster analysis, principal compo-
nents analysis, discriminant analysis, canonical variates analysis).
These methods use the selected aspects of the specimen’s size and shape to construct
a continuous, multivariate feature space within which all members of the training set may
be located. Once constructed this biologically determinded (by virtue of the measurements
selected) feature space can be used to dene partitions within this space that delimit the
boundaries between the a priori training set groups. Unknown specimens can then be iden-
tied by collecting these same data, using them to project the specimen into the partitioned
feature space, and assigning it to the group into whose partition it falls. (Note: Depending
TF1756.indb 40 3/26/07 1:12:27 PM
© 2007 by Taylor & Francis Group, LLC
A Comparison between Morphometric and Artificial Neural Network Approaches 41
on how the intergroup partitions are dened, the object may fall outside the range of any
species whose limits have been established by this method, in which case the object would
remain unassigned.)
The second approach to automated object recognition uses a computational approxi-
mation of human neural systems — an articial neural net, or ANN — to achieve dis-
crimination (Figure 5.1B). The ‘neurons’ of this system are switches designed to open or
remain closed based on the strength of generalized input signals (e.g., pixel brightness
FIGURE 5.1 Alternative conceptual approaches to the species identication problem. A. Linear
multivariate approaches use covariance or correlation indices to assess the structure of biologi-
cally meaningful geometric relations between individuals (e.g., principal components analysis) or
between groups (e.g., canonical variates analysis) and then employs these to construct an optimized
linear, multidimensional, feature space that can be subdivided into group-specic domains. B. Arti-
cial neural networks use layers of switches that can be assigned variable weights connected into a
network. These switch arrays can then be trained to discriminate between objects based on general-
ized input data fed into each switch through recursive, trial and error weight adjustment. Once the
network has been trained, the weight scheme can, in principle, be used to construct a generalized,
non-linear, multidimensional feature space.
TF1756.indb 41 3/26/07 1:12:28 PM
© 2007 by Taylor & Francis Group, LLC
42 Biodiversity Databases
values). Banks of these articial neurons are arranged in two or more series; the connec-
tions between neurons are able to be assigned numerical weights that amplify or diminish
the strength of the signal as it passes along interneuron paths (Bishop 1995; Ripley 1996;
Schalkoff 1997).
Instead of partitioning a selected measurement-dened feature space, ANNs achieve dis-
crimination by being trained on inputs from a priori training sets of authoritatively identied
specimens. This training amounts to recursive adjustment of the interneuron weights until the
desired output (optimal identication of training set objects) is achieved. Once an optimum
weight scheme has been determined on the basis of these training sets, unknown objects are
identied by submitting their input signals to the system. Because of the more general nature
of the ANN switches and the fact that the weight scheme is determined recursively, ANN
systems utilize a greater variety of input observations than morphometric approaches.
Both approaches have advantages and disadvantages. Morphometric systems are poten-
tially more efcient for well-dened data sets of similar morphologies because they can
concentrate on morphological features known or suspected to be reliable species discrimi-
nators. Morphometric systems can, however, also become limited if the best morphological
targets for group discrimination are unknown, if the morphology is sufciently complex
(so as to render automated feature extraction and/or measurement from images unreliable)
or if the morphology is sufciently simple (so as to reduce the number of common and
consistently expressed morphological features available for measurement). Articial neural
networks can accommodate a greater variety of input signals (e.g., pixel brightness and/or
colour values), but the ability to work with greater amounts and more generalized types
of spatial information can make signal extraction more difcult. Standard, or supervised,
ANNs can suffer from being time consuming to tune. Bollmann et al. (2004, p. 14) noted
that tuning of the COGNIS supervised ANN system on image set of 14 coccolith species
containing 1000 images took ‘several hours’, while tuning for a two-species 2000-image
set took ‘over 30 hours’.
Both morphometric and supervised ANN approaches also suffer from the fact that their
weight schemes are linked deterministically to the group-level contrasts over which they
have been optimized. Consequently, addition of even a single new species to the set requires
complete recalibration of all multivariate feature space partitions and weight schemes for
the interneuron connections. Finally, there is the practical issue of scalability. In order to be
practical, an automated object recognition system must be able to extract unique features
from and be optimized over hundreds of species whose morphological distinctions range
from the obvious to the very subtle.
One recent development in ANN technology that addresses some deciencies of super-
vised ANNs has been the development of unsupervised variants such as Kohonen-based
algorithms, including plastic self-organizing maps (PSOM; Lang and Warwick 2002),
which are variants of Lucas continuous n-tuple classiers (Lucas 1997). This type of ANN
incorporates an aspect of articial intelligence (dynamic learning) into its algorithms that
obviates the need to recalibrate the interneuron weight scheme completely. Under this
approach, such recalibrations as are necessary can usually be handled in real time as new
training sets are added to the system. Gaston and O’Neill (in press) report that n-tuple/
PSOM systems also respond well to the modeling of non-linear regions within shape–space
distributions, which are known to be problematic for many (though not all) types of mor-
phometric approaches (Bookstein 1991).
TF1756.indb 42 3/26/07 1:12:28 PM
© 2007 by Taylor & Francis Group, LLC
A Comparison between Morphometric and Artificial Neural Network Approaches 43
5.1.3 objectiveS
Owing to the importance of achieving a robust solution to the automated object recogni-
tion problem in biological taxonomy and to the potential of recent developments in the
area of unsupervised ANN technology, we intend to begin a systematic evaluation of the
various approaches to this generalized problem here, with a comparison of relative levels
of performance between distance- and landmark-based canonical variates analysis (cur
-
rently the most popular morphometric method for achieving group-based discriminations)
and an implementation of the
n-tuple/PSOM approach (the most advanced of the ANN-
based techniques, but one that has yet to be tested directly against any alternative method).
The objectives of this investigation are fourfold: to compare and contrast the (1) accuracy;
(2) generality; (3) speed; and (4) scalability of these approaches. This comparison will
focus entirely on species recognition aspects of the system design problem; no effort will
be devoted to addressing the issues of automated image acquisition or automated feature
extraction (see Bollmann et al. 2004).
The subjects of this test will be a set of images of seven modern planktonic foraminiferal
species picked from core-top sediments collected from the western Atlantic Ocean. Plank-
tonic foraminifera represent very desirable subjects for this type of investigation because
their systematics is based entirely on morphological features;
they are studied and identied entirely through the use of two-dimensional,
remote images;
their taxonomy is stable and well known;
they are used in a wide variety of scientic contexts (e.g., oceanography, biogeog
-
raphy, marine ecology, climatology);
a small number of species can encompass a large proportion of the total morpho-
logical diversity; and
they constitute a morphologically representative subset of a large, but not enormous,
fossil fauna that has considerable utility in an even broader array of contexts (e.g.,
foraminiferal systematics is a key biostratigraphic tool for petroleum exploration).
In other words, success in constructing a practical and reliable system for automatically
identifying planktonic foraminiferal species should have considerable economic as well as
intellectual and symbolic value.
5.1.4 m
aterialS aNd methodS
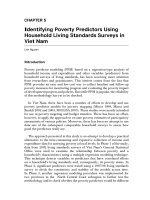
This comparison was conducted on a small sample of monochrome digital images of seven
planktonic foraminiferal species (Figure 5.2). Representative specimens of each species
were picked randomly from a Vema Cruise core-top sample (sample no. V24-99 50) col
-
lected from the Baltimore Canyon, offshore New Jersey, USA. All images were taken with
a colour digital video camera at relatively low resolution (72 dpi). Aside from photograph
-
ing all specimens in umbilical view, no extraordinary attempts were made to correct speci-
men orientation or use composite images to improve image quality. The reason for this was
that, in order to be practical, any automated species identication system will need to work
with images that can be collected quickly, inexpensively and in as automated a manner as
possible. Likewise, all images were brought to a consistent exposure using the autolevel
•
•
•
•
•
•
TF1756.indb 43 3/26/07 1:12:28 PM
© 2007 by Taylor & Francis Group, LLC
44 Biodiversity Databases
routines of standard image processing software (e.g., Adobe Photoshop, Graphic Converter)
running in scripted mode.
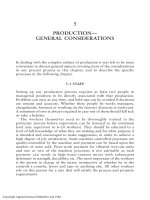
For morphometric analysis, coordinate data for a set of 11 discrete landmarks were col-
lected from each specimen’s image (Figure 5.3). Because of limited morphological homol-
ogy among these species in umbilical view geometric data could only be collected from the
nal three chambers and approximated the coordinate positions of each chamber’s major
axes. In principle, these data could have been taken from each specimen without having to
capture the specimen’s image. In order to ensure comparability with the ANN results, how-
ever, all landmark coordinates were collected from the same images employed in the ANN
analysis. In order to evaluate the best type of morphometric data for use in this context,
FIGURE 5.2 Planktonic foraminiferal species used in this investigation with representative illus-
trations of image qualities used to assess two-dimensional patterns of intraspecic variation. These
images were captured quickly, using standard resolution video cameras with no time taken for ne
adjustment of exposure, depth of eld or specimen orientation.
TF1756.indb 44 3/26/07 1:12:29 PM
© 2007 by Taylor & Francis Group, LLC
A Comparison between Morphometric and Artificial Neural Network Approaches 45
these landmark points were used to represent morphological variation as a set of six inter-
landmark distances (the classical morphometric variables) and as raw x,y coordinate loca-
tions (the preferred geometric morphometric variable type).
Two sets of distance data were constructed, one from the raw landmark coordinates and
the other from the coordinate locations after least-squares superposition (Bookstein 1991).
This allowed evaluations of size-referenced and size-normalized representations of mor-
phological variation to be evaluated for their interspecic discriminant power. In the case
of the purely landmark-based analysis, only superposed landmarks were used, as is typical
of geometric morphometric analyses.
Multivariate discriminant analysis was carried out on these data using canonical vari-
ates analysis (CVA; see Blackith and Reyment 1971; Pimentel 1979; Reyment et al. 1984).
Each training set was constructed from measurements (see earlier discussion) taken from
the images of authoritatively identied specimens. No additional data transformations were
carried out prior to CVA analysis.
As noted by Campbell and Atchley (1981), CVA performs within-group, variance–cova-
riance standardization prior to between-groups eigenanalysis. When applied to superposed
landmark data directly, this has the effect of distorting the Procrustes distance metric for
representing within-group relations among specimens. Because of this standardization, use
of CVA and related approaches (e.g., MANOVA, MANCOVA) should always be applied
with caution to such data. Specically, no attempts should be made to interpret the details
FIGURE 5.3 Morphometric data types used in this investigation. Each specimen (upper row) was
characterized morphologically through measurement of the coordinate locations of 11 landmarks
that quantify the major dimensions of the last three chambers (ultimate, penultimate and prepenul-
timate). These landmarks were then used to construct data sets of interlandmark distances (middle
row) and superposed landmark arrays (bottom row).
TF1756.indb 45 3/26/07 1:12:29 PM
© 2007 by Taylor & Francis Group, LLC
46 Biodiversity Databases
of within-group ordinations within the shape spaces dened by CVA axes. The geom-
etry of between-groups ordinations are more faithfully preserved in such spaces, but even
these may be distorted relative to results obtained by methods specically designed to pre-
serve the landmark-based Procrustes metric (e.g., relative warps analysis, coordinate-point
eigenshape analysis). Throughout, it must be kept in mind that the appropriate use of such
methods is restricted to testing the hypothesis of a priori group distinctiveness in a multi-
variate context and facilitating the identication of objects based on measurement sets that
can be projected into the (distorted) canonical variates shape space.
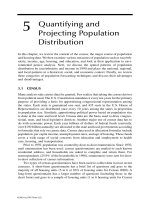
The PSOM/n-tuple ANN approach to species identication was implemented by the
digital automated image-analysis system (DAISY; Weeks et al. 1997, 1999a, b). This imple-
mentation accepts training sets in the form of standard format images (e.g., jpeg, tiff)
of authoritatively identied specimens. These image-based training sets were processed
(1) by reducing each image’s spatial resolution (via subsampling) to a 32 × 32 pixel grid;
(2) by transforming each image’s 32 × 32 pixel grid from a Cartesian to a polar format
(Figure 5.4), and 3) by adjusting each image’s pixel-level spectrum to achieve brightness
histogram equalization. The rst step in this process represents an empirically determined
optimum resolution needed to maximize the signal-to-noise ratio and quantify topologi-
cal correspondences. The second allows the analysis to utilize spatially irregular regions
of interest as well as the more traditional rectilinear image boundaries. The third reduces
interimage variations and renders the image input easy to correct for the effects of incon-
sistent pose due to lighting/exposure artefacts.
Once DAISY had processed all images in the training set, a discriminant space was cal-
culated by applying the PSOM/n-tuple classier to the training set composed of the polar-
formatted, 32 × 32 pixel images. The proximate basis for this classication is a pairwise
FIGURE 5.4 Examples of input for the articial neural network trial. Each specimen’s image
(upper row) was subsampled to a 32 × 32 pixel grid, standardized for variations in exposure using
image-histogram equalization, and transformed from a Cartesian to a polar pixel coordinate system
(bottom row). The RGB brightness values for each pixel constitute a multivariate vector represent-
ing each image. These values correspond to the measurements and landmark coordinates used as
observations in the morphometric data analyses.
TF1756.indb 46 3/26/07 1:12:31 PM
© 2007 by Taylor & Francis Group, LLC
A Comparison between Morphometric and Artificial Neural Network Approaches 47
comparison between brightness values between pixel locations. The result allows each
object in each training set to be placed into a multidimensional, distance-based ordination
space whose character can be varied based on the estimated afnity (estimated via cross-
correlation) between similarly processed images of unknown specimens and the training-
set array. It is this ability to modify the character of the base training set ordination that
gives the DAISY implementation of the unsupervised ANN concept its adaptive quality.
Identications are achieved by assessing the eightfold nearest-neighbour coordination
between each unknown and the training-set ordination.
5.1.5 r
eSultS
Table 5.1 summarizes the cross-validation results for each of the four analyses. Each analy-
sis returned results that were highly accurate and consistent with the overwhelming major-
ity of training set measurements being allocated to their correct groups within the empirical
discrimination space. Nevertheless, each result also reveals strengths and weaknesses of
the respective analytic approaches and data.
The traditional, interlandmark distance-based CVA returned 91% correct cross-validated
identications for the 202 specimens based on six generalized distances taken from the ulti-
mate, penultimate and prepenultimate chambers in umbilical view. This result is unexpect-
edly high owing to the fact that neither the absolute nor the relative dimensions of these nal
three chambers have been judged to be critical to the correct identication of any of these
species previously (e.g., Kennett and Srinivasan 1983; Bolli and Saunders 1985). Typical raw
distance-based, cross-validation analyses for marine microplankton yield correctness ratios
of 0.7 to 0.9 (e.g., see Culverhouse et al. 2003). This isolated correct identication score can
be misleading, however, unless it is put into context by summarizing the strength of sup-
port for each identication. This is especially important in that the robust identication of
unknown objects should be undertaken in light of precisely such assessments.
Examination of the posterior identication probabilities for the data set taxa (sum-
marized in Figure 5.5) provides a more nuanced understanding of the result. Of the 202
specimens used to construct the discriminant space, 184 were identied correctly. Of these,
only 114 (62%) were identied with a probability of 0.95 or higher. Taking these results, in
addition to the incorrect identications, into consideration this data set exhibits a condent
identication ratio (probability ≥ 0.95) of only 0.56.
One factor affecting the discrimination efciency of raw, interlandmark distance data
is the confounding of size and shape variation. Each of these seven species exhibits a range
of sizes with much between-species overlap and distinction (Figure 5.6). Yet, the primary
features used for qualitative species identication are shape differences between compo-
nent parts of the organism’s skeleton.
Using the least-squares superposition method (Bookstein 1991), it is possible to standard-
ize these landmark data for generalized size differences and then recalculate the interland-
mark distances so that they form a more faithful summary of distinctions solely attributable
to between-species shape differences. When these size-standardized distances are used to
construct the discriminant space, the raw ratio of correct cross-validation identications
rises to an impressive 0.96 (Table 5.1). Even more impressive, though, are the improve-
ments in the amount of statistical support available for these identications (Figure 5.7).
Of the 193 specimens identied correctly, 154 (80%) had a posterior correct identication
TF1756.indb 47 3/26/07 1:12:31 PM
© 2007 by Taylor & Francis Group, LLC
48 Biodiversity Databases
TABLE 5.
1
Results of
Cross-
Validation
T
ests for Canonical
Variates
Analysis
(C
VA) and Artificial
Neural
Network
Analysis
(D
AISY)
of
2
02 Planktonic
Foraminiferal
S
pecimens
Ge.
aequilat. Gl.
conglob. Gl.
ruber Gl.
sacculifer Gr.
truncat. Gr.
tumida
S. dehiscens Total Correct
Raw
distance-based
CV
A
Ge. aequilateralis 20 0 0 1 0 5 0 26 0.77
Gl. conglobatus 0 30 1 0 0 0 0 31 0.97
Gl. ruber 0 2 37 0 0 0 0 39 0.95
Gl. sacculifer 0 0 0 33 0 0 0 33 1.00
Gr. truncatulinoides 0 0 0 1 23 0 2 26 0.88
Gr. tumida 4 0 0 0 0 20 0 24 0.83
S. dehiscens 0 0 0 0 2 0 21 23 0.91
Total
correct 24 32 38 35 25 25 23 202 0.91
Superposed
distance-based
CV
A
Ge. aequilateralis 23 0 0 0 0 3 0 26 0.88
Gl. conglobatus 0 29 1 1 0 0 0 31 0.94
Gl. ruber 0 0 39 0 0 0 0 39 1.00
Gl. sacculifer 0 1 0 32 0 0 0 33 0.97
Gr. truncatulinoides 0 0 0 1 25 0 0 26 0.96
Gr. tumida 0 0 0 0 0 24 0 24 1.00
S. dehiscens 0 1 0 0 1 0 21 23 0.91
Total
correct 23 31 40 34 26 27 21 202 0.96
Superposed
landmark-based
CV
A
Ge. aequilateralis 25 0 0 0 0 1 0 26 0.96
Gl. conglobatus 0 30 1 0 0 0 0 31 0.97
Gl. ruber 0 0 39 0 0 0 0 39 1.00
Gl. sacculifer 0 0 0 33 0 0 0 33 1.00
Gr. truncatulinoides 0 0 0 0 26 0 0 26 1.00
Gr. tumida 0 0 0 0 0 24 0 24 1.00
S. dehiscens 0 0 0 0 0 0 23 23 1.00
Total
correct 25 30 40 33 26 25 23 202 0.99
DAISY
Ge. aequilateralis 26 0 0 0 0 0 0 26 1.00
Gl. conglobatus 0 30 0 1 0 0 0 31 0.97
Gl. ruber 0 0 39 0 0 0 0 39 1.00
Gl. sacculifer 0 0 1 31 0 0 0 33 0.94
Gr. truncatulinoides 0 0 0 0 26 0 0 26 1.00
Gr. tumida 0 0 0 0 0 24 0 24 1.00
S. dehiscens 0 0 0 0 0 0 23 23 1.00
Total
correct 26 30 40 32 26 24 23 202 0.99
TF1756.indb 48 3/26/07 1:12:32 PM
© 2007 by Taylor & Francis Group, LLC
A Comparison between Morphometric and Artificial Neural Network Approaches 49
TABLE 5.1
Results of Cross-Validation Tests for Canonical Variates Analysis (CVA) and Artificial Neural Network Analysis (DAISY)
of 202 Planktonic Foraminiferal Specimens
Ge. aequilat. Gl. conglob. Gl. ruber Gl. sacculifer Gr. truncat. Gr. tumida S. dehiscens Total Correct
Raw distance-based CVA
Ge. aequilateralis 20 0 0 1 0 5 0 26 0.77
Gl. conglobatus 0 30 1 0 0 0 0 31 0.97
Gl. ruber 0 2 37 0 0 0 0 39 0.95
Gl. sacculifer 0 0 0 33 0 0 0 33 1.00
Gr. truncatulinoides 0 0 0 1 23 0 2 26 0.88
Gr. tumida 4 0 0 0 0 20 0 24 0.83
S. dehiscens 0 0 0 0 2 0 21 23 0.91
Total
correct 24 32 38 35 25 25 23 202 0.91
Superposed distance-based CVA
Ge. aequilateralis 23 0 0 0 0 3 0 26 0.88
Gl. conglobatus 0 29 1 1 0 0 0 31 0.94
Gl. ruber 0 0 39 0 0 0 0 39 1.00
Gl. sacculifer 0 1 0 32 0 0 0 33 0.97
Gr. truncatulinoides 0 0 0 1 25 0 0 26 0.96
Gr. tumida 0 0 0 0 0 24 0 24 1.00
S. dehiscens 0 1 0 0 1 0 21 23 0.91
Total
correct 23 31 40 34 26 27 21 202 0.96
Superposed
landmark-based
CV
A
Ge. aequilateralis 25 0 0 0 0 1 0 26 0.96
Gl. conglobatus 0 30 1 0 0 0 0 31 0.97
Gl. ruber 0 0 39 0 0 0 0 39 1.00
Gl. sacculifer 0 0 0 33 0 0 0 33 1.00
Gr. truncatulinoides 0 0 0 0 26 0 0 26 1.00
Gr. tumida 0 0 0 0 0 24 0 24 1.00
S. dehiscens 0 0 0 0 0 0 23 23 1.00
Total
correct 25 30 40 33 26 25 23 202 0.99
DAISY
Ge. aequilateralis 26 0 0 0 0 0 0 26 1.00
Gl. conglobatus 0 30 0 1 0 0 0 31 0.97
Gl. ruber 0 0 39 0 0 0 0 39 1.00
Gl. sacculifer 0 0 1 31 0 0 0 33 0.94
Gr. truncatulinoides 0 0 0 0 26 0 0 26 1.00
Gr. tumida 0 0 0 0 0 24 0 24 1.00
S. dehiscens 0 0 0 0 0 0 23 23 1.00
Total
correct 26 30 40 32 26 24 23 202 0.99
TF1756.indb 49 3/26/07 1:12:32 PM
© 2007 by Taylor & Francis Group, LLC
50 Biodiversity Databases
probability of 0.95 or higher. Thus, simply standardizing interlandmark distance data for
size variation resulted in an increase in the number of condent identications by 24%.
Of course, for the past 15 years the eld of morphometrics has been moving away from
the use of interlandmark distance measurements in favour of statistical operations on the
two- or three-dimensional landmark coordinates (e.g., Bookstein 1986, 1991; Rohlf and
FIGURE 5.5 Histogram of posterior probabilities for the cross-validation study of the raw, inter-
landmark distance-based canonical variates analysis. Different shaded boxes represent numbers of
specimens included in various degree of support categories. See text for discussion.
FIGURE 5.6 Size variation in the seven planktonic foraminiferal data set used in this investiga-
tion. Horizontal line indicates range of centroid-size values. Open box represents ±1.0 standard
deviations from the mean. Vertical lines indicate position of the sample means. Note wide degree of
size variation within and between species.
TF1756.indb 50 3/26/07 1:12:32 PM
© 2007 by Taylor & Francis Group, LLC
A Comparison between Morphometric and Artificial Neural Network Approaches 51
Bookstein 1990; Marcus et al. 1993, 1996; MacLeod and Forey 2002). These variables
have the advantage of being able to quantify a much greater proportion of the underlying
morphology than can be assessed with scalar distances alone. In terms of the present analy-
sis, use of the 11 landmark coordinates captures aspects of chamber size, chamber shape,
chamber orientation, relative degree of chamber ination, chamber appression, the number
of chambers in the nal whorl, height of the primary aperture, degree of interchamber
suture incision, umbilicus position, umbilicus size and umbilicus shape. Unlike the directed
scalar distances used in the rst two analyses, many of these characters are considered
important in the specic diagnosis of these species (see Kennett and Srinivasan 1983; Bolli
and Saunders 1985).
Once again, using least-squares superposition to normalize the coordinate data for
generalized size differences (thereby achieving an entirely shape-based discrimination)
and employing CVA to construct a discriminant space, an unprecedented correct cross-
validation identication ratio of 0.99 was obtained (Table 5.1 and Figure 5.8). Of the two
misidentied specimens, a Globigerinelloides conglobatus was mistaken completely for
Globigerinelloides ruber (posterior probability = 1.00) while a Globigerinella inaequilate-
ralis was ambiguously mistaken for Globorotalia tumida (posterior probability = 0.67).
Cross-validation results for the DAISY-based ANN analysis differ from those of the
CVA analysis in terms of the manner in which the posterior probabilities are calculated.
Instead of using a distance-based approach for assigning unknowns to groups, DAISY
uses a combined eightfold distance-coordination approach with the minimum coordina-
tion value for identication set to three. This amounts to projecting each unknown into
a discrete feature space and determining the identity of its eight nearest neighbors. Once
these identities are known, a variety of statistical measures of the strength of support for a
particular identication can be generated.
However, because only eight known comparators are used to evaluate the support strength
of each identication, the posterior probability scale is discrete rather than continuous and
falls off rapidly if there is any disagreement in group membership. For example, if the
FIGURE 5.7 Histogram of posterior probabilities for the cross-validation study of the superposed,
interlandmark distance-based canonical variates analysis. Differently shaded boxes represents num-
bers of specimens included in various degree of support categories. See text for discussion.
TF1756.indb 51 3/26/07 1:12:32 PM
© 2007 by Taylor & Francis Group, LLC
52 Biodiversity Databases
images of an unknown specimen’s six nearest neighbors all belong to group 1 and those of
the two remaining nearest neighbors belong to group 2, the strength of support is reported
as 0.75. This biases the DAISY results against high posterior probability values for any
identication that is less than perfect, but it also results in the imposition of a very conser-
vative rule base for making identication decisions.
Despite the far more generalized nature of the data used to construct the feature space
and the less unforgiving rules used for determining identications, the DAISY cross-valida-
tion results are fully comparable to best results that were able to be obtained through CVA
(see Table 5.1), with only marginally lower posterior probabilities of identication support
(Figure 5.9). In this context, it is important to note how much better DAISY performance
FIGURE 5.8 Histogram of posterior probabilities for the cross-validation study of the superposed,
landmark coordinate-based canonical variates analysis. Differently colored boxes represent num-
bers of specimens included in various degree of support categories. See text for discussion.
FIGURE 5.9 Histogram of posterior probabilities for the cross-validation study of the DAISY-
based PSOM/n-tuple articial neural network analysis. Differently shaded boxes represent numbers
of specimens included in various degree of support categories. See text for discussion.
TF1756.indb 52 3/26/07 1:12:33 PM
© 2007 by Taylor & Francis Group, LLC
A Comparison between Morphometric and Artificial Neural Network Approaches 53
was over performances of traditional distance-based CVA using raw or processed (super-
posed) data, both in terms of raw numbers of correct identications (0.91 vs. 0.96 vs. 0.99)
and in terms of the number of well-supported (p ≥ 0.95) identications (0.56 vs. 0.76 vs.
0.93). The only linear discriminant method that produced results comparable to those of the
DAISY-based ANN implementation was a superposed landmark-based canonical variates
analysis.
5.1.6 d
iScuSSioN
Figure 5.10 illustrates a comparison of the results obtained by this study with those of other
semi-automated and automated systems for species identication based on morphological
characteristics. This comparison conrms that results obtained from superposed distance
and superposed landmark CVA, along with the DAISY results for this selection of plank-
tonic foraminiferal species, are among the best that have been obtained to date for compa-
rably sized data sets. The obvious questions are
1. Which approach (morphometric or ANN) holds the greater promise for use in cre
-
ating a practical, general purpose, fully automated object recognition system?
2. Is there any scope for combining these approaches to achieve even greater perfor-
mance levels?
3. What research remains to be done before such a system can be realized?
4. What should be the systematics community’s attitude to these technological
developments?
5.1.6.1 Which Approach?
Although superposed distance and superposed landmark LDA approaches achieved mar-
ginally superior performance in terms of per cent correct identications, there are several
practical considerations that, we believe, will limit the ability of these methods to contrib-
ute to solutions of the overall automated species identication problem. The foraminiferal
analysis undertaken here involved a small number of species. Indeed, LDA for the purpose
of species identication almost always involves a small number of species (e.g., Gaston and
O’Neill, 2004). The reasons for this are twofold. First and most supercially, since such
studies are not typically regarded as mainstream systematics, they tend to be — like this
study — demonstrations designed to describe and explore new approaches to LDA analysis.
Such demonstrations do not require large data sets because their purpose does not usually
include any examination of the scalability problem.
The fact that this latter part of a more generalized challenge is rarely addressed leads
to the second, more substantive difculty. The information input necessary for application
of LDA methods to medium-scale (50–100 species) and large-scale (100+ species) data sets
will be practical only for very complex morphologies. As a minimum condition, any system
containing n groups can only be resolved completely in a discriminant space containing
n – 1 dimensions. Thus, the LDA solution of a 50-group problem implies the collection of
49 different variables on which to base the construction of a fully resolved LDA space. If
one were to adopt a superposed landmark-based approach, this could be achieved via the
specication of 25 landmarks that could be located on all taxa. However, the minimum
TF1756.indb 53 3/26/07 1:12:33 PM
© 2007 by Taylor & Francis Group, LLC
54 Biodiversity Databases
number of landmarks that can be used to describe individuals within such a measurement
system is determined by the
least morphologically complex taxon.
The operation of this principle is well illustrated by the foraminiferal analysis under-
taken in this study. Even though a majority of species contain more than three chambers
in their nal whorl (see Figure 5.1), assessment of shape variation based on the ultimate,
penultimate and prepenultimate chambers was necessitated because these were the only
chambers visible in umbilical view for some of the included species (Globigerinelloides
ruber, Globigerinelloides sacculifer, Sphaerodinella dehiscens). If, for example, the com-
mon modern planktonic foraminiferal species Orbulina universa had been included in the
study group (see Figure 5.11), a substantial change to the measurement strategy would have
been required because the adult skeleton of this species is composed of a single chamber
that envelops all others, rendering the penultimate and prepenultimate chambers invisible.
FIGURE 5.10 Comparison between the results obtained by this investigation (open circles) and
those tabulated by Gaston and O’Neill (2004) for the delity of linear discriminant analysis (A) and
articial neural networks (B) used for automated species identication in a variety of organismal
groups.
TF1756.indb 54 3/26/07 1:12:34 PM
© 2007 by Taylor & Francis Group, LLC
A Comparison between Morphometric and Artificial Neural Network Approaches 55
The effect of basing a morphometric LDA on only the ultimate chamber shape of each
species would have been to degrade the power of this analysis class severely. Under such a
strict measurement protocol, it is questionable whether sufcient morphological resolution
could be achieved to completely resolve the discriminant space for even the seven group
problem.
It is also important to note that a necessarily corollary to the characterization of morpho-
logical variation through morphometric methods is the often time-consuming and skilled
nature of the data-collection task. Even using sophisticated landmark collection software
(e.g., ImageJ, tpsDig), assembly of landmark data for all 202 specimens took approximately
seven hours of quite tedious work and required the technician to possess a detailed famil
-
iarity with the morphological character of each species. It is doubtful that accurate data of
this type could be collected by anyone not already familiar enough with the taxonomy of
the group to provide a reliable identication in much less time. [Note: While it is true that
automated landmark location software does exist, these programmes must themselves be
tuned to operate efciently on different morphologies, and then tested in a similarly time-
consuming, and group-limited manner.]
The DAISY implementation of the ANN approach circumvents this data collection
problem by assuming that comparisons between objects useful in addressing the discrimi
-
nation problem can be made on the basis of pixel matching across the entire 32 × 32 pixel
FIGURE 5.11 Example image for the planktonic foraminiferal species Orbulina universa. The
spherical, ultimate chamber of this species completely envelops all previous chambers, hiding them
from view. If this species had been included in the data set, only morphometric data from the
ultimate chamber of each species would have been able to have been collected, and even then the
detailed topological correspondence between landmarks collected from different species would
not have been able to have been preserved. As a result, the ability of all investigated morphometric
approaches to species discrimination would have been compromised severely. However, inclusion
of this species would not have affected any aspect of data collection for the DAISY-based PSOM/n-
tuple approach nor engendered any pronounced effect on its results.
TF1756.indb 55 3/26/07 1:12:34 PM
© 2007 by Taylor & Francis Group, LLC
56 Biodiversity Databases
frame. This approach relaxes the morphometric requirement for landmarks to represent
a comparatively small number but biologically well-known set of close topological cor-
respondences between objects in favour of more inclusive information drawn from the
spatial distribution of non-specic group features. Though not as biologically sensitive as
the strict morphometric data collection protocol, the DAISY/ANN approach has the desir-
able property of collecting a large amount of data — including some proportion of three-
dimensional data — and being able to be automated completely. In our foraminiferal study,
the subsampling required to match images across the data set took less than four minutes
by an algorithm that was not designed to operate at maximum speed.
Such considerations lead to a series of recommendations regarding the future roles of
these two generalized approaches to automated object recognition. First, morphometric
and ANN approaches should not be seen as competitors, but rather as complements, each
with marked strengths within its own domain. The domain of morphometric analysis is
that of investigating biologically meaningful comparisons between forms. This biological
meaning is provided by the selection of landmarks. Thus, the feature space within which
morphometric comparisons are made is explicitly biological and incontrovertibly tied to the
analyst’s mapping of biological meaning onto the morphology.
The domain of ANN approaches (as used here) is that of investigating geometrically
meaningful comparisons between forms. Since no biologically grounded decisions are
made with respect to which regions of the morphology need to be tracked or otherwise
emphasized, biological information is not input into the ANN analytic design in the man-
ner of a morphometric investigation. Rather, biology may be input via the selection of indi-
viduals composing each group-specic training set. The word ‘may’ is used in the previous
sentence advisedly. Articial neural net systems accept such generalized input that, in a
very real sense, biological considerations are beside their point. In this way they are more
like pure outline-based morphometric analyses (e.g., Fourier methods, standard eigenshape
analysis) in which biologically-based landmark mappings play little or no role. The fact that
landmark and outline-based analyses can yield similar results, coupled with recent work
on landmark-outline hybrid methods (e.g., Bookstein et al. 1999; MacLeod 1999), suggests
both approaches are limited by complimentary deciencies: morphometric methods are
rich in biological meaning, but decient in overall geometric information content while
ANN methods are rich in overall information content, but decient in biological meaning.
A synthesis between the two is not only possible, but highly desirable.
Until such a synthesis is achieved, however, it makes sense to match the available
strengths of each approach to the diversity of morphological problems at hand. Mor-
phometrics would appear to be best utilized for the investigation of precise distinctions
between small groups of morphologically similar species. In such situations, the strengths
of a detailed, geometric analysis based on landmark-to-landmark matchings are difcult
to ignore. The morphological scope and degree of automation that can be brought to such
analyses can be extended by switching the measurement collection strategy to one based on
outlines + landmarks rather than using landmarks (or outlines) in isolation (see Bookstein
et al. 1999; MacLeod 1999).
Conversely, ANN approaches appear better suited to the characterization of more gen-
eralized distinctions between larger groups of morphologically diverse species and their
use in α-taxonomic contexts. In these situations the advantages of the greatly expanded
diversity of morphologies that can be included, in addition to more complete automation
TF1756.indb 56 3/26/07 1:12:34 PM
© 2007 by Taylor & Francis Group, LLC
A Comparison between Morphometric and Artificial Neural Network Approaches 57
and greater speed in obtaining correct identications, are equally clear. Moreover, the fora-
miniferal analysis results presented above suggest that the inevitable reduction in identica-
tion accuracy induced by the relaxation of close topological correspondence need only be
minor and that the cost/benet ratio for time and effort favours the use ANN approaches
even in the case of relatively small samples.
5.1.6.2
Scope for Synthesis?
As indicated above, we believe there is considerable scope for synthesis between aspects
of the geometric morphometric and ANN approaches. In particular, the advantages of the
prior processing of interlandmark distance and landmark data using least-square superposi
-
tion were impressive. In morphometric contexts, size information need not be lost from the
system of measurements through this procedure, but can be tracked along with shape as a
separate variable (e.g., centroid size; see Bookstein 1986, 1991). The DAISY/ANN imple-
mentation could benet from inclusion of a similar superposition routine that would ensure
greater conformance of the basis images prior to subsampling, thereby ensuring greater
levels of topological correspondence across the 32 × 32 pixel maps.
At the moment, this need is handled by a region-of-interest (ROI) routine that pro-
vides users with the ability to outline specic features of the specimens and/or segment the
image into distinct specimen and background components. This is presently a somewhat
time-consuming process that compromises aspects of the ANN approach (e.g., time spent
dealing with each image). By strictly limiting the number of landmarks used as the basis
for superposition, though, this strategy should be able to be employed successfully by tech-
nicians who have low degrees of taxonomic familiarity with the specimens whose images
they are processing. There is also considerable scope for maximizing the distinctiveness of
each target set image through image warping, though this would introduce an element of
sample dependency to the ANN results. Regardless, superposition and image unwarping
offer many advantages in interface design as well as in strictly analytical contexts.
On the morphometric side, there is no reason to suppose that PSOM/n-tuple methods
could not be applied to fully morphometric data as easily as they are applied to distance
data created from pixel maps. Irrespective of its accuracy when used with high-quality
superposed landmark data, LDA (along with other multivariate methods) suffers from a pro-
nounced sample sensitivity. This dependency can be ameliorated in principle by obtaining
an adequate sample from the population of interest (see MacLeod, 2002b, for an example).
In most cases, though, the results of one analysis cannot be adjusted easily to accommo-
date the inclusion of new objects in previously dened groups, much less the addition of
new groups to the discriminant space. PSOM/n-tuple methods were created to address this
issue, which is just as problematic for standard morphometric data analysis techniques as it
is for ANNs. Accordingly, their application in fully morphometric contexts must be judged
as holding considerable promise.
5.1.6.3
Further Research Directions?
For morphometric and ANN approaches, one of the most important needs is for better
specication of adequate training set attributes. In the technical literature produced on
these methods over the years, scarcely any but the most general statements about the com
-
position and nature of reliable training sets have been made. To be sure, a large body of
TF1756.indb 57 3/26/07 1:12:34 PM
© 2007 by Taylor & Francis Group, LLC
58 Biodiversity Databases
information on statistical sampling theory exists and this should be consulted more often.
Nevertheless, training set composition embodies several unique aspects of sample design
that have not been explored to date in any systematic manner.
Two aspects of the training set composition issue well illustrated by the foregoing fora-
miniferal analyses in the context of morphometric approaches are those of specimen ori-
entation and landmark specication. As was noted in the Materials and Methods section,
no extraordinary efforts were made to correct inconsistent specimen orientation outside
the convention of only including specimens positioned in umbilical view. The reason for
this was to mimic what was likely to be the image quality standard that would be available
to a technician who needed to make rapid identications with a minimum of specimen
handling. At the outset of our investigation, it was expected that this inconsistency would
introduce a measure of error to the results that could compromise some proportion of the
identications.
Similarly, no extraordinary measures were used to ensure that landmark locations were
taken at precisely the same locations relative to the underlying morphologies. Rather, these
admittedly broad location concepts were ‘eyeballed’ in quickly with the emphasis on col-
lecting these data as quickly, rather than as carefully, as possible. Despite these consciously
inexacting standards, all LDA analyses returned high-quality results — especially those that
employed superposition as a preprocessing step. This leads us to suspect that, while no one
should ever advocate imprecision as a desirable goal, slavish and time-consuming devotion
to absolute minimization of orientation and digitizer error is not required in order to obtain
useful results, at least in the context of planktonic foraminiferal species identication.
For ANN approaches, the investigation of training set composition needs is different
and, if anything, even broader in scope. Owing to the more generalized types of data that
may be used in such systems, an opportunity exists to explore strategies for creating train-
ing sets that cover more than a single view of each specimen. For example, a training set
could, in principle, be constructed such that it included images of specimens in the standard
umbilical, spiral and edge views. Given sufcient distinction between species included in
the training set, this may make it possible to construct multiview models of within-species
variation and use of these to identify specimens regardless of the orientation a specimen
presents to the camera. Additionally, studies seeking to quantify the relation between train-
ing set size and identication accuracy for unknown specimens will be important in order
to provide more information about the most likely identication for ambiguously deter-
mined specimens. Indeed, the entire issue of posterior probability estimation will likely
need to be revisited in the context of ANN discriminations, as will the power of different
classication algorithms in the identication of different shape classes.
5.1.6.4
Status within the Systematics Community?
Throughout this study we have been struck by the negative reception the concept of auto
-
mated species recognition attracts from many of the taxonomists it is ultimately designed to
aid (see also Gaston and O’Neill, in press). Typical objections include allusions to automated
systems being too error prone, too complex, too expensive, too slow, and so forth. In many
discussions there is also a concern expressed that resources devoted to the development of
such systems are wasted and would be better spent training and paying real taxonomists.
TF1756.indb 58 3/26/07 1:12:35 PM
© 2007 by Taylor & Francis Group, LLC
A Comparison between Morphometric and Artificial Neural Network Approaches 59
Through this investigation, we have attempted to address empirically a number of these
concerns. Systems that can authoritatively achieve consistent, semi-automated and fully
automated identications of planktonic microfossil species — and, by extension, many
other types of species — to an accuracy of better than 90% over a time frame that ranges
from approximately double (LDA) to a small fraction (ANN) of the time it would take a
human specialist to accomplish the same task can be constructed at modest expense using
available technology. Should this technology become embedded within a distributed, public
access computing environment (e.g., the Internet, local intranets), the systematics commu-
nity would gain a powerful argument for making additional systematic information available
throughout academic, public and industrial sectors. Such systems would represent critical,
value-added components to already planned international database initiatives and would go
a long way to meeting the challenges posed by the taxonomic impediment successfully.
In addition to these considerations, however, a move toward placing automated species
recognition at the strategic centre of twenty-rst century systematics would have many
additional and direct benets to the science of systematics. The more obvious of these are:
Improved access to research funding. Most research councils (e.g., NSF, NERC,
BBSRC, EPSRC, EU) have established interdisciplinary science as the cornerstone
of the funding strategies for the foreseeable future. There is also a decided prefer-
ence for ‘big science’ as opposed to individual investigator projects. Automated
species recognition projects require an interdisciplinary approach and, while they
can be pursued at the small-group level, lend themselves to the assembly of large
groups of diverse specialists working toward a common aim. At the very least,
funding sources for engineering, mathematics and computer science projects could
become targets for teams that include a substantial systematics component.
Improved ability to take on large-scale biodiversity projects. A major factor hold-
ing back the development of large-scale systematics projects (e.g., biodiversity sur-
veys, synoptic revisions of taxonomy) is the lack of adequate time and manpower
to perform to necessary taxonomic identications to a high degree of accuracy.
Automated species recognition projects can play a substantial role in making such
projects tractable and fundable.
New source of information regarding taxonomic characters. Systematics has long
acknowledged a need for the constant discovery of new characters and character
states for use in correctly and consistently recognizing species, populations, etc. At
the moment, this process of character/character state discovery is pursued through
qualitative approaches yielding decidedly mixed results (e.g., MacLeod 2002b).
Automated species recognition systems can operate in authoritative or interactive
modes. In this latter context they can become partners with human specialists in
systematic research guiding the discovery and testing of new characters and ren-
ing the understanding of old characters.
Reinvigoration of the discipline of morphological systematics. In the face of chal-
lenges such as DNA bar coding and GeneBank, morphological systematics must
become more automated and efcient or it will cease to exist outside a few irreduc-
ibly morphology-based refugia (e.g., palaeontology). Because of their generality,
automated species (= image) recognition systems can be used in a wide variety
•
•
•
•
TF1756.indb 59 3/26/07 1:12:35 PM
© 2007 by Taylor & Francis Group, LLC
60 Biodiversity Databases
of contexts to integrate different data types and facilitate their combined analy-
sis. This ability extends across the spectrum of systematic data (e.g., morphol-
ogy, ecology, geography, stratigraphic, chemical, molecular, audio, olfactory, DNA
barcodes, SDS protein gel images) and extends well into the quasi-systematic and
non-systematic realms.
5.2 SUMMARY AND CONCLUSIONS
In his 1993 review of the status of palaeontological systematics, Roger Kaesler characterized
the pros and cons of expert systems and human expertise as shown in Table 2 in his paper.
Since 1993, expert systems, in the form of automated species recognition systems, have
made signicant strides to address several of their deciencies while losing none of their
inherent advantages. Human expertise in taxonomic identication, on the other hand, while
not being in any way degraded in principle, has become rarer in the sense that each passing
year sees more experienced taxonomists retiring or otherwise becoming unavailable while
fewer students — none with the synoptic knowledge gained over a lifetime’s engagement
with taxonomic issues — step up to take their places. At the same time funding for taxo-
nomic research projects is diminishing, morphological systematics training programmes
are closing, and bright students are being attracted into other specialties or leaving the
eld altogether. One positive way to address this situation is to do what human beings have
done ever since the Industrial Revolution when faced with a high-volume and complex, but
repetitive, task that needs to be done quickly, consistently and correctly: automate.
A demonstration analysis involving 202 specimens of modern planktonic foraminifera
drawn from seven species has shown that traditional distance-based LDA, superposed dis-
tance-based LDA, superposed landmark LDA and PSOM/n-tuple ANN approaches can all
construct better than 90% correct and consistent discriminant spaces for use in the identi-
cation of unknown specimens. Performance of the LDA approach is substantially improved
when used in conjunction with superposed landmark data, even when data are collected
rapidly from inconsistently oriented, low-quality images in a single orientation. The LDA
approach suffers, however, from being semi-automatic, time consuming, labour intensive
and working best when all training set objects are morphologically similar.
The PSOM/n-tuple ANN approach can be fully automated, is very time efcient and
can be used with a very large diversity of morphologies, but appears marginally less accu-
rate (6.0%) owing to its reliance on gross pixel mapping, which is, in turn, the source of its
analytic exibility. This having been said, LDA and ANN approaches represent substantial
improvements in terms of accuracy and consistency over human expertise where experi-
ments show identication reproducibilities can be as low as 30% or lower.
Future developments of LDA and ANN approaches can benet from cross-fertilization
in several areas, especially use of superposition/image unwarping methods to standardize
ANN training set images and use of PSOM/n-tuple methods to construct discriminant
spaces based on morphometric data. Given the very positive result of our initial investiga-
tion of this topic, we see considerable promise in pursuing such development. Overall, it is
to be hoped the systematics community will come to appreciate the potential of automated
species identication systems to address a number of outstanding problems in systematic
theory and practice.
TF1756.indb 60 3/26/07 1:12:35 PM
© 2007 by Taylor & Francis Group, LLC
A Comparison between Morphometric and Artificial Neural Network Approaches 61
ACKNOWLEDGEMENTS
The idea for this contribution was formulated by the senior author during a public debate
on new directions in foraminiferal research held at the FORAMS 2002 Conference in
Perth, Australia. NM extends his special thanks to R.K. Olsson and I. Premoli-Silva for the
inspirational quality of their comments on automated species recognition methods. Discus-
sion of the relation between geometric morphometric and ANN approaches also beneted
greatly from written comments supplied by F. L. Bookstein, who kindly and comprehen-
sively reviewed a previous draft. Funds in support of this study were provided by a Museum
Research Fund grant from The Natural History Museum, London.
REFERENCES
Bishop, C.M. (1995) Neural networks for pattern recognition. Clarendon Press, Oxford.
Blackith, R.E. and Reyment, R.A. (1971)
Multivariate morphometrics. Academic Press, London.
Bolli, H.M. and Saunders, J.B. (1985) Oligocene to Holocene low latitude planktic foraminifera.
In
Plankton stratigraphy, ed. H.M. Bolli, J.B. Saunders, and K. Perch-Nielsen. Cambridge
University Press, Cambridge, 155–262.
Bollmann, J., Quinn, P.S., Vela, M., Brabec, M., Brechner, S., Cortés, M.Y., Hilbrecht, H., Schmidt,
D.N., Schiebel, R., and Thierstein, H.R. (2004) Automated particle analysis: Calcareous micro
-
fossils, ETH, Zurich ( />Bookstein, F.L. (1986) Size and shape spaces for landmark data in two dimensions.
Statistical Sci-
ence 1: 181–242.
Bookstein, F.L. (1991)
Morphometric tools for landmark data: Geometry and biology. Cambridge
University Press, Cambridge.
Campbell, N.A. and Atchley, W.R. (1981) The geometry of canonical variate analysis.
Systematic
Zoology 30: 268–280.
Culverhouse, P.F., Williams, R., Reguera, B., Herry, V., and González-Gils, S. (2003) Do experts
make mistakes?
Marine Ecology Progress Series 247: 17–25.
Gaston, K.J. and May, R.M., Taxonomy of taxonomists,
Nature 356, 281–282, 1982.
Gaston, K.J. and O’Neill, M.A. (in press) Automated species identication — Why not?
Philosophi-
cal Transactions of the Royal Society of London.
Ginsburg, R.N. (1997) An attempt to resolve the controversy over the end-Cretaceous extinction
of planktic foraminifera at El Kef, Tunisia, using a blind test. Introduction: Background and
procedures.
Marine Micropaleontology 29: 67–68.
Godfrey, H.C.J. (2002) Challenges for taxonomy.
Nature 417: 17–19.
Kaesler, R.L. (1993) A window of opportunity: Peering into a new century of paleontology.
Journal
of Paleontology 67: 329–333.
Kennett, J.P. and Srinivasan, S. (1983)
Neogene planktonic foraminifera: A phylogenetic atlas.
Hutchinson Ross, Stroudsbourg, PA.
Lang, R. and Warwick, K. (2002) The plastic self-organizing map. In
World conference on compu-
tational intelligence.
Lucas, S.M. (1997) Face recognition with the continuous
n-tuple classier. In British machine vision
conference, 222–231.
MacLeod, N. (1998) Impacts and marine invertebrate extinctions. In
Meteorites: Flux with time and
impact effects, ed. N.M. Grady, R. Hutchinson, G.J.H. McCall, and D.A. Rotherby. Geological
Society of London, London, 217–246.
MacLeod, N. (1999) Generalizing and extending the eigenshape method of shape visualization and
analysis.
Paleobiology 25(1): 107–138.
TF1756.indb 61 3/26/07 1:12:35 PM
© 2007 by Taylor & Francis Group, LLC