OCEANOGRAPHIC PROCESSES OF CORAL REEFS: Physical and Biological Links in the Great Barrier Reef - Chapter 4 pot
Bạn đang xem bản rút gọn của tài liệu. Xem và tải ngay bản đầy đủ của tài liệu tại đây (213.74 KB, 15 trang )
Runoff of Terrestrial
Sediment and Nutrients
into the Great Barrier Reef
World Heritage Area
Miles Furnas and Alan Mitchell
CONTENTS
Introduction . . . . . . . . . . . . . . . . . . . . . . . . . . . . . . . . . . . . . . . . . . . . . . . . . . . . . . . 37
Catchments Adjoining the GBR . . . . . . . . . . . . . . . . . . . . . . . . . . . . . . . . . . . . . . . 38
Suspended Sediments in North Queensland Rivers . . . . . . . . . . . . . . . . . . . . . . . . 41
Dissolved and Particulate Nutrients in North Queensland Rivers. . . . . . . . . . . . . . 42
Nutrient Transformations within Catchments . . . . . . . . . . . . . . . . . . . . . . . . . . . . . 43
Discussion . . . . . . . . . . . . . . . . . . . . . . . . . . . . . . . . . . . . . . . . . . . . . . . . . . . . . . . . 44
Acknowledgments. . . . . . . . . . . . . . . . . . . . . . . . . . . . . . . . . . . . . . . . . . . . . . . . . . 47
References . . . . . . . . . . . . . . . . . . . . . . . . . . . . . . . . . . . . . . . . . . . . . . . . . . . . . . . . 47
INTRODUCTION
Nutrients (e.g., C, N, P, trace metals) are the elemental building blocks of all marine
ecosystems, including coral reefs. The quantity, form, and availability of nutrients
directly affect ecosystem productivity and the quality of the water upon which the
health of corals and other reef organisms ultimately depend. While corals can grow
in a variety of shallow-water tropical habitats and in waters with a range of suspended
sediment loads and nutrient concentrations, well-developed reef ecosystems only
occur where the waters are typically characterised by low suspended particulate and
dissolved nutrient concentrations. Extensive coral reefs do not typically develop or
persist where nutrient and suspended sediment concentrations are acutely or chroni-
cally very high.
Nutrients which support the productivity of ecosystems of the Great Barrier Reef
(GBR) come from a variety of sources. These include shelfbreak upwelling of sub-
surface waters from the Coral Sea (Furnas & Mitchell, 1996), biological nitrogen
fixation (Larkum et al., 1988; Bell et al., 1999), benthic (Alongi, 1989) and pelagic
(Ikeda et al., 1982; Hopkinson et al., 1987) mineralisation of organic matter,
4
37
© 2001 by CRC Press LLC
38 Oceanographic Processes of Coral Reefs
disturbances of shelf sediments (Ullman & Sandstrom, 1987; Chongprasith, 1992),
sewage discharges (Brodie, 1992), and terrestrial runoff (Moss et al., 1993; Furnas
et al., 1995; Mitchell et al., 1996 and 1997).
Terrestrial runoff is the largest source of nutrients directly influenced by human
activities, largely through the runoff of agricultural fertilisers and land use practices
which accelerate soil erosion. Neither the magnitude of terrestrial inputs of sediment
and nutrients to the GBR nor the effects of terrestrially derived nutrients on ecosys-
tems within the GBR are well constrained at this time. Based upon spatial estimates
of agricultural land use and associated soil loss, Moss et al. (1993) and Rayment and
Neil (1997) calculated that sediment and nutrient runoff have increased severalfold
since the beginning of European cropping and pastoral activities in the catchments
adjoining the GBR.
CATCHMENTS ADJOINING THE GBR
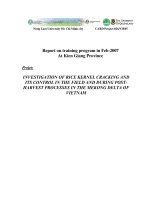
Continental drainage basins with an aggregate area of 425,000 km
2
drain into the
Great Barrier Reef World Heritage Area (GBRWHA) between the tip of Cape York
and Fraser Island (Figure 1, Table 1). A variety of vegetation types and land uses
occur in these basins. In areas of high rainfall, particularly between 15 and 18°S, rain-
forest and wet coastal forests originally predominated. A considerable proportion of
the GBR catchment has been logged or cleared to some degree, particularly in the
coastal lowlands or flatter terrains. In terms of economic return and nutrient (fer-
tiliser) inputs, sugarcane cultivation is the principal agricultural activity in the GBR
catchment though the total area planted is Ͻ3% of the total catchment area (Gilbert,
2000). Most of the remaining area of the GBR catchment is or was covered by wood-
lands or savanna woodlands. Open range cattle grazing is the principal land use in
these areas.
The most complete record of gauged runoff into the GBRWHA (1968 to 1994)
averaged close to 40 km
3
of freshwater per year, ranging between 11 km
3
(1987) and
125 km
3
(1974). Taking account of basin areas, rainfall distributions in each basin,
and basin rainfall–runoff relationships, average annual freshwater runoff is estimated
to be 66 km
3
, with extremes of 20 and 180 km
3
. The average annual freshwater dis-
charge from the two largest river systems, the Burdekin and Fitzroy (16.4 km
3
year
Ϫ1
), accounts for 25% of the average total freshwater runoff. Total annual gauged
discharge into the GBRWHA is strongly correlated with total annual discharge from
these two rivers (r
2
ϭ 0.8).
Within catchments, runoff of freshwater is strongly seasonal (Figure 2), and
within seasons, also closely coupled to rainfall inputs. Several seasonal patterns in
runoff from regional river systems are evident. Runoff from the relatively small, wet,
tropical catchments of the central GBR (Daintree, 16°S to Tully Rivers, 18°S) is char-
acterised by several events per wet season. Inter-annual variability in total runoff
from these catchments is relatively small. Although wet tropical catchments comprise
only 3% of the total GBR catchment area, 22% of the total freshwater runoff is
derived from them.
Discharge from the monsoonal catchments of Cape York (e.g., Normanby River)
and the dry catchments of the southern half of the GBR (e.g., Burdekin and Burnett
© 2001 by CRC Press LLC
Runoff of Terrestrial Sediment and Nutrients into the Great Barrier Reef 39
TABLE 1
Summary Statistics for Major Catchment Basins Draining into the Great Barrier Reef Region
Area Percent Annual Runoff (km
3
)
*
Average (mm) Adj. Runoff
Basin Name (km
2
) Gauged Mean Maximum Minimum Rainfall Runoff % Runoff Volume (km
3
)
Jacky-Jacky Creek 2,963 0
635 2.63
Olive-Pascoe Rivers 4,179 30.7 3.71 7.14 0.27 1,187 888 0.75 3.71
Lockhart River 2,883 0
1,225 1.92
Stewart River 2,743 17.2 1.21 2.30 0.01 1,222 441 0.36 1.21
Normanby River 24,408 32.9 4.95 17.49 0.60 1,185 203 0.17 4.95
Jeannie River 3,637 18.9 1.54 4.69 0.13 1,344 423 0.32 1.54
Endeavour River 2,104 28.0 1.82 4.92 0.44 1,939 865 0.45 1.82
Daintree River 2,192 39.1 1.26 3.52 0.11 2,492 575 0.23 1.26
Mossman River 466 11.6 0.59 1.21 0.18 2,208 1,265 0.57
0.59
Barron River 2,902 89.2 0.81 2.66 0.16 1,453 279 0.19 0.81
Mulgrave-Russell Rivers 1,983 48.1 3.64 7.21 1.32 3,016 1,836 0.61 3.64
Johnstone River 2,325 59.4 4.67 9.12 1.65 2,996 2,009 0.67 4.67
Tully River 1,683 87.5 3.29 5.37 1.24 2,855 1,954 0.68 3.29
Murray River 1,107 13.6 1.06 2.60 0.38 2,098 958 0.46 1.06
Herbert River 9,843 86.9 4.01 11.99 0.53 1,506 407 0.27
4.01
Black River 1,057 32.8 0.38 1.54 0 1,530 360 0.23 0.38
Ross River 1,707 55.8 0.49 3.37 0.01 1,027 287 0.28
0.49
Haughton River 4,044 68.1 0.74 3.18 0.02 888 183 0.21 0.74
Burdekin River 130,126 99.9 10.29 54.46 0.52 727 79 0.11 10.29
Don River 3,695 16.0 0.75 3.66 0 1,045 203 0.19 0.75
Proserpine River 2,535 13.2 1.08 3.95 0.02 1,360 426 0.31 1.08
O’Connell River 2,387 30.1 1.54 4.19 0.07 1,469 645 0.44 1.54
Pioneer River 1,570 92.3 1.19 5.15 0 1,385 758 0.55 1.19
continued
© 2001 by CRC Press LLC
40 Oceanographic Processes of Coral Reefs
TABLE 1 (continued)
Area Percent Annual Runoff (km
3
)
*
Average (mm) Adj. Runoff
Basin Name (km
2
) Gauged Mean Maximum Minimum Rainfall Runoff % Runoff Volume (km
3
)
Plane Creek 2,539 19.4 1.49 4.97 0.05 1,125 587 0.52 1.49
Styx River 3,012 0
1,010 0.59
Shoalwater 3,605 0
975 0.60
Waterpark Creek 1,835 13.0 1.11 2.68 0.23 860 605 0.70 1.11
Fitzroy River 142,537 95.3 6.08 23.22 0.18 735 43 0.06 6.08
Calliope River 2,236 58.1 0.30 1.08 0.02 790 134 0.17 0.30
Boyne River 2,590 88.2 0.29 2.40 0 968 112 0.12 0.29
Baffle Creek 3,996 36.9 0.78 3.03 0.08 893 195 0.22 0.78
Kolan River 2,901 79.7 0.41 2.10 0.02 1,065 141 0.13
0.41
Burnett River 33,248 97.9 1.15 6.37 0.12 763 35 0.05 1.15
Burrum River 3,358 13.6 0.55 2.36 0.03 766 164 0.21 0.55
Mary River 9,440 50.3 2.72 9.27 0.26 1,174 288 0.25 2.72
Note: Average rainfall calculated by overlaying basin boundaries on the long-term isohyet map. Basin areas, gauged runof
f (1968–1994), and rainfall data obtained from the
Queensland Department of Natural Resources.
*10
9
m
3
ϭ 1 km
3
ϭ 1 million megalitres (10
6
Ml).
© 2001 by CRC Press LLC
Runoff of Terrestrial Sediment and Nutrients into the Great Barrier Reef 41
Rivers) are typically characterised by a single major event per year. The magnitude
of this event can vary dramatically between years. In the drier southern catchments,
several years may pass between significant runoff events. For example, no major
floods have occurred in the Fitzroy River since 1991.
The largest flows in all catchment types are most frequently associated with
intense rainfall derived from tropical cyclones coming from the Coral Sea or rain
depressions derived from cyclones moving inland, either southward from the Gulf of
Carpentaria or westward from the Coral Sea. These storms can drop massive amounts
of water at rates that greatly exceed the capacity of catchments to absorb the input and
that have a high erosive potential as the water runs off the land (e.g., Ciesiolka, 1987).
SUSPENDED SEDIMENTS IN NORTH
QUEENSLAND RIVERS
Suspended sediment loads transported by regional rivers vary directly with the amount
of water moving through the system. Considerable between-catchment differences in
sediment loads also occur. Fine soil particles reaching larger channels of river systems
are rapidly transported downstream. Figure 3 illustrates relationships between dis-
charge and suspended sediment concentrations measured over single wet seasons in
the Tully River (wet tropics) and the Herbert River (a largely dry catchment).
Wet season hydrographs in the Tully River (Figure 3, top) typically consist of
multiple flow events. Maximum concentrations of fine (Ͻ10 m) suspended sedi-
ments in the Tully River are 0.5 g l
Ϫ1
or less. Suspended sediment concentrations rise
rapidly on the leading edge of the flood hydrograph and decay exponentially there-
after. At most times, suspended loads are 0.1 g l
Ϫ1
or less. Flood events rarely persist
for more than a few days. Wet, tropical catchments such as that of the Tully River are
naturally characterised by a high level of vegetation cover. Freshly cultivated fields
or newly cleared land are the only significant areas of bare soil. Soil loss rates from
rainforest in the wet tropics can be quite low (Ͻ0.1 tonnes ha
Ϫ1
year
Ϫ1
: Douglas,
1967; Capelin & Prove, 1983). In contrast, soil loss rates from cultivated fields or
freshly cleared land can range from Ͻ5 to Ͼ500 tonnes ha
Ϫ1
year
Ϫ1
depending upon
rainfall intensity, slope, vegetation cover, and land management practises (Sallaway,
1979; Prove et al., 1986; Prove & Hicks, 1992).
Filtered particulate matter from the Tully River has an average N and P content
of 2825 and 564 ppm (g g
Ϫ1
). These values are enriched compared to the mean N
(1560 Ϯ 1770 ppm) and P (352 Ϯ 340 ppm) composition of catchment soils
(M. Grundy, QDNR, personal communication). During the 1996 –1997 wet season
(total freshwater discharge ϭ 2.3 km
3
), we estimate that the Tully River transported
1.45 ϫ 10
5
tonnes of fine sediments. Very little sediment is transported during the dry
season when water levels and suspended solids concentrations are low. For the sedi-
ment nutrient compositions given above, we estimate annual sediment-associated N
and P exports of 410 and 82 tonnes, respectively.
In contrast to the Tully River, the bulk of freshwater and fine sediment exports
from the mainly dry catchment rivers of the central and southern GBR such as the
© 2001 by CRC Press LLC
42 Oceanographic Processes of Coral Reefs
Herbert most frequently comes as a single large event (Figure 3, bottom). Suspended
sediment concentrations measured in dry tropical rivers are generally higher than
those measured in wet tropical rivers. Maximum suspended solids concentrations
measured in the Burdekin River during flood peaks can be on the order of 2 to 3 g l
Ϫ1
and often remain at concentrations Ͼ0.2 g l
Ϫ1
for weeks. These higher suspended par-
ticle loads reflect both differences in soil types between wet and dry catchments and
higher area-specific erosion rates due to much lower levels of vegetative cover.
Maximum suspended loads in the Herbert River during flood events are lower than
the Burdekin River, peaking at circa 1 g l
Ϫ1
. Suspended sediments collected in the
Herbert River have mean N and P contents of 1470 and 350 ppm, respectively. These
are close to the average of measured soil N (1160 Ϯ 960 ppm) and P (350 Ϯ 320
ppm) compositions (M. Grundy, QDNR, personal communication). For the
1997–1998 wet season (total freshwater discharge ϭ 3.7 km
3
), the time series of sus-
pended load measurements give an estimated fine sediment export of 8.93 ϫ 10
5
tonnes. Using the sediment composition ratios given above, this translates to sedi-
ment-bound N and P exports of 1314 and 315 tonnes, respectively.
DISSOLVED AND PARTICULATE NUTRIENTS
IN NORTH QUEENSLAND RIVERS
Dissolved and particulate nutrient (N, P) concentrations in north Queensland rivers
vary with time in a variety of ways. Figure 4 presents an example from the wet, trop-
ical South Johnstone River where dissolved and particulate nutrient concentrations
were measured intensively over 2 years. A large proportion of the Johnstone River
catchment area (26%) remains covered by rainforest. The two major agricultural land
uses are sugarcane cultivation in the lower part of the catchment (16%) and grazing
(circa 40%). Total gauged discharge of freshwater from the catchment in the 2 years
sampled was similar (0.83 and 0.89 km
3
), though the temporal pattern of discharge
differed between years.
Concentrations of particulate N and P were highly variable and generally
increased with river discharge, reflecting concurrent increases in catchment erosion
and suspended sediment loads. In contrast, concentrations of dissolved inorganic
(NH
4
ϩ
, NO
2
Ϫ
, NO
3
Ϫ
, PO
4
ϭ
) and dissolved organic N and P (DON, DOP) fluctuated
within smaller concentration ranges, largely independent of both the discharge rate
and the suspended sediment load. Nitrate is the principal inorganic N species in river
waters. The highest nitrate concentrations (to 765 g NO
3
ϪN l
Ϫ1
) were typically
measured during the initial flow event of the wet season (first flush), when soluble
nitrate ions produced and stored in aerobic soils over the dry season are washed into
the river systems. Lower nitrate concentration peaks occur during late-season flood
peaks. Short-lived decreases in nitrate concentrations may occur during major
cyclonic flood events, suggesting a dilution of catchment sources. Dissolved organic
N concentrations are somewhat higher, but again, relatively constant with time. When
the dissolved N concentrations are flow-weighed and integrated over the course of the
wet seasons, nitrate exports from the South Johnstone catchment account for 37% of
the total N exports and 60% of the dissolved N exports.
© 2001 by CRC Press LLC
Runoff of Terrestrial Sediment and Nutrients into the Great Barrier Reef 43
Average annual N and P exports from the South Johnstone River catchment
for the 1989–1991 hydrological years are estimated to be 314 and 30 tonnes,
respectively, with volume-weighted annual mean N and P concentrations of 364 and
35 mg m
Ϫ3
. A large proportion of the total export occurs in the relatively short peri-
ods of high discharge. Approximately 78% of the P was exported in particulate form.
Dissolved inorganic and organic P accounted for approximately 15 and 9% of
exports. In comparison, DIN, DON, and particulate N accounted for 43, 16, and 41%
of the total N exports. For the entire Johnstone River catchment, Hunter and Walton
(1997) estimated total average N and P exports of 750 and 132 tonnes/year.
Integrations of annual nutrient fluxes from the Herbert River catchment indicate that
the proportions of total N and P export in dissolved and particulate forms were of
similar order to those observed in the South Johnstone River. If the bulk of particu-
late N and P are associated with fine soil particles suspended in river waters, total N
exports from the Tully River (1996–1997) and Herbert River (1997–1998) catch-
ments are estimated to be 1000 and 3200 tonnes, respectively. Concurrent total
P exports derived from sediment fluxes would be 105 and 404 tonnes.
NUTRIENT TRANSFORMATIONS
WITHIN CATCHMENTS
Time series sampling at two sites located longitudinally on the Herbert River flood-
plain over the 1989–1990 and 1990–1991 hydrological years illustrate nutrient trans-
formations occurring within catchments and the potential influence of agricultural
land use on river nutrient exports (Figure 5). The Herbert River catchment contains a
variety of vegetation communities and land uses. Cropping, principally of sugarcane,
is largely restricted to the floodplain which comprises circa 30% of the total catch-
ment area (D. Walker, CSIRO personal communication). A significant proportion of
the lower catchment has been cleared and virtually all of the current inputs of N and
P fertilisers (9800 and 1330 tonnes of N and P, respectively, in 1990; Pulsford, 1993)
are applied there. Much of the upper catchment is covered by dry savanna woodland
where the principle agricultural land use is cattle grazing.
Figure 5 illustrates differences between concentrations of major nitrogen and
phosphorus species in Herbert River waters measured contemporaneously at the
upper (Yamani Falls National Park) and lower (Ingham) ends of the floodplain.
Concentrations of particulate nitrogen (PN) at the lower floodplain site are not sig-
nificantly different (circa 2 g l
Ϫ1
) from contemporaneous PN concentrations at the
upstream site over much of the year. Inorganic nitrogen concentrations, chiefly of
nitrate, were consistently higher (mean difference ϭ 79 g N l
Ϫ1
) at the downstream
site. Differences between upstream and downstream DIN concentrations were small-
est during flood events due to dilution. Similar longitudinal trends in DIN concentra-
tions have also been observed in sub-catchments draining rainforest into the Herbert
River floodplain (BSES, Furnas, unpublished data). In contrast, concentrations of
DON at the upstream site were consistently higher (mean difference ϭ 46 N g l
Ϫ1
)
than downstream concentrations. If the river flow at Yamani Falls is assumed to be
identical to that measured at Ingham (making the overly conservative assumption that
there is negligible net freshwater input to the lower catchment), then integrated fluxes
© 2001 by CRC Press LLC
44 Oceanographic Processes of Coral Reefs
of DIN, chiefly nitrate, leaving the lower catchment in runoff were four to eight times
the DIN flux entering at the upper end. In contrast, the integrated flux of DON at
Ingham is circa 87% of the nominal input flux. Particulate N fluxes at the down-
stream site are approximately 1.8 times the input fluxes, though suspended sediment
concentrations generally did not differ greatly between the two sites. Overall, total N
inputs at the upper end of the floodplain (1045 and 1600 tonnes for 1989–1990 and
1990–1991, respectively) are 59 and 62% of the calculated discharge fluxes (1784
and 2590 tonnes N) at the lower floodplain site.
In the case of phosphorus, upstream–downstream differences between concen-
trations of dissolved P species were relatively small (mean pairwise differences for
DIP and DOP ϭ 2.2 and 0.1 g P l
Ϫ1
, respectively). Particulate P concentrations at
the lower catchment site averaged 5.6 g l
Ϫ1
greater than the upper catchment site.
Total P inputs at the upper end of the floodplain (89 and 74 tonnes for 1989–1990 and
1990–1991, respectively) were 50 and 17% of the calculated downstream exit fluxes
(180 and 430 tonnes P).
The observed upstream–downstream differences between concentrations of
nitrogen species in the lower Herbert River indicate that the floodplain is the major
source of the DIN, chiefly nitrate, exported from the Herbert River catchment. A por-
tion of the DON generated in the upper catchment is consumed or oxidised in reaches
on the floodplain. Absolute differences between DIN (largely nitrate) concentrations
at Yamani Falls and Ingham are greatest during low-flow periods, suggesting that lat-
eral inputs of nitrate-rich groundwater are a significant source of this nitrate. Similar
longitudinal increases in nitrate concentrations have been observed in the Tully River
(Furnas, unpublished data). High nitrate groundwaters have been observed in other
lowland sugar-growing regions adjoining the GBRWHA (Keating et al., 1996). The
net increments of N and P exported from the lower catchment for 1989–1990 and
1990–1991 (740 and 990 tonnes for N; 91 and 356 tonnes for P) can be compared to
fertiliser N and P inputs to the lower catchment (9800 and 1330 tonnes, respectively,
in 1990: Pulsford, 1993).
DISCUSSION
Rivers discharging into the GBRWHA make a significant contribution to the nutrient
budgets of the region’s ecosystems (Furnas et al., 1995). At the shelf scale, annual
inputs of freshwater from rivers (22 to 180 km
3
) are small relative to freshwater inputs
from rainfall (circa 170 to 440 km
3
year
Ϫ1
). However, as the nutrient content of
regional rainwaters is very low (Furnas et al., 1995), rain contributes considerably
less than rivers to shelf-scale nutrient inputs. Overall, annual volumes of runoff com-
prise approximately 4% of the volume of seawater inshore of the 20-m isobath.
Because of lateral resistance to flow, Coriolis steering of buoyancy currents, and the
event-based nature of river discharge, the most direct effects of freshwater, sedi-
ments, nutrients, and contaminants in runoff are concentrated in the nearshore zone
(Gagan et al., 1987; Sandstrom, 1988).
Despite considerable effort over the last decade to monitor concentrations of dis-
solved and particulate nutrients in a number of NE Queensland river systems (e.g.,
Mitchell et al., 1991 and 1996) and make volume-weighted estimates of nutrient
© 2001 by CRC Press LLC
Runoff of Terrestrial Sediment and Nutrients into the Great Barrier Reef 45
exports, considerable uncertainties remain in our estimates of nutrient and sediment
exports to the shelf. This uncertainty is due to the small number of datasets with both
the temporal resolution necessary to accurately integrate exports during flood events
and duration to resolve inter-annual variability between and within catchments. As an
example, the two largest river systems discharging into the GBR (Burdekin, Fitzroy:
combined watershed area Ͼ270 ϫ 10
3
km
2
) account for 25% of the long-term aver-
age discharge to the shelf. At present, detailed time series of nutrient concentrations
during significant flood events are only available for the Burdekin River. No signifi-
cant flood events have occurred in the Fitzroy catchment since 1991. Likewise,
though catchments on Cape York (11 to 15°S) comprise 10% of the total catchment
area and receive 13% of the estimated rainfall, no useful time series of nutrient con-
centrations in these rivers exist.
Despite the paucity of data, several approaches can be taken to make first-order
estimates of sediment, and nutrient inputs to the GBR. The simplest approach
involves extrapolation from the quantity of sediment delivered annually by rivers to
the GBR shelf, the nominal N and P content of that sediment, and the proportion of
total nutrients transported on sediment particles. Table 2 presents estimates of aver-
age nutrient delivery based upon estimates of shelf-scale sediment inputs. The sedi-
ment inputs have been calculated from the estimated accumulation of sediment in
the coastal sediment wedge (Belperio, 1983) or weighted discharge-transport rela-
tionships derived from a small number of rivers (Neil & Yu, 1995 and 1996). The
accuracy and precision of these estimates and the reliability with which they can
be extrapolated are difficult to assess. The N and P inputs are calculated assuming
that the soils eroding into the GBRWHA have a mean sediment N and P content of
0.13 and 0.04%, respectively, and that sediment-associated N and P constitute 40 and
80% of the total N and P delivery fluxes. Volume-specific fine sediment fluxes mea-
sured to date in wet and dry catchment rivers using turbidity time series (Figure 3)
vary approximately 20-fold (5 ϫ 10
4
tonnes km
Ϫ3
in wet tropical rivers to 1 ϫ 10
6
tonnes km
Ϫ3
in the Burdekin River). These end member volume-specific loads give
TABLE 2
Estimated Total Terrestrial Nitrogen and Phosphorus Inputs to the Great
Barrier Reef Region Calculated from Estimates of Sediment Delivery to the
GBR Lagoon
Sediment Input N Inputs
a
P Inputs
b
Source (tonnes ϫ 10
6
) (tonnes ϫ 10
3
) (tonnes ϫ 10
3
)
Belperio, 1983 27.4 89.0 13.7
Moss et al., 1993 15.3 49.6 7.6
Neil & Yu, 1996 (pre-European) 7.4 23.9 3.7
Neil & Yu, 1996 (modern) 28.0 91.1 14.0
Furnas & Mitchell (this study) 3.3–66 11–215 1.6–33
a
PN ϭ 0.13% of sediment weight and PN ϭ 40% of ⌺N.
b
PP ϭ 0.04% of sediment weight and PP ϭ 80% of ⌺P.
© 2001 by CRC Press LLC
46 Oceanographic Processes of Coral Reefs
potential total N exports ranging between 11 and 215 ϫ 10
3
tonnes and P exports
ranging between 1.65 and 35 ϫ 10
3
tonnes (Table 2). These ranges encompass
sediment derived nutrient inputs calculated from literature sources. Total volume-
specific loads in most individual rivers have not been weighted as yet between
these end members, but it seems most likely that the upper ends of the ranges are
too high.
Based upon detailed time series measurements of dissolved and particulate nutri-
ents in the South Johnstone River (Furnas et al., 1995), we estimate annual volume-
weighted N and P export fluxes to be 364 and 35 tonnes km
Ϫ3
of discharge,
respectively. Volume-weighted total N and P concentrations derived for post-cyclone
flood events in the Johnstone River (3060 tonnes N km
Ϫ3
, 930 tonnes P km
Ϫ3
: Hunter
& Walton, 1997) and Herbert River (574 tonnes N km
Ϫ3
, 121 tonnes P km
Ϫ3
: Mitchell
et al., 1997) are considerably higher. Particulate matter mobilised during flood events
is enriched in both N and P (Mitchell & Furnas, 1997) relative to seasonally averaged
sediment N and P concentrations, reflecting higher erosion rates and scavenging of
nutrients from catchment soils.
Recent integrations of flow- and time-varying nutrient concentrations in the
Burdekin River yield mean volume-weighted N and P concentrations of 940 tonnes
N km
Ϫ3
and 145 tonnes P km
Ϫ3
, respectively (Furnas, unpublished data). Runoff from
the drier catchments has higher suspended sediment and particulate nutrient concen-
trations than water discharged from the wet, tropical rivers due to differences in soil
types and lower vegetation cover. If the volume-weighted nutrient concentrations
determined for the Burdekin River are taken as representative of discharge from dry
catchments (32 km
3
discharge) and the South Johnstone concentrations are taken to
represent wet tropical and Cape York catchments (34 km
3
discharge), mean annual
river N and P inputs to the GBRWHA are estimated to be 4.7 ϫ 10
4
and 1.7 ϫ 10
3
tonnes, respectively. In comparison, shelf water stocks of N and P (dissolved and par-
ticulate) inshore of the 20-m isobath are on the order of 1.4 ϫ 10
5
tonnes N and
1.4 ϫ 10
4
tonnes P, respectively. Such a crude comparison must be taken cautiously
as a large portion of the N and P transported by rivers is likely denitrified or buried at
or close to the river mouth (Nixon et al., 1996). The comparison does illustrate that
riverine inputs of nutrients can have a significant effect on both nearshore and shelf-
scale nutrient budgets.
A variety of evidence clearly shows that agricultural and land-use activities in
catchments adjoining the GBRWHA have led to increased erosion of soils within
those catchments. Working from this type of data, simple models of runoff, land use
and sediment delivery (Moss et al., 1993; Rayment & Neil, 1997) suggest that river-
ine sediment (and concurrent nutrient) fluxes to the GBRWHA from adjoining
catchments have increased several fold since the advent of European agricultural
practises. The available empirical data from river sampling confirm the general con-
clusion, but are as yet insufficient to strongly constrain the magnitude of the increase.
Efforts to develop management policies to halt or reverse this trend require accurate
information on the scope of the problem and the mechanisms which drive it. Even
more important, such information is essential to educate land users and develop a
community-based land conservation ethos that ultimately benefits the land, land
users, and ecosystems of the GBRWHA.
© 2001 by CRC Press LLC
Runoff of Terrestrial Sediment and Nutrients into the Great Barrier Reef 47
ACKNOWLEDGMENTS
We thank Michele Skuza, Marg Wright, Jane Wu Won, and Neil Johnson for assis-
tance with nutrient analyses. River discharge, rainfall, and soil nutrient data were
obtained from the Queensland Department of Natural Resources. This work was sup-
ported by the Australian Institute of Marine Science, the Great Barrier Reef Marine
Park Authority, and the Cooperative Research Centre Program through the
Cooperative Research Centre for Ecologically Sustainable Development of the Great
Barrier Reef World Heritage Area. This is AIMS contribution number 1037.
REFERENCES
Alongi, D.M. 1989 Benthic processes along mixed terrigenous-carbonate sedimentary facies on
the central Great Barrier Reef continental shelf. Continental Shelf Research 9, 629–663.
Bell, P.R.F., Elmitri, L. & Unwin, P. 1999 Nitrogen fixation by Trichodesmium spp. in the cen-
tral and northern Great Barrier Reef lagoon: relative importance of the fixed nitrogen
load. Marine Ecology Progress Series 186, 119–126.
Belperio, A.P. 1983 Late quaternary terrigenous sedimentation in the Great Barrier Reef lagoon.
pp. 71–76 in Baker, J.T., Carter, R.M., Sammarco, P.W. & Stark, K.P. (eds) Proceedings of
the Inaugural Great Barrier Reef Conference. James Cook University, Townsville.
Brodie, J. 1992 Urban impact on the Great Barrier Reef. pp. 18–26 in Proceedings of the
Workshop on Land-Use Patterns and Nutrient Loadings of the Great Barrier Reef Region.
James Cook University, Townsville.
Capelin, M.A. & Prove, B.G. 1983 Soil conservation problems of the humid coastal tropics of
North Queensland. Proceedings Australian Society of Sugar Cane Technologists 87–93.
Chongprasith, P. 1992 Nutrient Release and Nitrogen Transformations Resulting from
Resuspension of Great Barrier Reef Shelf Sediments. Ph.D. thesis, James Cook
University, Townsville, 274 pp.
Ciesiolka, C. 1987 Catchment management in the Nogoa Watershed. AWRC Research Project
80/129, Queensland Department of Primary Industries, Brisbane, 204 pp.
Douglas, I. 1967 Natural and man made erosion in the humid tropics of Australia, Malaysia
and Singapore. IAHS Publication, 75, 17–29.
Furnas, M.J., Mitchell, A.W., & Skuza, M. 1995 Nitrogen and Phosphorus Budgets for the
Central Great Barrier Reef. Research Report No. 36, Great Barrier Reef Marine Park
Authority, Townsville, 95 pp.
Furnas, M.J. & Mitchell, A.W. 1996 Nutrient inputs to the central Great Barrier Reef
(Australia) from subsurface intrusions of Coral Sea waters: a two-dimensional displace-
ment model. Continental Shelf Research 16, 1127–1148.
Gagan, M.K., Sandstrom, M.W., & Chivas, A.R. 1987 Restricted terrestrial carbon input to the
continental shelf during cyclone Winifred: implications for terrestrial runoff to the Great
Barrier Reef province. Coral Reefs 6, 113 –119.
Gilbert, M. 2000 Population and Major Land Use in the Great Barrier Reef Catchment Area:
Spatial and Temporal Trends. Unpublished report to the Great Barrier Reef Marine Park
Authority, Townsville.
Hopkinson, C.S., Sherr, B.F., & Ducklow, H.W. 1987 Microbial regeneration of ammonium in the
water column from Davies Reef, Australia. Marine Ecology Progress Series 41, 147–153.
Hunter, H.M. & Walton, R.S. 1997 From land to river to reef lagoon. Land use impacts on
water quality in the Johnstone Catchment. Queensland Department of Natural Resources,
Brisbane, 10 pp.
© 2001 by CRC Press LLC
48 Oceanographic Processes of Coral Reefs
Ikeda, T., Carleton, J.H., Mitchell, A., & Dixon, P. 1982 Ammonium and phosphate excretion
by zooplankton from the inshore waters of the Great Barrier Reef. II. Their in situ contri-
butions to nutrient regeneration. Australian Journal of Marine and Freshwater Research
33, 683–698.
Keating, B.A., Bauld, J., Hillier, J., Ellis, R., Weier, K.L., Sunners, F., & Connell, D. 1996 Leaching
of nutrients and pesticides to Queensland groundwaters. pp. 151–164 in Hunter, H.M., Eyles,
A.G., & Rayment, G.E. (eds) Proceedings of the Conference on Downstream Effects of Land
Use, Rockhampton, April 1995. Queensland Department of Natural Resources, Brisbane.
Larkum, A.W.D., Kennedy, J.R., & Muller, W.J. 1988 Nitrogen fixation on a coral reef. Marine
Biology 98, 143–155.
Mitchell, A.W. & Furnas, M.J. 1997 Terrestrial inputs of nutrients and suspended sediments to
the GBR lagoon. pp. 59–71 in Conference Proceedings: The Great Barrier Reef: Science,
Use and Management, Vol. 1, November 1996, James Cook University, Townsville.
Mitchell, A., Rassmussen, C., Blake, S., Congdon, R., Reghenzani, J., Saffigna, P., & Sturmey,
H. 1991 Nutrient concentrations and fluxes in North Queensland coastal rivers and
streams. pp. 108–161 in Proceedings of the Workshop on Land-Use Patterns and Nutrient
Loadings of the Great Barrier Reef Region. James Cook University, Townsville.
Mitchell, A., Reghenzani, J.R., Hunter, H.M., & Bramley, R.G.V. 1996 Water quality and nutri-
ent fluxes from river systems draining to the Great Barrier Reef Marine Park. pp. 23–34
in Hunter, H.M., Eyles, A.G. & Rayment, G.E. (eds) Proceedings of the Conference on
Downstream Effects of Land Use, Rockhampton, April 1995. Queensland Department of
Natural Resources, Brisbane.
Mitchell, A.W., Bramley, R.G.V., & Johnson, A.K.L. 1997 Export of nutrients and suspended
sediment during a cyclone-mediated flood event in the Herbert River catchment,
Australia. Marine and Freshwater Research 48, 79–88.
Moss, A.J., Rayment, G.E., Reilly, N., & Best, E.K. 1993 A Preliminary Assessment of
Sediment and Nutrient Exports from Queensland Coastal Catchments. Environmental
Technical Report. No. 5, Department of Primary Industries.
Neil, D.T. & Yu, B. 1995 Simple climate driven models for estimating sediment input to the
Great Barrier Reef lagoon, pp 67–73 in Larcombe, P. & Woolfe, K. (eds) Great Barrier
Reef: Terrigenous Sediment Flux and Human Impacts. CRC Reef Research Centre
Symposium Proceedings, James Cook University, Townsville.
Neil, D.T. & Yu, B. 1996 Fluvial sediment yield to the Great Barrier Reef lagoon: spatial pat-
terns and the effect of land use. pp. 281–286 in Hunter, H.M., Eyles, A.G., & Rayment,
G.E. (eds) Proceedings of the Conference on Downstream Effects of Land Use,
Rockhampton, April 1995. Department of Natural Resources, Brisbane.
Nixon, S.W., Ammerman, J.W., Atkinson, L.P., Berounsky, V.M., Billen, G., Boicourt, W.C.,
Boynton, W.R., Church, T.M., DiToro, D.M., Elmgren, R., Garber, J.G., Giblin, A.E., Jahnke,
R.A., Owens, N.J.P., Pilson, M.E.Q., & Seitzinger, S.P. 1996 The fate of nitrogen and phos-
phorus at the land-sea margin of the North Atlantic Ocean. Biogeochemistry 35, 141–180.
Prove, B.G., Truong, P.N., & Evans, D.S. 1986 Strategies for controlling caneland erosion in
the wet tropical coasts of Queensland. Proceedings of the Australian Society of Sugar
Cane Technologists 77–84.
Prove, B.G. & Hicks, W.H. 1992 Soil and nutrient movements from rural lands of North
Queensland. pp. 67–76 in Proceedings of the Workshop on Land-Use Patterns and
Nutrient Loadings of the Great Barrier Reef Region. James Cook University, Townsville.
Pulsford, J.S. 1993 Historical Nutrient Usage in Coastal Queensland River Catchments
Adjacent to the Great Barrier Reef Marine Park. Research Report No. 40, Great Barrier
Reef Marine Park Authority, Townsville, 63 pp.
© 2001 by CRC Press LLC
Runoff of Terrestrial Sediment and Nutrients into the Great Barrier Reef 49
Rayment, G. & Neil, D. 1997 Sources of material in river discharge. pp. 42–58 in Conference
Proceedings: The Great Barrier Reef: Science, Use and Management, Vol. 1, November
1996. James Cook University, Townsville.
Sallaway, M.M. 1979 Soil erosion studies in the Mackay district. Proceedings of the Australian
Society of Sugar Cane Technologists 125 –132.
Sandstrom, M.W. 1988 Aliphatic hydrocarbons in surface sediments from the north
Queensland coast and Great Barrier Reef: effects of tropical cyclone Winifred. Organic
Geochemistry 12, 445–454.
Ullman, W.J. & Sandstrom, M.W. 1987 Dissolved nutrient fluxes from the nearshore sediments
of Bowling Green Bay, central Great Barrier Reef lagoon (Australia). Estuarine, Coastal
and Shelf Science 24, 289–303.
Wasson, R.J. 1997 Runoff from the land to the rivers and sea. pp. 23–41 in Conference
Proceedings: The Great Barrier Reef: Science, Use and Management, Vol. 1, November
1996. James Cook University, Townsville.
© 2001 by CRC Press LLC
50 Oceanographic Processes of Coral Reefs
FIGURE 3 (Top) Instantaneous and cumulative dis-
charge of water, fine suspended sediment concentra-
tion, and cumulative sediment export from the Tully
River at Euramo over the 1996–1997 wet season.
(Bottom) Instantaneous and cumulative discharge of
water, fine suspended sediment concentration, and
cumulative sediment export from the Herbert River at
Ingham over the 1997 –1998 wet season.
FIGURE 1 Major rivers draining into the GBRWH
Area.
FIGURE 2 Comparative time series of daily fresh
water discharge from the Normanby River (monsoonal
catchment—Cape York Peninsula), Tully River (wet
tropical catchment—central GBR), Burdekin River
(large dry catchment—central GBR), and Burnett
River (dry catchment—southern GBR) for the period
between 1 October 1984 and 30 September 1994.
© 2001 by CRC Press LLC
Runoff of Terrestrial Sediment and Nutrients into the Great Barrier Reef 51
FIGURE 4 Time series of dissolved and particulate
nitrogen and phosphorus concentrations in relation to
river flow and cumulative nitrogen and phosphorus
exports from the South Johnstone River over the
1989–1990 and 1990–1991 wet seasons.
FIGURE 5 Time series of dissolved and particulate
nitrogen and phosphorus concentrations measured at
the upper (Yamani Falls National Park—dashed line)
and lower ends (Ingham—solid line) of the floodplain
of the Herbert River between 1 October 1989 and
30 September 1992.
© 2001 by CRC Press LLC