OCEANOGRAPHIC PROCESSES OF CORAL REEFS: Physical and Biological Links in the Great Barrier Reef - Chapter 8 doc
Bạn đang xem bản rút gọn của tài liệu. Xem và tải ngay bản đầy đủ của tài liệu tại đây (261.72 KB, 13 trang )
Modelling and Visualizing
Interactions between
Natural Disturbances and
Eutrophication as Causes
of Coral Reef Degradation
Laurence J. McCook, Eric Wolanski, and Simon Spagnol
CONTENTS
Introduction . . . . . . . . . . . . . . . . . . . . . . . . . . . . . . . . . . . . . . . . . . . . . . . . . . . . . . 113
Model Design . . . . . . . . . . . . . . . . . . . . . . . . . . . . . . . . . . . . . . . . . . . . . . . . . . . . 114
Ecological Structure. . . . . . . . . . . . . . . . . . . . . . . . . . . . . . . . . . . . . . . . . . . . 114
Mathematical Structure . . . . . . . . . . . . . . . . . . . . . . . . . . . . . . . . . . . . . . . . . 115
Visualizations. . . . . . . . . . . . . . . . . . . . . . . . . . . . . . . . . . . . . . . . . . . . . . . . . 116
Simulated Effects of Eutrophication and Natural Disturbances
on Coral to Algal Phase Shift Trajectories . . . . . . . . . . . . . . . . . . . . . . . . . . . . . . 117
Model Reef Trajectories: Effects of Starting Condition
and Disturbances . . . . . . . . . . . . . . . . . . . . . . . . . . . . . . . . . . . . . . . . . . . . . . 117
Responses to Eutrophication . . . . . . . . . . . . . . . . . . . . . . . . . . . . . . . . . . . . . 117
Combined Effects of Natural Disturbance and Human Impacts . . . . . . . . . . 117
Large-Scale and Long-Term Changes: Integration of Human Impacts and
Natural Disturbance . . . . . . . . . . . . . . . . . . . . . . . . . . . . . . . . . . . . . . . . . . . . 118
Discussion . . . . . . . . . . . . . . . . . . . . . . . . . . . . . . . . . . . . . . . . . . . . . . . . . . . . . . . 118
Acknowledgments. . . . . . . . . . . . . . . . . . . . . . . . . . . . . . . . . . . . . . . . . . . . . . . . . 121
References . . . . . . . . . . . . . . . . . . . . . . . . . . . . . . . . . . . . . . . . . . . . . . . . . . . . . . . 121
INTRODUCTION
There is increasing concern globally that enhanced runoff from human land uses is
leading to degradation of coral reefs. Land-clearing, deforestation, excess fertiliza-
tion of agriculture, and sewage runoff have all been implicated in contributing to
nutrient and sediment overload of coral reef waters, leading to so-called “phase
shifts,” in which areas formerly dominated by corals become overgrown by algae
8
113
© 2001 by CRC Press LLC
(e.g., Smith et al., 1981; Hatcher et al., 1989; Done, 1992; Edinger et al., 1998). These
changes have serious ecological, environmental, and economic consequences. On the
Great Barrier Reef (GBR) in particular (Figure 1), there is concern that abundant
macroalgae on inshore fringing reefs indicate degradation due to anthropogenic
increases in terrestrial inputs of sediments and nutrients (Bell & Elmetri, 1995;
reviewed in McCook & Price, 1997a; McCook & Price, 1997b; Wachenfeld et al.,
1998; Atkinson, 1999; Prideaux, 1999).
It is widely assumed that these phase shifts occur simply because increased nutri-
ents or sediments lead to increased algal growth and consequent overgrowth of
corals. However, there has been surprisingly little research to understand the mecha-
nisms of these changes, and critical review of the available evidence suggests that the
processes are likely to be more complex (Miller, 1998; McCook, 1999; McClanahan
et al., 1999). Nutrients can only affect algal growth rates, not abundance, and changes
in algal growth rates, are only expressed as changes in abundance and consequent
overgrowth of corals, when reef herbivory is unusually low (McCook, 1996; McCook
& Price, 1997a; Hughes et al., 1999; McCook, 1999; Aronson & Precht, 1999). In
particular, it seems that a major impact of eutrophication may involve the failure to
recover from natural events such as coral bleaching, storms (cyclones, hurricanes), or
freshwater coral kills (Kinsey, 1988; Done et al., 1997).
The objective of this chapter is to demonstrate the application of mathematical
simulations combined with computer visualisation techniques in formalising the eco-
logical concepts involved, and providing clear, effective output which is accessible to
an audience with a broad range of technical backgrounds. The scientific arguments
and evidence on which the model is based are discussed in detail in a recent review
and perspective on management applications for the GBR (McCook, 1999), and so
are not reiterated here. The model used here focuses on the relative abundance of
corals and algae, and is intended only as a simplification of their interactions, and not
as a specific, quantitative, or predictive model of the processes involved.
MODEL DESIGN
ECOLOGICAL STRUCTURE
The model simplifies reef communities to include only competing corals and algae,
as benthic space occupants, and herbivorous fish, which consume algae (Figures 1
and 2). External impacts include terrestrial runoff as sediments and nutrients, and nat-
ural disturbances, such as storms (cyclones, hurricanes), bleaching, crown-of-thorns
starfish outbreaks, freshwater coral kills, etc., which are assumed to primarily affect
corals. Sediment and nutrient loads may occur as chronic, long-term loads and as
short-term pulses such as river flood plumes, related to storm events (e.g., Russ &
McCook, 1999). Algae and corals compete for substrate space, which is limiting.
Bare space may be colonised by either corals or algae, but colonisation by algae is
much more rapid. Coral recruitment and percent cover of adult corals are modelled
separately. As algal abundance may increase in both area and in biomass per unit
area, total algal and coral abundance may exceed 100% cover, with the excess
114 Oceanographic Processes of Coral Reefs
© 2001 by CRC Press LLC
representing increased algal standing crop or biomass per unit area. Reef structure
and the outcome of events are summarised by the trajectories through time of the rel-
ative abundances of coral and algae. Effects of sediment deposition and turbidity are
not distinguished. Nutrients affect algal growth rates, but the accumulation of algal
growth depends on the rate of consumption by herbivores.
The model also includes several indirect impacts of eutrophication, based on the
discussion in McCook (1999): sediments inhibit fish grazing (S. Purcell, personal
communication), algal growth (McClanahan & Obura, 1997; Umar et al., 1998),
coral recruitment (Hodgson, 1990a), and coral survival (Hodgson, 1990b; Stafford-
Smith, 1992; McClanahan & Obura, 1997). Disturbances are modelled as killing
coral, which is then rapidly colonised, predominantly by algae. Algal overgrowth of
dead corals is a general consequence of natural disturbances such as storm damage,
severe mass bleaching of corals, or outbreak feeding of crown-of-thorns starfish
(McCook et al., in press).
MATHEMATICAL STRUCTURE
The processes and interactions are modelled using Logistic/Lotka-Volterra–type
equations based on Figure 2. The dependent variables are non-dimensionalised with
respect to values representative of equilibrium in clean, oligotrophic waters (i.e., low
nutrient and sediment levels) and the model calibrated for these conditions. Model
parameters are set to result in an equilibrium coral cover of ~80% under those con-
ditions, with algal cover at 20%. The non-dimensionalisation enables rates to be
expressed as a change per generation of a coral polyp, which is 100 time units or iter-
ations.
The equations are
F ϭ F
o
/(1 ϩ K
sf
S)
dA/dt ϭϪK
caa
C
a
(1 Ϫ C
a
/C
ao
)/(1 ϩ K
scaa
S) ϩ K
na
AN(1 Ϫ A)/(N
o
(1 ϩ K
sa
N)) Ϫ K
af
FA/F
o
dC
a
/dt ϭ K
caa
C
a
(1 Ϫ C
a
/C
ao
)/(1 ϩ K
scaa
S) Ϫ K
d
␦
1
C
a
(1 ϩ S)(1 ϩ A/(1 Ϫ C
ao
)) ϩ 2K
cjca
C
j
/(1 ϩ S)
dC
j
/dt ϭϪK
cjca
C
j
ϩ K
cacj
C
a
C
jo
/(C
ao
(1 ϩ K
scj
S))
where
t ϭ time
F ϭ fish abundance
F
o
ϭ equilibrium F
S ϭ fine sediment load (S Ն 1; S ϭ 1 is the clean water value)
A ϭ algal abundance
N ϭ nutrient abundance
N
o
ϭ equilibrium N
C
a
ϭ adult coral abundance
C
ao
ϭ equilibrium C
a
C
j
ϭ juvenile coral abundance
C
jo
ϭ equilibrium C
j
␦
1
ϭ C
a
ϩ A
Causes of Coral Reef Degradation 115
© 2001 by CRC Press LLC
K
sf
ϭ proportional dependence of F on S
K
caa
ϭ at equilibrium, relative dominance of competitiveness for space of adult
coral over algae
K
scaa
ϭ proportional dependence of K
caa
on S
K
d
ϭ coral death rate at equilibrium
K
cjca
ϭ rate at which juvenile corals mature to adulthood
K
cacj
ϭ recruitment rate of coral juveniles
K
scj
ϭ proportional dependence of K
cacj
on S
K
na
ϭ equilibrium growth rate of algae from nutrients
K
sa
ϭ proportional dependence of K
na
on S
␦ϭA/(1 Ϫ C
a
) ϭ thickness of the algal mat
The external variables are (1) sediments (S), (2) nutrients (N), and (3) disturbances.
Disturbances are modelling as a step decrease of cover of adult corals, providing empty
space; in the model runs presented here, the disturbances removed 70% of previous coral
cover (75% in Animation 6 discussed later). Empty space is rapidly colonised by algae:
A ϭ (1 Ϫ C
a
) H( ϪA Ϫ C
a
ϩ 1)
where H ϭ the Heavyside function (1 for values of independent variable greater than
0, otherwise 0).
Because disturbances such as cyclones are often associated with nutrient pulses
which lead to pulses in algal growth (e.g., Russ & McCook, 1999), the model allows
for a pulse of algal growth at the time of disturbances. This is simulated by multiplying
the increase in algal colonisation by a scaling factor. It should be emphasized that the
model structure includes several indirect impacts of sediments or nutrients, and thus the
outcomes of eutrophication are not those of the simple, direct-effects model criticised
by McCook (1999). The model presented here is primarily intended as an initial demon-
stration of the effectiveness of the approach; explanations and refinements of the equa-
tions and structure will be discussed in more detail in a subsequent paper.
VISUALIZATIONS
The model output is displayed as the trajectories of coral and algal abundance
through time (i.e., time series graphs). These trajectories are displayed as animated
graphs, proportional views of the two reef scenes in Figure 1, and as glyphs (or bars).
In the final animation, the glyphs are superimposed on a three-dimensional chart of
the central GBR. Visualisation of the data and bathymetry was performed using
OpenDX (formerly Data Explorer), an open source product available at
. The model data used in Animation 6 were Tubed, Glyphed as
cylinders, and stacked on top of each other (algal abundance on top of coral). The
bathymetry data were RubberSheeted, and coloured according to height (grey repre-
senting z-values above MSL). The z-scale (topographic height or depth) was manip-
ulated in order to emphasize the coral reef lagoon area. Single frames were then
written out and converted to AVI using VideoMach ().
116 Oceanographic Processes of Coral Reefs
© 2001 by CRC Press LLC
SIMULATED EFFECTS OF EUTROPHICATION
AND NATURAL DISTURBANCES ON CORAL
TO ALGAL PHASE SHIFT TRAJECTORIES
M
ODEL REEF TRAJECTORIES: EFFECTS OF STARTING CONDITION
AND
DISTURBANCES
The model trajectory equilibrates to the same final levels of coral and algal abun-
dance, independent of starting points (Animations 1 and 2). Similarly, after a distur-
bance which kills corals, algal cover undergoes an immediate increase, but again
equilibrates to the same final values, assuming sufficient time without further distur-
bances (Animation 3).
RESPONSES TO EUTROPHICATION
However, the specific levels of the equilibrium cover are dependent on the levels of
sediments and nutrients in the model. Comparisons of the trajectories for moderately
increased (Animation 4) and strongly increased sediment and nutrient conditions
(Animation 5, “eutrophic”), with the trajectory in the “oligotrophic” conditions
(Animation 1), show similar basic system behaviour, except that the trajectories equi-
librate at lower coral cover for the more eutrophic conditions. Thus eutrophication
results in a partial “phase shift” toward a state with higher algal abundance and less
coral cover. (It should be emphasised that this shift occurs because the model struc-
ture assumes eutrophication affects corals and herbivory as well as algal growth.)
COMBINED EFFECTS OF NATURAL DISTURBANCE
AND
HUMAN IMPACTS
The impacts of chronic long-term stresses such as overfishing or eutrophication on
established communities may be relatively small, but may be much more severe
where those communities are also subjected to acute, short-term disturbances,
whether natural or human in origin. Coral reef communities are naturally subject to
frequent, major disturbances, such as cyclones, crown-of-thorns outbreaks, or
bleaching, and may be able to recover rapidly from such events. However, the recov-
ery process may be hampered by chronic human impacts (Kinsey, 1988), and, in par-
ticular, rapid macroalgal growth subsequent to a disturbance may prevent coral
regrowth or recruitment and reef recovery (Connell et al., 1997; Hughes & Tanner,
2000).
This is well illustrated by the model results in Figure 3, which show a matrix of
community trajectories for increasingly eutrophic conditions and increasing frequen-
cies of acute coral damage. It can be clearly seen that the coral cover declines more
severely when subjected to both eutrophic conditions and frequent disturbances than
accounted for by either factor alone.
This observation has important implications in terms of attributing causality of
the decline in coral cover. The immediate cause of the coral death may be natural, but
the failure to recover, and consequent long-term decline in reef condition, may in fact
Causes of Coral Reef Degradation 117
© 2001 by CRC Press LLC
be a direct consequence of the human-derived stresses (discussion in McCook, 1999).
However, such causality would be very difficult to demonstrate in a field study,
because the changes caused by the human impact are intrinsically confounded by the
often much larger changes caused by the natural events.
LARGE-SCALE AND LONG-TERM CHANGES:
I
NTEGRATION OF HUMAN IMPACTS AND NATURAL DISTURBANCE
The problem of attributing causality becomes even more significant when the poten-
tial large-scale and long-term nature of the changes is considered. Most natural dis-
turbances occur in a patchy manner in time and space, and are difficult to predict.
This may result in relatively small, localised, and intermittent impacts, which
nonetheless accumulate over larger scales in time and space as a significant overall
degradation. The human impact, via terrestrial runoff, may then be piecemeal, dif-
fuse, and subtle, but with serious long-term consequences.
This problem is illustrated by the final animation, which simulates reef trajecto-
ries for a range of runoff and disturbance regimes (Animation 6, parameter details in
Table 1). The animation portrays model output for a series of 30 “virtual reefs” along
and across the continental shelf of the central GBR (Figure 4), and simulates gradual
eutrophication of inshore and, to a lesser extent, midshelf water quality, combined
with intermittent disturbances, and nutrient pulses resulting from flood plumes (fur-
ther details in captions).
The model results indicate an overall, large-scale and long-term decline in
inshore “reefs,” which have an average final coral cover of 13% (range 31 to 0%)
compared to 41% (62 to 23%) on midshelf reefs, and 60% (77 to 34%) on the pris-
tine offshore reefs. As the disturbance regimes in the model are identical across the
shelf, this inshore decline is unambiguously due to the eutrophic conditions on those
(model) reefs. It is particularly significant that some inshore reefs were completely
degraded, with essentially no coral left.
However, the animation also demonstrates how the short-term and smaller-scale
dynamics, especially the disturbances, effectively obscure the overall pattern, even
when viewed at relatively large scales. The overall marked decline in condition of
inshore reefs would therefore be very difficult to detect and attribute, despite being
unequivocally due to the eutrophication (in the model). The considerable temporal and
spatial variability among model reefs, due to timing of disturbances and nutrient
pulses, overshadows and confounds the sediment and nutrient effects, even though the
disturbance effects are short-lived, whereas the eutrophication effects are long-term.
DISCUSSION
The model results demonstrate the potential for eutrophication to have significant
long-term impacts on coral populations beyond any direct impacts, by reducing the
ability of coral reefs to recover from disturbances. The combined consequences of
natural disturbances and eutrophication were significantly greater than either factor
alone, demonstrating the need to explicitly consider such interactions in contributing
118 Oceanographic Processes of Coral Reefs
© 2001 by CRC Press LLC
to phase shifts (Done, 1995). The results thus support the argument that eutrophica-
tion impacts are likely to be more complex than simply enhancing algal overgrowth
of established corals (McCook, 1999). The interaction impacts may be further exac-
erbated if human activities also serve to increase the frequency or intensity of the oth-
erwise “natural” disturbances (e.g., climate change: Hoegh-Guldberg, 1999; Lough,
Chapter 17, this book).
This “failure to recover” scenario has important implications in terms of attribut-
ing causality, since the immediate cause of the coral death may be natural, but the fail-
ure to recover and consequent long-term decline in reef condition may in fact be a
direct consequence of the human-derived stresses (Done, 1995; discussion in
McCook, 1999). Importantly, although the acute natural disturbances had the most
severe short-term impacts, the system rapidly recovered, whereas the chronic human
impact resulted in a long-term decline. However, as the model results illustrate, such
causality may be very difficult to demonstrate because the changes caused by the
Causes of Coral Reef Degradation 119
TABLE 1
Design of Cross-shelf and Longshore Comparisons of Community Trajectories
Used for Animation 6
Cross-Shelf: Inshore Midshelf Outershelf
Eutrophication: S & N 1.5 to 2 S & N 1 to 1.5 S & N ϭ 1
North Cyclone N Cyclone Cyclone N Cyclone Cyclone N Cyclone
Period Pulse Start Period Pulse Start Period Pulse Start
1 200 1 100 200 1 100 200 1 100
2 100 1.1 180 100 1 180 100 1 180
3 200 1.2 140 200 1.1 140 200 1 140
4 100 1.3 120 100 1.1 120 100 1 120
5 200 1.4 160 200 1.2 160 200 1 160
River 6 100 1.4 100 100 1.2 100 100 1 100
7 200 1 180 200 1 180 200 1 180
8 100 1 140 100 1 140 100 1 140
9 200 1 120 200 1 120 200 1 120
10 100 1 160 100 1 160 100 1 160
South
Notes: Nutrient and disturbance conditions for the model runs shown in Animation 6. Nutrient and sedi-
ment conditions vary across the continental shelf. Outershelf reefs remain oligotrophic for the entire
period. On mid-shelf reefs, sediment and nutrient conditions are oligotrophic for the first half of the time
period (t ϭ 1 to 500), and then linearly increase to moderately eutrophic for the remaining time. Sediments
and nutrients on inshore reefs are initially moderately eutrophic (t ϭ 1 to 500), then increase linearly to
strongly eutrophic by the end of the time period. Disturbances (e.g., cyclones, coral bleaching) are uniform
in timing and frequency across the continental shelf, but vary within cross-shelf regions in frequency (100
or 200 time units) and in timing. Finally, inshore and midshelf reefs vary longshore, with simulated flood
plumes providing nutrient pulses simultaneous with the disturbances; the influence of this nutrient pulse
extends northward from the river mouth, declining with distance longshore or offshore (Wolanski, 1994;
see also King et al., Chapter 10, this book).
© 2001 by CRC Press LLC
human impact are intrinsically confounded by the often much larger changes caused
by the natural events. In nature, this difficulty will be exacerbated by the stochasticity
and variability inherent in many of the physical and ecological processes involved
(e.g., storm timing and severity, recruitment, competition, succession/recovery:
McCook, 1994; McCook & Chapman, 1997). The variability inherent in each of these
processes means the outcomes will themselves be inherently stochastic and variable.
This is an important observation: even with a relatively simple model system in
which we know there is a long-term decline due to the human impact, it is unlikely that
a short-term impact assessment could detect differences between sites or times that
would demonstrate anything except the inherent variability and changes in the com-
munity. It is difficult to imagine a feasible sampling design based on benthic cover
which could satisfactorily demonstrate the eutrophication impact. Whilst the model
not only illustrates this difficulty, however, it also potentially provides ecologists with
a means to portray and illustrate this uncertainty and its implications in terms of risk
assessment and management — to the public, to policymakers, and to each other.
Even the preliminary applications of the model in this chapter demonstrate the
utility of this approach as an exploratory and explanatory tool for understanding coral
reef phase shifts. It should be reiterated that the model provided here cannot realisti-
cally predict the behaviour of real reef communities, which are vastly more complex,
nor has the model the capacity to predict the consequences of specific changes or
events. However, the approach has a number of advantages, including:
1. The ability to simulate a wide range of concepts and interactions and their
consequences, and to effectively portray them to a non-expert audience;
2. The increased rigour in understanding the concepts and processes involved,
required in order to formulate their mathematical approximations;
3. The ability to explore (model) system behaviour under different condi-
tions, assumptions, and disturbance regimes, including circumstances
leading to degradation, and thereby:
4. The ability to identify and assess relative and potential risks under differ-
ent circumstances;
5. The absence of large, vertebrate predators from the model, which
increases researcher viability both inshore and offshore.
This exploratory potential, effectively allowing “virtual reef experiments,” with
few limitations on spatial and temporal scales, can provide a valuable means to
explore potential outcomes and identify significant factors and interactions. Thus,
although the approach cannot serve as a substitute for careful field experiments, it
may serve to direct experimental effort more effectively by identifying processes and
factors likely to have most impact. The ability to illustrate and communicate the sig-
nificance of different processes, such as the interactions between eutrophication and
natural disturbance regimes shown here, has application to scientific debates, man-
agement applications, and public education. It may also provide policymakers with a
means to demonstrate risks which are otherwise difficult to prove.
The results presented here illustrate that eutrophication impacts are unlikely to
be limited to a simple, direct process. In particular, eutrophication may inhibit the
120 Oceanographic Processes of Coral Reefs
© 2001 by CRC Press LLC
recovery from natural disturbances, an impact which may be diffuse and variable, and
consequently difficult to detect at short time scales.
ACKNOWLEDGMENTS
The ideas in this chapter have benefited from discussions with Peter Bell, Russell
Reichelt, David Williams, Terry Hughes, Bruce Hatcher, Judith Skeat, and especially
Terry Done and an anonymous reviewer. GBR bathymetry data provided by the
Department of Tropical Environmental Science and Geography, James Cook University.
REFERENCES
Aronson, R.B. & Precht, W.F. 1999 Herbivory and algal dynamics on the coral reef at
Discovery Bay, Jamaica. Coral Reefs 45, 251–255.
Atkinson, V. 1999 The Great Barrier Reef. Wilderness News 156, 15–18.
Bell, P.R.F. & Elmetri, I. 1995 Ecological indicators of large-scale eutrophication in the Great
Barrier Reef. Ambio 24, 20–215.
Brodie, J. 1995 The problem of nutrients and eutrophication in the Australian marine environ-
ment. pp. 1–29 in Zann, L.P. & Sutton, D. (eds) Technical Annex 2: Pollution. State of the
Marine Environment Report for Australia. Great Barrier Reef Marine Park Authority,
Townsville.
Connell, J.H., Hughes, T.P., & Wallace, C.C. 1997 A 30 year study of coral abundance,
recruitment, and disturbance at several scales in space and time. Ecological Monographs
67, 461–488.
Done, T.J. 1992 Phase shifts in coral reef communities and their ecological significance.
Hydrobiologia 247, 121–132.
Done, T.J. 1995 Ecological criteria for evaluating coral reefs and their implications for man-
agers and researchers. Coral Reefs 14, 183–192.
Done, T.J., DeVantier, L.M., Turak, E., McCook, L.J., & Fabricius, K.E. 1997 Decadal changes
in community structure in the Great Barrier Reef coral reefs. pp. 97–108 in Wachenfeld,
D., Oliver, J., & Davis, K. (eds) State of the GBR World Heritage Area Report. Workshop
Proceedings, Great Barrier Reef Marine Park Authority, Townsville.
Edinger, E.N., Jompa, J., Limmon, G.V., Widjatmoko, W., & Risk, M.J. 1998 Reef degradation
and coral biodiversity in Indonesia: effects of land-based pollution, destructive fishing
practices and changes over time. Marine Pollution Bulletin 36, 617–630.
Hatcher, B.G., Johannes, R.E., & Robertson, A.I. 1989 Review of research relevant to the con-
servation of shallow tropical marine ecosystems. Oceanography Marine Biology Annual
Review 27, 337–414.
Hodgson, G. 1990a Sediment and the settlement of larvae of the reef coral Pocillopira dami-
cornis. Coral Reefs 9, 41–43.
Hodgson, G. 1990b Tetracycline reduces sedimentation damage to corals. Marine Biology 104,
493–496.
Hoegh-Guldberg, O. 1999 Climate change, coral bleaching and the future of the world’s coral
reefs. Marine Freshwater Research 50, 839–866.
Hughes, T.P., Szmant, A.M., Steneck, R.S., Carpenter, R.C., & Miller, S. 1999 Algal blooms
on coral reefs: What are the causes? Limnology Oceanography 44, 1583–1586.
Hughes, T.P. & Tanner, J.E. 2000 Recruitment failure, life histories, and long-term decline of
Caribbean corals. Ecology 81, 2250–2263.
Causes of Coral Reef Degradation 121
© 2001 by CRC Press LLC
Kinsey, D.W. 1988 Coral reef system response to some natural and anthropogenic stresses.
Galaxea 7, 113–128.
McClanahan, T.R., Aronson, R.B., Precht, W.F., & Muthiga, N.A. 1999 Fleshy algae dominate
remote coral reefs of Belize. Coral Reefs 18, 61–62.
McClanahan, T.R. & Obura, D. 1997 Sedimentation effects on shallow coral commmunities in
Kenya. Journal Experimental Marine Biology Ecology 209, 103–122.
McCook, L.J. 1994 Understanding ecological community succession: causal models and the-
ories, a review. Vegetatio 110, 115–147.
McCook, L.J. 1996 Effects of herbivores and water quality on the distribution of Sargassum
on the central Great Barrier Reef: cross-shelf transplants. Marine Ecology Progress Series
139, 179–192.
McCook, L.J. 1999 Macroalgae, nutrients and phase shifts on coral reefs: scientific issues and
management consequences for the Great Barrier Reef. Coral Reefs 18, 357–367.
McCook, L.J. & Chapman, A.R.O. 1997 Community succession following massive ice-scour
on a rocky intertidal shore: observations of natural succession under varying physical and
biological conditions. Journal Experimental Marine Biology Ecology 4, 121–147.
McCook, L.J., Jompa, J., & Diaz-Pulido, G. Competition between corals and algae on coral
reefs: a review of evidence and mechanisms. Coral Reefs, in press.
McCook, L.J. & Price, I.R. 1997a Macroalgal distributions on the Great Barrier Reef: a review
of patterns and causes. pp. 37–46 in Proceedings of the Great Barrier Reef: Science, Use
and Management, a National Conference. Great Barrier Reef Marine Park Authority,
Townsville.
McCook, L.J. & Price, I.R. 1997b The state of the algae of the Great Barrier Reef: what do we
know? pp. 194–204 in Wachenfeld, D., Oliver, J., & Davis, K. (eds) State of the Great
Barrier Reef World Heritage Area Report. Workshop Proceedings, Great Barrier Reef
Marine Park Authority, Townsville.
Miller, M.W. 1998 Coral/seaweed competition and the control of reef community structure
within and between latitudes. Oceanography Marine Biology Annual Review 36, 65–96.
Moss, A.J., Rayment, G.E., Reilly, N., & Best, E.K. 1993 A Preliminary Assessment of
Sediment and Nutrient Exports from Queensland Coastal Catchments. Department
Primary Industry and Queensland Department Environment & Heritage, Brisbane.
Prideaux, M. 1999 Presiding over a world heritage graveyard. Habitat 27, 16–17.
Pulseford, J.S. 1991 Historical inputs of fertiliser nutrients on to agricultural lands of coastal
North Queensland. pp. 39–52 in Yellowlees, D. (ed) Land Use Patterns and Nutrient
Loading of the Great Barrier Reef Region. Sir George Fisher Centre for Tropical Marine
Studies, James Cook University of North Queensland, Townsville.
Russ, G.R. & McCook, L.J. 1999 Potential effects of a cyclone on benthic algal production and
yield to grazers on coral reefs across the central Great Barrier Reef. Journal Experimental
Marine Biology Ecology 235, 237–254.
Smith, S.V., Kimmerer, W.J., Laws, E.A., Brock, R.E., & Walsh, T.W. 1981 Kaneohe Bay
sewage diversion experiment: perspectives on ecosystem responses to nutritional pertur-
bation. Pacific Science 35, 279–385
Stafford-Smith, M.G. 1992 Mortality of the hard coral Leptoria phygia under persistent sedi-
ment influx. Proceedings 7th International Coral Reef Symposium 1, 289–299.
Umar, J., McCook, L.J., & Price, I.R. 1998 Effects of sediment deposition on the seaweed
Sargassum on a fringing coral reef. Coral Reefs 17, 169–177.
Wachenfeld, D.R., Oliver, J.K., & Morrissey, J.I. 1998 State of the Great Barrier Reef World
Heritage Area 1998. Great Barrier Reef Marine Park Authority, Townsville.
Wolanski, E. 1994 Physical Oceanographic Processes of the Great Barrier Reef. CRC Marine
Science Series, CRC Press, Boca Raton, FL, 194 pp.
122 Oceanographic Processes of Coral Reefs
© 2001 by CRC Press LLC
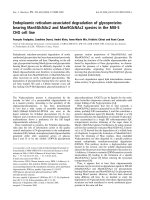
Causes of Coral Reef Degradation 123
FIGURE 2 Diagram showing ecological processes
influencing the relative abundance of corals and algae
on coral reefs, as modelled in this chapter. Red arrows
indicate negative effects (inhibition), black arrows
positive effects (enhancement).
FIGURE 3 Combined effects of eutrophication and
disturbances on coral and algal trajectories. Matrix of
community trajectories for combinations of
circumstances from oligotrophic to eutrophic (left to
right), and from no disturbances to frequent
disturbances (top to bottom). It can be seen that overall
coral cover (blue line) is reduced more when frequent
disturbances occur in eutrophic conditions (bottom
right), compared to either frequent disturbances alone
(bottom left) or eutrophic conditions alone (top right).
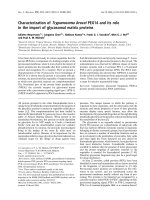
FIGURE 4 Bathymetric chart of central GBR area
used in Animation 6. The area shown is north of
Townsville, and includes the Palm Islands,
Hinchinbrook Island, and Goold and Brook Islands.
The view is vertically distorted in order to emphasize
the coral reef lagoon area. The mouth of the Herbert
River is in the middle of this area, and flood plumes
have been shown to extend as far out as the midshelf,
and to move north from the river mouth (Wolanski,
1994; see also King et al., Chapter 10, this book).
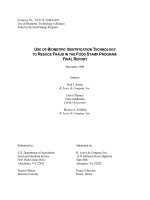
a
FIGURE 1 Photographs of inshore and offshore reefs
of the GBR, showing differences in both area and
amount of algae, and algal overgrowth of corals.
(a) Inshore reef, dominated by fleshy brown algae,
with high biomass per unit area, apparently
overgrowing corals. These reefs have relatively high
nutrient and sediment inputs, indicated by the turbidity
in this photograph, and low abundances of herbivorous
fish. (b) Offshore reef with lower inputs of terrestrial
nutrients and sediments (low turbidity), and higher
abundance of herbivorous fishes. Although
filamentous turf algae, coralline algae and larger
macroalgae are common in this scene, the biomass is
much lower than on the inshore reef.
b
© 2001 by CRC Press LLC
124 Oceanographic Processes of Coral Reefs
ANIMATION 1 Trajectories of algal and coral
abundance through time on an oligotrophic model
“reef” with low levels of sediments and nutrients. The
graph at the top shows the time course of algal and
coral abundance; the glyph (bar) to the right of the
graph shows the relative abundances of coral (blue)
and algae (brown), synchronised with the moving
indicator on the graph. The changes between algal and
coral dominance are portrayed by the varying
proportion of the two scenes at the bottom. Initial
conditions were set to be low in coral (20%) and high
in algae (80%), but rapidly equilibrate to the final
conditions (~80% coral and 20% algal cover).
ANIMATION 2 Trajectories of coral and algal
abundance with the same (oligotrophic) model
parameters as Animation 1, except that initial coral
and algal abundance are reversed, and little change
occurs. Comparison with Animation 1 shows that the
system equilibrates to the same levels independent of
starting conditions.
ANIMATION 3 Same as Animation 2 (oligotrophic),
except that two disturbances kill 30% of coral cover
(at t ϭ 100 and 300), resulting in an immediate rapid
dominance by algae (indicated by the sudden increases
in algae). However, the trajectories after each
disturbance return to the same equilibrium levels, with
high coral cover, provided there is sufficient recovery
time after each disturbance.
ANIMATION 4 Effects of moderately enhanced
sediments and nutrients on coral and algal trajectories;
otherwise, starting conditions and parameters as for
Animation 2.
© 2001 by CRC Press LLC
Causes of Coral Reef Degradation 125
ANIMATION 5 Effects of eutrophic conditions
(strongly enhanced sediments and nutrients) on coral
and algal trajectories; otherwise, starting conditions
and parameters as for Animation 2. The effect of the
sediments and nutrients is to shift the equilibrium state
to a lower coral cover and higher cover of algae: i.e.,
a partial phase shift. Note that the model dynamics
underlying this shift simulate effects of eutrophication
on corals and herbivory, not simply effects on algal
growth.
ANIMATION 6 Large-scale and long-term
interactions between terrestrial runoff and
disturbances. Model community trajectories for a
range of reefs across and along the continental shelf
(as shown in Figure 4). The trajectories shown are
based on a change in water conditions halfway
through the time periods (see Table 1), representing
the changes in terrestrial runoff over the last 100 years
(Pulseford, 1991; Moss et al., 1993; Brodie, 1995).
Offshore conditions remain oligotrophic, whereas
inshore conditions become progressively more
eutrophic; midshelf conditions are intermediate.
Disturbance frequencies and timing vary within cross-
shelf regions (details in Table 1), but are uniform
across the shelf. The effect of the flood plumes are
simulated by brief “nutrient pulses” of decreasing
strength to the north of the mouth of the Herbert River,
simultaneous with disturbances. The relative heights
of the glyphs or bars indicate the relative abundance of
corals (blue) and algae (brown; sudden shifts indicate
disturbance changes). The simulations run for twice as
long as those in animations 1 to 5; all “reefs” have
high initial coral cover (80%). It can be seen that even
in this relatively simple system with a known structure
(i.e., the model, plus Table 1), the background
variation overshadows the effects of eutrophication,
despite a definite, gradual decline of inshore reefs.
Note that, by the end of the simulations, several
inshore reefs are completely dominated by algae, to
the exclusion or near exclusion of corals.
© 2001 by CRC Press LLC