OCEANOGRAPHIC PROCESSES OF CORAL REEFS: Physical and Biological Links in the Great Barrier Reef - Chapter 12 pot
Bạn đang xem bản rút gọn của tài liệu. Xem và tải ngay bản đầy đủ của tài liệu tại đây (263.73 KB, 19 trang )
A Model of the Ecosystem,
and Associated Penaeid
Prawn Community,
in the Far Northern
Great Barrier Reef
Neil A. Gribble
CONTENTS
Introduction . . . . . . . . . . . . . . . . . . . . . . . . . . . . . . . . . . . . . . . . . . . . . . . . . . . . . . 189
Main Characteristics of the Model . . . . . . . . . . . . . . . . . . . . . . . . . . . . . . . . . . . . 190
Main Data Sources . . . . . . . . . . . . . . . . . . . . . . . . . . . . . . . . . . . . . . . . . . . . . . . . 191
Structure of Basic Model. . . . . . . . . . . . . . . . . . . . . . . . . . . . . . . . . . . . . . . . . . . . 191
Parameter Databases . . . . . . . . . . . . . . . . . . . . . . . . . . . . . . . . . . . . . . . . . . . . . . . 193
Primary Productivity, Phytoplankton, and Zooplankton . . . . . . . . . . . . . . . . . . . . 195
The Fishery . . . . . . . . . . . . . . . . . . . . . . . . . . . . . . . . . . . . . . . . . . . . . . . . . . . . . . 195
Balancing the Model . . . . . . . . . . . . . . . . . . . . . . . . . . . . . . . . . . . . . . . . . . . . . . . 196
Simulations . . . . . . . . . . . . . . . . . . . . . . . . . . . . . . . . . . . . . . . . . . . . . . . . . . . . . . 197
Results and Discussion . . . . . . . . . . . . . . . . . . . . . . . . . . . . . . . . . . . . . . . . . . . . . 200
Acknowledgments. . . . . . . . . . . . . . . . . . . . . . . . . . . . . . . . . . . . . . . . . . . . . . . . . 203
References . . . . . . . . . . . . . . . . . . . . . . . . . . . . . . . . . . . . . . . . . . . . . . . . . . . . . . . 203
INTRODUCTION
The Australian Great Barrier Reef (GBR) stretches 2000 km along the tropical and
sub-tropical east coast of the state of Queensland. This complex of lagoons, coral
reefs, shoals, and islands is enclosed in a marine national park which has been desig-
nated a multi-use world heritage area. Prior to the declaration of the marine park both
commercial trawling and line-fishing were carried out in the inner reef lagoon and
inter-reef gutters for penaeid prawns, and on the coral reefs themselves for line-
caught species, mainly coral trout. There are currently 650 prawn trawlers and over
1000 line-fishing vessels endorsed to work in the park.
12
189
© 2001 by CRC Press LLC
The presence of large-scale extractive fisheries inside a designated world her-
itage area requires a delicate balance between the economic needs of the fishery and
of conservation programs aimed at preserving biodiversity. For management the
objective shifts from optimising sustainable yield of the commercially valuable
species to a minimisation of the collateral damage to the ecosystem caused by the
process of fishing. This may require compromise in the economic returns to the fish-
ery in order to safeguard the biodiversity and environment of this unique area.
From a stock assessment point of view, the important parameters for models of
the fishery shift from maximum sustainable yield (MSY) to considerations of bycatch
and the effect of removal of species on the food web of the tropical coral reef ecosys-
tem. Opitz (1996) produced an exhaustive review and trophic-based ecosystem
model of a tropical coral reef system in the Caribbean (see also Polovina, 1984).
No such model exists for the GBR but Poiner et al. (1998) published the results
of a 5-year study of the effects of prawn trawling on the far northern GBR. The
latter study focussed mainly on the physical impact to the benthos but it also
produced cross-shelf surveys of close to 1000 taxa — from seabirds to polychaete
worms.
The current study combined the Opitz (1996) template for a coral reef ecosystem
with the survey results from Poiner et al. (1998) to produce a “mass-balance” trophic-
based ecosystem model of the GBR. This new model incorporated both the trawl and
line fisheries, and focussed on the dynamics of the penaeid prawn community in the
lagoon and inter-reef habitat. Trawl and line-fishing bycatch was specified and mon-
itored as were the biomass of seabirds and the endangered sea turtles. The aim was to
provide a tool that could give managers an insight into the effects that changes in fish-
eries regulation or spatial zoning would have on the ecosystem of the lagoon and
inter-reef as a whole, not just on the commercially targeted species.
The two major objectives of the modelling exercise were
1. To describe the ecosystem biomass flows in the far northern GBR,
focussing on the penaeid prawn trawl grounds
2. To explore the possible impacts of varying the fishing mortality and reduc-
ing discarded bycatch on selected species groups and system productivity
MAIN CHARACTERISTICS OF THE MODEL
This model represents the ecosystem of the inter-reef and inner lagoon on the GBR
cross-shelf, far northern GBR, Queensland (Figures 1a and b). Notable features of
this area include a large input of discards from the prawn trawl fishery, the seasonal
variation in rainfall (the monsoonal “wet”), and the inter-reef–associated hydrogra-
phy of the area. As a consequence, this area experiences seasonal variation in input
of detritus to the benthic compartment (both natural and from discarded bycatch) and
possibly in primary productivity. The model consists of 25 trophic groups, including
seabirds, sharks and rays, demersal fish (several groups), penaeid prawns, benthic
invertebrates, zooplankton, phytoplankton, discards, and detritus. The penaeid prawn
190 Oceanographic Processes of Coral Reefs
© 2001 by CRC Press LLC
group was subdivided into the three commercially exploited species and “other
prawns.” Similarly the prey/diet of the prawns was divided into reef-associated
and lagoon-associated groups. Discards from commercial line-fishing and trawling
were included in the model as a second detritus box, and its consumption was appor-
tioned among the major scavengers (seabirds, sharks, jacks, and the prawns/
crustaceans). A balanced model was achieved after adjusting the diet composition
matrix (for each of the 25 groups), biomass, and consumption/biomass (Q/B) ratios
of some groups.
The model was implemented using ECOPATH II software from ICLARM
(Christensen & Pauly, 1992) using the ECOSYM and ECOSPACE routines for tem-
poral and spatial simulations, respectively.
MAIN DATA SOURCES
The time period represented by the model is 1993 to 1994. Biomass and species com-
positions of the target prawns and of discards were obtained during two research
trawl cruises in the study area during this period. Biomass of fish and other non-fish
taxa was based on parallel fish trawling and benthic dredge samples taken at the time
of the prawn surveys (Poiner et al., 1998).
Information on diet, consumption, and production (i.e., to derive Q/B and P/B
estimates) was estimated from:
• The literature on prawn predation from the Gulf of Carpentaria (Brewer et
al., 1991; Salini et al., 1990, 1992, and 1998; Haywood et al., 1998)
• FISHBASE 99 (Froese & Pauly, 1999) fish database
• Previous Ecopath models: (a) the trophic interactions in Caribbean coral
reefs (Opitz, 1993 and 1996), and (b) for the shrimp fishery in the south-
west Gulf of Mexico (Sherry Manickchand-Heileman, UBC Fisheries
Centre, personal communication)
All data not derived from the GBR surveys were taken from tropical prawn
(shrimp) grounds with similar general characteristics. The “GBRprawn” model deals
with the inner lagoon and inter-reef trawl grounds and concentrates on the prawn
trawl fishery, rather than attempting a full-scale model of the entire GBR reef ecosys-
tem. (Note: The FISHBASE database has over 2000 fish species recorded from
Australian tropical reefs. This list does not include invertebrates, which would add
several thousand more species to a full GBR reef ecosystem model.)
STRUCTURE OF BASIC MODEL
The underlying equations for the ecosystem model are based on the “mass balance”
concept (see Polovina, 1984), i.e.,
Consumption ϩ Import ϭ Production ϩ Respiration
A Model of the Ecosystem and Associated Penaeid Prawn Community 191
© 2001 by CRC Press LLC
or
B
i
(P/B)
i
EE
i
ϭ Y
i
ϩ
Α
B
j
(Q/B)
i
DC
ij
where B ϭ biomass (i ϭ prey, j ϭ predator)
(P/B)
i
ϭ production/biomass
EE
i
ϭ production retained within the ecosystem (between 0 and 1)
Y
i
ϭ fisheries catch
(Q/B
j
) ϭ relative food consumption
DC
ij
ϭ fraction of i prey in diet of j predator
and where “production” is the sum of “export ϩ mortality due to predation ϩ flow
to detritus,” and where “consumption” is the sum of “production ϩ unassimilated
food ϩ respiration” (Christensen & Pauly, 1992).
The ECOPATH II software uses network analysis of biomass flows in a steady-
state (equilibrium) ecosystem expressed as a set of linear functions in a system of
simultaneous linear equations. The model is standardised to gram wet weight per
square metre and equivalent annual rates of flow (Christensen & Pauly, 1992).
ECOSYM and ECOSPACE are modelling tools for representing spatially aggre-
gated dynamics of whole ecosystems by a combination of differential equations
for biomass dynamics of some of the ecosystem components or “pools.” These are
used along with delay-difference age-structured equations for some key populations
that have complex trophic ontogenies and selective harvesting of older animals
(Walters et al., 1998). The differential equations for aggregate biomass pools are of
the form
ᎏ
d
d
B
t
i
ᎏ
ϭ g
i
Α
j
C
ji
Ϫ
Α
j
C
ij
ϩ I
i
Ϫ (M
i
ϩ F
i
ϩ e
i
) B
i
where B ϭ biomass
C ϭ consumption
g
i
ϭ net growth efficiency
I
i
ϭ biomass immigration rate
M
i
ϭ non-predation mortality/metabolic rate
F
i
ϭ fishing mortality
e
i
ϭ emigration rate
while C
ij
is the consumption rate of pool i biomass by pool j organisms, i.e., the flow
from pool i to pool j per unit time.
ECOSIM assumes that consumption rates or flows are limited by “risk manage-
ment” behaviour of prey and predator at very small space-time scales, such that prey
consumption events take place mainly in foraging “arenas” where prey are vulnera-
ble to predation through their own requirements for resource acquisition (Walters
et al., 1998). Flows may range from strongly prey controlled (bottom-up) to predator/
prey controlled (top-down).
192 Oceanographic Processes of Coral Reefs
© 2001 by CRC Press LLC
The rate relationship takes the form
C
ij
ϭ
ᎏ
(v
ij
ϩ
ij
v
a
i
i
j
j
Ј
B
ϩ
i
B
j
a
ij
B
j
)
ᎏ
where C ϭ consumption
B ϭ biomass
a
ij
ϭ rate of effective search for pool type i by predator j
v
ij
ϭ prey behavioural exchange rate parameter 1
v
ij
Јϭ prey behavioural exchange rate parameter 2
Note: For derivation see Walters et al. (1998).
Growth and mortality accounting in the delay-difference framework is structured
so that species represented by split pools (juveniles vs. adults) display overall bio-
mass dynamics and ecosystem linkages/dependencies similar to the differential equa-
tion for aggregate pools. An added complexity is that adult biomass dynamics can
depend strongly on recruitment changes caused by changes in trophic circumstances
faced by juveniles.
Input parameter estimates were derived from the ECOPATH II model. C
ij
esti-
mates were taken as the Q
ij
estimates from the ECOPATH model to calculate the crit-
ical feeding rate parameters, a
ij
and v
ij
. Additional growth data for the split pools
(juvenile vs. adults if these are specified) needed to be supplied (Walters et al., 1998).
PARAMETER DATABASES
Fish and non-fish groups were those determined by Opitz (1993 and 1996) for a
Carribean Reef coral system using intuitive and multivariate methods of aggregating
species into groups based on diet consumption, body size, and lifestyle. Fish species
lists were compared between the survey data of Poiner et al. (1998) and those of Opitz
(1996) and matching or analogous species assigned to the appropriate “functional”
group. Due to a high level of endemism in both the GBR and the Caribbean only
6 species were directly comparable but 27 genera matched, and there was a very good
match at the family level. “Large fish” were defined as greater than 30 cm maximum
size as described in FISHBASE 99 (Froese & Pauly, 1999). This somewhat arbitrary
length was determined heuristically as a natural division of fish sizes in the survey
data. Diet (carnivore, omnivore, or herbivore) and lifestyle (schooling or non-school-
ing) information was taken from species descriptions in FISHBASE 99 (Froese
& Pauly, 1999) and Randall et al. (1990). The two herbivore groups of Opitz (1996)
were combined as one in the “GBR prawn” model; survey data (Poiner et al., 1998)
showed the biomass in these groups separately was very low in the lagoon and inter-reef.
A similar aggregation process was carried out with the non-fish taxa of the GBR
to assign them to the grouping of Opitz (1993 and 1996). Cephalopod biomass was a
summation of estimates from the benthic dredge and from the fish-trawl sampling
data (Poiner et al., 1998). It was considered that each gear sampled a different com-
ponent of the cephalopod community and therefore the best estimate of total biomass
A Model of the Ecosystem and Associated Penaeid Prawn Community 193
© 2001 by CRC Press LLC
was gained by their summation. Echinoderm biomass was determined from the ben-
thic dredge samples (Poiner et al., 1998) with crinoids removed, following the logic
of Opitz (1993). Crustacean biomass was again a summation of estimates from the
benthic dredge and from the fish-trawl sampling (Poiner et al., 1998) but with the
prawn biomass excluded. Penaeid prawn biomass was estimated from combined
prawn trawl data and dredge data (Poiner et al., 1998), as these devices sample sepa-
rate components of the community; i.e., those that “flick” up into the water column
and are caught by the trawl gear, and those that remain buried in the substrate but
which are taken by the dredge. Biomass estimates for the “Worms and Molluscs” cat-
egory came from a combination of the Polychaeta, Sipunculidae, and Mollusca esti-
mates from the benthic dredge data (Poiner et al., 1998). “Sessile animal” biomass
estimate was a summation of the Porifera, Cnidaria, Bryozoa, and Ascidiacea, esti-
mates from the benthic dredge data (Poiner et al., 1998). The animal component of
Cnidarian Corals was calculated as 25% of the biomass, with the remaining 75%
taken as the algal symbionts (following Opitz, 1993). The symbiont component was
added to the benthic producer/autotroph group. This group was made up of seagrass,
algae, and the coral algal symbionts.
Biomass estimates for the invertebrate component, including benthic pro-
ducer/autotrophs, of the ecosystem were made from a combination of benthic dredge
and fish trawl bycatch data, however, as only the lagoon and inter-reef were sampled
this is a very large underestimate of the biomass if the reef proper were added.
Biomass estimates for seabirds and turtles were taken from Opitz (1996) but
these were consistent with the information from Poiner et al. (1998), although no spe-
cific “catch” rates were quoted in the latter study. In the case of seabirds, little direct
predation or harvest was included in the model but the bird colonies do produce
chicks, therefore a net emigration (or effective loss of biomass to the system) was
included. Turtles are harvested by indigenous communities in northern Queensland,
therefore this catch together with the trawl bycatch was included in the “Fleet” fish-
ing component of the model. In the absence of hard data these catches could only be
approximated.
The catch rate of each species in the GBR surveys was reported as gram per hour
by Poiner et al. (1998). This was converted to biomass in gram per square metre by
dividing the catch rate by the area in meters swept per hour by the sampling gear used
(prawn trawl, fish trawl, or benthic dredge). Given the inefficiency and size selectiv-
ity of trawl gear, a catchability coefficient (q) of 0.3 to 0.5 was assumed; hence the
relative biomass estimates were multiplied by a factor of 3 to give more realistic ini-
tial biomass estimates. The dredge data were taken as a reasonable initial estimate, as
escapement and size bias of benthos would be low for this type of gear. The biomass
estimates were then summed for the species assigned to each group, giving an
initial group biomass estimate. In effect this scaled the Caribbean reef ecosystem
“template” to that of an Australian GBR system.
The diet composition data were taken from the review in Opitz (1996), supple-
mented by what was available on FISHBASE 99 (Froese & Pauly, 1999) and in the
literature on species of the GBR. Similarly, initial estimates of P/B and Q/B for the
functional groups were based on those of Opitz (1996) where local estimates were
194 Oceanographic Processes of Coral Reefs
© 2001 by CRC Press LLC
unavailable. The Opitz estimates were for an unfished area, therefore the biomass of
the “fished” GBR could be expected to be lower (as was the case), which would give
the GBR relatively higher P/B and Q/B ratios, particularly for targeted species.
The second phase of the specification process was to add groups that were par-
ticular to the GBR or that were of particular interest in terms of the effects of fishing
on the ecosystem. Initially these were the major commercial species of prawns and
the discarded bycatch (detritus/discards) that is generated from prawn trawling. The
Ecopath model of the prawn fishery in the southern Gulf of Mexico (Sherry
Manickchand-Heileman, UBC Fisheries Centre, personal communication) was used
as a general source of estimates for these components of the GBR model. Again
local estimates of the biomass of prawn species and discarded bycatch were used
where possible (see Poiner et al., 1998). Fate of the discards, as components of
scavenger diets or as detritus, was estimated from diet studies (FISHBASE) and
Poiner et al. (1998).
PRIMARY PRODUCTIVITY, PHYTOPLANKTON,
AND ZOOPLANKTON
Phytoplankton, micro- and meso-zooplankton abundance, biomass, and produc-
tion/consumption estimates for the GBR were taken from Sorikin (1994). Primary
productivity estimates (excluding phytoplankton) were taken as an average from var-
ious authors including Johnson et al. (1995), Roman et al. (1990), and Klump et al.
(1988).
THE FISHERY
The fishery was divided into two fleets:
• The reef line fishery for large reef/inter-reef carnivores, both schooling and
non-schooling fish, which was combined with the indigenous harvest of tur-
tles (FLEET 1).
• The prawn trawl fishery for penaeid prawns (FLEET 2), which produces the
highest proportion of discarded bycatch. Poiner et al. (1998) estimated a
ratio of 8:1 to 12:1 by weight of bycatch to retained catch.
Harvest rates for the prawn trawl fishery were taken from Gribble and Robertson
(1998). Both legal and illegal fishing were included in the biomass estimates but these
were spread over the total area modelled. Gribble and Robertson (1998) found that
within the GBR study area small areas or regions could be heavily trawled (e.g., parts
of the inshore lagoon), while the majority received relatively little or no trawling.
Therefore it was found to be necessary to scale this harvest biomass slightly to bal-
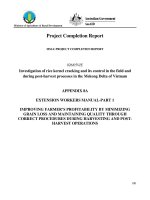
ance the model. Similarly the trawl bycatch biomass had to be scaled. The majority
of the bycatch or detritus/discards was “trash” fish consisting of small bottom omni-
vores and herbivores (Figure 2). A small biomass of adult turtles was taken as trawl
A Model of the Ecosystem and Associated Penaeid Prawn Community 195
© 2001 by CRC Press LLC
bycatch, which required adjusting its P/B ratio (i.e., analogous to total mortality or Z)
upward. Effectively the fishery was another consumer in the model and its “diet” was
the catch composition.
Harvest rates for the line/indigenous fishery were roughly estimated from the
QFMA QFISH compulsory catch and effort logbook database. The major difficulty
was to determine the biomass in g m
2
when there was no way of calculating a “swept
area” for either recorded line-fishing or non-recorded indigenous/recreational fishing
methods. The estimates in the model were adjusted to balance the biomass flows but
should be considered as intuitive rather than precise.
BALANCING THE MODEL
First attempts at running the model gave values of EE (ecotrophic efficiency) greater
than 1 for almost all the groups, i.e., more biomass was utilised within the ecosystem
than actually existed. This presented a problem in balancing the model since there
was very little flexibility for adjusting the biomass matrix (determined from survey).
There was scope, however, to increase the biomass of the mobile carnivores, as pre-
sumably they would have used the reef as a refugia, hence biasing the lagoon and
inter-reef fish trawl catch downward significantly. The benthic producer/autotrophs
would also have been underestimated because of their occurrence on the reef proper
outside the range of the inter-reef benthic dredge. It also appeared that the estimate
of discards was too high. This was adjusted downward to “spread” the discards over
the total area modelled and to scale the biomass of discards (determined from prawn
trawl data) in line with the biomass of its component species (determined from fish
trawl data). Poiner et al. (1998) noted that the prawn trawl was more efficient at har-
vesting the smaller bottom dwelling fish than the fish trawl. The parameter estimates
of Q/B and P/B were based on Opitz (1996) and were low for some of the fished
species. The Opitz estimates, however, were from an unfished reef; therefore, to com-
pensate, the estimates for these species were adjusted upward by 50%.
Most fine-tuning was carried out in the diets of the various trophic groups, where
there was a degree of flexibility. A trophic group was an amalgam of species with dif-
ferent dietary preferences, therefore the group as a whole had a reasonably gener-
alised diet. Opitz (1996) allowed for this, for example, by defining herbivores as
having greater than 50% plant material in their diet.
Insufficient detritus in the model remained a problem after all other trophic
groups were balanced. This was tackled in two ways:
1. The extra detritus needed was considered as an import to the lagoon and
inter-reef system from the land and from the reef proper.
2. The autotroph biomass component of the ecosystem was increased to pro-
vide the required detritus, which could be justified as coming from the pri-
marily autotrophic reef proper.
Allied with this problem was the lack of prey biomass for the biomass of fish preda-
tors in the model. To compensate the biomass of fish herbivores was increased in line
196 Oceanographic Processes of Coral Reefs
© 2001 by CRC Press LLC
with the increase in autotrophs (option 2 above). As with mobile carnivores, the reef-
associated herbivores would have been under-represented in lagoon and inter-reef
fish trawls; therefore the relative increase was logical. In both cases, after adjustment,
re-scaling, and diet fine-tuning it was possible to achieve a preliminary balanced
model. A small import of detritus from the land was kept in the model to allow for
output from coastal mangrove systems.
Finally, minor increases to the P/B estimates for echinoderms, benthic mol-
luscs/worms, and decomposer/microfauna were necessary to bring their respective
gross efficiency or production/consumption ratios (see Table 1) down to below the
recommended 0.3 (V. Christensen, UBC Fisheries Centre, personal communication).
This required further fine-tuning of the diet matrix to re-balance the system.
Lack of data for some of the species was a problem. Since the discards consist
of species of no economic importance, published information on diet in particular
was sparse. Also, more precise estimates of the quantity of discards and proportion
consumed by each scavenger group were needed.
SIMULATIONS
A fine-tuning process was required to re-balance the model as published by Opitz
(1996), due in part to the slight differences in versions of ECOPATH II software used
by the respective authors. All changes made were within the tolerances suggested by
Opitz (1996) as appropriate to the collated data she used. More realistic values from
the GBR were substituted and the model re-balanced. Again the changes made were
kept within reasonable limits. The biomass estimates from the surveys (Poiner et al.,
1998) were robust with only increases between factors of 1.5 and 4 needed, with the
special exception of the biomass of autotrophs and fish herbivores, which were
increased by a factor of 100 and 8, respectively (see the section “Balancing the
Model” for explanation).
underlying assumptions of the model and a different set of assumptions may also pro-
duce a balanced model. Therefore the “GBRprawn” model should be viewed as a
“virtual” lagoon and inter-reef ecosystem which captures the major biomass dynam-
ics and flows of the “real,” much more complex system. “Reality” checks were nec-
essary, comparing the behaviour of the simulations to that observed independently
through logbooks or fishermen’s anecdotal experience. That is, the results had to be
kept biologically reasonable.
As noted earlier, the spatial nature of the GBR habitat/ecosystem was in part
incorporated in the diet matrix, i.e., diet composition of inter-reef species vs. that of
species found in the inshore reef lagoon. This spatial component to the model was
explored further using the ECOSPACE simulation routine. The dynamic effects of
the prawn fishery were explored in ECOSYM simulations (Walters et al., 1998). Both
these simulation routines used the balanced ECOPATH II “GBRprawn” model as a
model. Both transient and long-term effects of trawling on the prawn stocks were
A Model of the Ecosystem and Associated Penaeid Prawn Community 197
© 2001 by CRC Press LLC
These adjustments to biomass, Q/B, P/B, and diet composition represent the
starting point. Tables 1 and 2 present the input parameters for the “GBR prawn”
simulated with the fishing scenarios and results presented in Figures 5 and 6. These
simulations were used primarily to “reality check” the basic ecosystem model, as the
historic behaviour of the targeted stocks is the best documented, i.e., through com-
pulsory catch and effort logbooks.
Fisheries Critical Issues Group, where a 5% reduction in effort per year was applied
specific reduction in fishing area was applied nor were Marine Representative Areas
(MPAs) introduced, although this is possible in the model. Table 3 presents the
changes in biomass and commercial catch described by the scenario, with before and
magnitude of change).
198 Oceanographic Processes of Coral Reefs
TABLE 1
Basic Parameters for Ecopath Ecosystem Model of the Far Northern GBR
Inter-Reef and Lagoon
Group Trophic Biomass Prod/Biom Cons/Biom Ecotrophic
No. Group Name Level (t/km
2
) (/year) (/year) Prod/Cons Efficiency
1 Cephalopods 3.50 0.328 4.590 17.550 0.262 0.921
2 Large groupers 3.50 0.035 0.370 2.300 0.161 0.906
3 Scombrids/jacks 3.50 2.024 0.720 8.900 0.081 0.681
4 Seabirds 3.40 0.015 5.400 80.000 0.068 0.904
5 Large sharks/rays 3.30 0.557 0.240 4.900 0.049 0.793
6 Small schooling fish 3.20 3.122 2.250 20.050 0.112 0.973
7 Large fish carnivores 3.10 1.780 0.960 10.960 0.088 0.946
8 Large schooling fish 3.10 0.600 1.246 12.700 0.098 0.912
9 P. longistylus 2.90 0.064 7.570 37.900 0.200 0.953
10 Other prawns 2.80 0.201 1.100 20.000 0.055 0.992
11 P. esculentus 2.80 0.177 7.570 37.900 0.200 0.825
12 Small fish omnivores 2.70 2.226 2.355 12.800 0.184 0.917
13 Sea turtles (large) 2.50 0.007 0.900 3.500 0.257 0.952
14 Crustaceans 2.50 2.741 3.100 20.000 0.155 0.987
15 M. endeavouri 2.50 0.142 7.570 37.900 0.200 0.873
16 Ectiinoderms 2.40 8.404 1.500 6.000 0.250 0.842
17 Benthic molluscs/worms 2.30 10.972 2.900 10.000 0.290 0.992
18 Zooplankton 2.20 3.216 40.000 165.000 0.242 0.716
19 Sessile animals 2.00 30.950 0.800 12.000 0.067 0.940
20 Fish herbivore 2.00 7.116 2.730 37.450 0.073 0.856
21 Decomposer/microfauna 2.00 6.000 120.000 400.000 0.300 0.197
22 Phytoplankton 1.00 7.515 70.000 0.855
23 Benthic autotrophs 1.00 175.109 13.250 0.156
24 Detritus/discards 1.00 3.836 0.966
25 Detritus 1.00 40.000 0.683
biomass utilised within the ecosystem.
© 2001 by CRC Press LLC
The final set of simulations follows the scenario suggested by the GBRMPA
Note: “Prod” ϭ production, “Cons” ϭ consumption, “Ecotrophic Efficiency” ϭ the proportion of the
after estimates plus the ratio of end-to-start biomass and catch (i.e., direction and
until the effort reached 50% of current 1997 levels (Figure 7 and Animation 1). No
A Model of the Ecosystem and Associated Penaeid Prawn Community 199
TABLE 2
Diet for Each Trophic Grouping in the Ecopath Ecosystem Model of the Far Northern GBR Inter-Reef and Lagoon
Prey/Predator 123456789
1011121314151617181920
1 Cephalopods 0.100 0.021 0.024 0.005
0.002 0.002 0.003
2 Large groupers
0.001
3 Scombrids/jacks 0.020 0.100 0.030 0.014 0.001
4 Seabirds 0.003
5 Large sharks/rays 0.010 0.001 0.010
6 Small schooling fish 0.065 0.253 0.200 0.063 0.004 0.030 0.040
0.002 0.005
7 Large fish carnivores 0.010 0.492 0.050 0.090 0.140 0.005 0.005
8 Large schooling fish 0.065 0.150 0.005 0.004 0.002
9 P. longistylus 0.007 0.005 0.015
0.005
10 Other prawns 0.010 0.007 0.005 0.001 0.010
11 P. esculentus 0.025 0.020 0.035
0.010 0.010
12 Small fish omnivores 0.005 0.070 0.041 0.084 0.010 0.002 0.015 0.002
13 Sea turtles (large)
14 Crustaceans 0.100 0.300 0.030 0.060 0.005 0.010 0.005 0.200 0.040 0.180 0.045 0.125 0.030 0.100 0.002 0.010
15 M. endeavouri 0.020 0.030 0.035
0.007 0.010
16 Echinoderms
0.021 0.130 0.130 0.093 0.040 0.030 0.059 0.002
17 Benthic 0.420 0.018
0.169 0.200 0.100 0.200 0.300 0.200 0.200 0.045 0.090 0.052 0.065
0.001
molluscs/worms
18 Zooplankton 0.200 0.025 0.050 0.974 0.120 0.720 0.010 0.076 0.010 0.105 0.120 0.100 0.003 0.006 0.025 0.004
19 Sessile animals
0.011 0.006 0.070 0.200 0.035 0.200 0.030 0.200 0.095 0.100 0.100 0.059
20 Fish herbivores 0.430 0.002 0.010 0.300
0.016 0.001
21 Decomposer/microfauna
0.002 0.090 0.055 0.055 0.100 0.117 0.170 0.200 0.019
22 Phytoplankton
0.002 0.005 0.010 0.040 0.113 0.003 0.084 0.800 0.022 0.001
23 Benthic autotrophs
0.006 0.087 0.015 0.010 0.216 0.570 0.200 0.554 0.179 0.084 0.988
24 Detritus/discards 0.025 0.198 0.305 0.263 0.117 0.100 0.103 0.200
0.400
25 Detritus 0.030
0.016 0.010 0.200 0.232 0.200 0.216 0.257 0.200 0.107 0.425 0.085 0.006
26 Import
27 Sum 1.000 1.000 1.000 1.000 1.000 1.000 1.000 1.000 1.000 1.000 1.000 1.000 1.000 1.000 1.000 1.000 1.000 1.0 00 1.000 1.000
© 2001 by CRC Press LLC
RESULTS AND DISCUSSION
The ECOPATH II ecosystem model (Christensen & Pauly, 1992) was summarised
first by a box/compartment diagrams (Figure 3) showing biomass flows, and second
with a plot of mixed trophic impacts (on competitors and/or prey) (Figure 4). The data
for the figures were sorted from highest to lowest trophic level, as estimated by ECO-
PATH II, and hence can be compared directly. The full box/compartment diagram
200 Oceanographic Processes of Coral Reefs
TABLE 3
Results from “GBRprawn” Simulation of a 5% Reduction in Prawn-Trawl
Effort per Year Applied until the Effort Reached 50% of Current 1997 Levels
Start End Ratio Start End Ratio
Group Biomass Biomass E/S Catch Catch E/S
Cephalopods 0.328 0.296 .90
Large groupers 0.035 0.030 .86
Scombrids/jacks 2.028 2.256 1.11
Seabirds 0.015 0.013 .85
Large sharks/ray 0.556 0.493 .89
Small schooling fish 3.122 3.009 .96
Large fish carnivores 1.781 1.776 1.00
Large schooling fish 0.599 0.565 .94
P. longistylus 0.065 0.065 1.00 .010 .004 .45
Other prawns 0.201 0.190 .95
P. esculentus 0.177 0.151 .86 .245 .100 .41
Small fish omnivores 2.248 3.034 1.35
Sea turtles (large) 0.007 0.018 2.59
Crustaceas 2.737 2.635 .96
M. endeavouri 0.142 0.108 .76 .245 .089 .36
Echinoderms 8.390 7.731 .92
Benthic molluscs/worms 10.958 10.302 .94
Zooplankton 3.215 3.221 1.00
Sessile animals 30.970 32.948 1.06
Fish herbivores 7.130 7.425 1.04
Decomposer/microfauna 5.892 5.892 .98
Phytoplankton 7.517 7.500 1.00
Benthic autotrophs 175.035 173.213 .99
Discards 65.179 38.967 .60
Detritus 39.990 39.594 .99
Benthic autotrophs
Notes: Biomass in tonne/km
2
; E/S is ratio of the biomass or catch at the end of a simulation to that at the
start.
“Discards” include reef line fishery.
© 2001 by CRC Press LLC
shows a complex system with many levels of trophic interactions resulting in a web
of predator/prey relationships. Large groupers, scombrids/jacks and somewhat sur-
prisingly Cephalopods come out as the top trophic level, with benthic autotrophs,
phytoplankton, and detritus/discards as the bottom level. Cephalopods, which
include octopus and squid, have a varied carnivorous diet that includes the larval and
juvenile stages of most other groups, hence the high trophic level of the group.
Network analysis (Christensen & Pauly, 1992) of these relationships yields the
mixed trophic impact diagram (Figure 4). Trophic cascades, where removal of preda-
tors “release” the biomass of their prey, can be shown simply with such diagrams
when ordered by trophic level (V. Christensen UBC Fisheries Centre, personal com-
munication). In Figure 4 the higher trophic levels are negatively impacted by fishing
and by other predators but there are no corresponding dramatic increases in biomass
of prey species, although most positive impacts are amongst prey species in the lower
left-hand quadrant of the diagram. The complex web pattern of interactions shown in
the box/compartment diagram (Figure 3) mitigates against simple direct cascade
reaction of prey biomass to the removal of predators or competitors.
It is interesting that the trawl fleet (Fleet 2) appears to show little impact on the
target prawn species (Figure 4), although it has a considerably greater impact on omni-
vore fish and large turtles. This is possibly due to counteracting effects of decreasing
prawn biomass from fishing, balanced by increasing biomass from reduced predation
and/or competition of bycatch species. Indeed, network analysis shows that “omnivore
fish” have a negative impact on the biomass of each of the prawn species. The net
result appears to be a sustainable harvest, at least for the target species.
The ECOSYM simulations indicated that after a period of fishing (equilibrium),
if fishing were removed there would be a decrease in the prawn biomass, and as fish-
ing increased moderately the biomass of P. esculentus and M. endeavouri increased
(Figure 5). At high levels of fishing, however, the biomass of both species decreased.
This reaction matched anecdotal evidence from long-term trawler operators (Gribble
& Robertson, 1998). Furthermore, there was a differential increase between P. escu-
lentus and M. endeavouri (Figure 5), which matched that observed in logbook data
from the Far Northern prawn trawl grounds; i.e., the ECOSYM results were consis-
tent with independent “reality” checks.
When fishing was removed, the biomass of M. endeavouri decreased rapidly but
conversely recovered just as rapidly when fishing was re-introduced. Consequently
the ratio of P. esculentus and M. endeavouri biomass was high when there was no
fishing but much lower when fished. This was also the case when a 100-year time-
series was simulated, with a 30-year period of without trawling followed by 30 years
of fishery development and a final 40 years at current trawling effort levels (Figure
6). Given that P. esculentus, the brown tiger prawn, commands a premium export
price, this appears to be a perverse relationship, but one that is well known to trawler
operators (Gribble & Robertson, 1998). Historically new trawl grounds yielded a
high percentage of tiger prawns when first discovered but shifted to a mixture with
lower value prawns after the initial development.
Penaeus longistylus biomass decreased slightly with increasing fishing pressure
under both scenarios, as did “other prawns” category (Figure 7). This matched the
A Model of the Ecosystem and Associated Penaeid Prawn Community 201
© 2001 by CRC Press LLC
general response of coral prawns (those associated with the reef and inter-reef [see
Poiner et al., 1998]) but not for the logbook data on P. longistylus which showed no
relative decrease. The drop was almost certainly caused by the spatial distribution of
this species (or lack of it in the ECOSYM simulations), which was explored further
using ECOSPACE. Large parts of the reef-shoal habitat are normally not available to
trawling due to the physical structure of the sea bottom, hence these areas would
operate as refugia for P. longistylus. It would be expected that in general, trawling
should have relatively less impact on this species unless improved gear and/or navi-
gation aids allowed heavier trawling in “rough grounds.”
The ECOSPACE simulations assigned species to their preferred habitat type,
which was mapped onto the study area (see Poiner et al., 1998), i.e., the model was
made spatially explicit. Fishing was also assigned to habitat types but was further
restricted by mapping the “costs” of fishing in the different habitats. Penaeus escu-
lentus was assigned to the inshore lagoon, P. longistylus to the inter-reef habitat, and
M. endeavouri straddled both habitats. The trawl fleet could fish in both the inshore
lagoon and the inter-reef but the cost of fishing increased farther offshore into the
inter-reef habitat. The line fishery fleet was restricted to the reef-shoal and inter-reef
habitats. Again it was made slightly more “costly” to line-fish in the offshore sections
of these habitats rather than in the more accessible inshore edge of the reef shoal and
inter-reef. The rationale for these increasing costs was the increased fuel required,
loss of fishing gear in the rougher terrain, and an increased risk of boat damage in the
mostly uncharted offshore shoal-reef zone. The offshore lagoon habitat was
not fished in this simulation because of its exposed position, very rough bottom
(extensive plate coral), and to provide a refugia for turtles and seabirds around nest-
site islands and shoals. This scenario broadly matched the known fishing behaviour
of trawlers and line-fishers in the far northern GBR (Gribble & Robertson, 1998;
Poiner et al., 1998).
Spatial simulations of the scenario above, with a reduction followed by a re-
introduction of trawling, showed that the spatial distribution P. longistylus did ame-
liorate the effect of trawling seen in the ECOSYM dynamic simulation (Figure 5).
The difficulty of trawling in the outer region of the GBR cross-shelf (modelled as a
higher “cost” of trawling in this region) means that a proportion of the red-spot king
prawn population is not vulnerable to trawling. This is effectively a de facto marine
protected area (MPA) for this species. Similarly, the sea-turtle biomass rose signifi-
cantly during the initial years of the simulation because of the offshore refugia, hence
the reduction in trawling had less of an impact. The trajectory was less dramatic than
shown in Figure 7, but turtle biomass still increased with decreasing trawl effort
(Figure 8).
The final scenario, suggested by GBRMPA management, involved the basic sce-
nario (as above) but with a 5% reduction in effort per year until trawl effort was 50%
of current levels. Under this scenario biomass increased in bycatch species such as
sea turtles, scombrids/jacks, and small fish omnivores (comprising most of the trawl
bycatch) but decreased in commercial prawns and species that benefited from the
trawl bycatch, such as cephalopods, groupers, and sharks/rays (see Table 3). The dra-
matic increase in sea turtle biomass (Figures 7 and 8), despite there being only a very
202 Oceanographic Processes of Coral Reefs
© 2001 by CRC Press LLC
small bycatch of this group in the model, highlights the need for turtle-excluding
devices (TEDs) in trawl gear as is required in the new management plan. Seabirds
feeding off discards showed a 15% drop in biomass with the 50% drop in trawl effort
(Table 3), which is consistent with results of independent seabird studies (Blaber et
al., 1995; Blaber et al., 1998; Milton et al., 1996).
A number of insights can be gained from the ecosystem modelling of the GBR
prawn fishery. Firstly, prawn biomass appears resilient to trawling because prawns
benefit from trawling through removal of competitors and predators, and from the
increase in food either directly from discarded bycatch or indirectly from an increase
in prey species that feed on the discards. Conversely, a reduction in the discarded
bycatch would carry a “cost” in the concomitant reduction in the biomass of com-
mercial prawn species. The model suggests that trawl bycatch reduction devices
(BRDs) will have this cost, proportional to the percentage of bycatch reduced (cur-
rently at 20%). The reduction in trawl effort will naturally cause a decrease in the
catch of prawns, with a concomitant decrease in discards (see Table 3). According to
the ecosystem model this reduced catch is due to a lower trawl effort but is also com-
pounded by a decrease in the prawn biomass caused by the reduction in discards. For
P. esculentus and M. endeavouri this translates as a 59 and 64% reduction in catch,
respectively, in response to a 50% reduction in trawl effort (across the whole fleet).
There was also a 55% decease in the catch of P. longistylus in response to the 50%
drop in effort, although there was not a reduction in biomass as with the other prawn
species (Table 3). Spatial simulations suggested that the reduced effort would be con-
centrated in the inner lagoon, rather than the “more costly” reef-shoal areas, which
would reduce the catch of the reef-associated P. longistylus. The Latin expression
“nullum gratuitum prandium” (no free lunch) best covers this trade-off.
ACKNOWLEDGMENTS
The GBR cross-shelf surveys were funded by the FRDC, GBRMPA, and QFMA. The
ecosystem modelling forms part of an M.Sc. project with TESAG, James Cook
University, Townsville, and was supported by a QDPI SARAS scholarship. The
ecosystem model was completed during a Visiting Scientist appointment at the
University of British Columbia, Fisheries Centre. The author wishes to thank Prof.
Tony Pitcher for the opportunity to visit the Fishery Centre; Prof. Daniel Pauly and
Dr. Villy Christensen, for their patience and much appreciated advice with ECO-
PATH II; Prof. Carl Walters for his assistance with the ECOSYM and ECOSPACE
simulations; and Sherry Manickchand-Heileman, UBC Fisheries Centre, for the use
of her ecosystems model of the shrimp fishery in southern Gulf of Mexico.
REFERENCES
Anderson, M.J. & Gribble, N.A. 1998 Partitioning the variation among spatial, temporal, and
environmental components in a multivariate data set. Australian Journal of Ecology 23,
158–167.
A Model of the Ecosystem and Associated Penaeid Prawn Community 203
© 2001 by CRC Press LLC
Blaber, S.J.M., Milton, D.A., Smith, G.C., & Farmer, M.J. 1995 Trawl discards in the diets of
tropical seabirds of the northern Great Barrier Reef, Australia. Marine Ecology Progress
Series 127, 1–13.
Blaber, S.J.M., Milton, D.A., Farmer, M.J., & Smith, G.C. 1998 Seabird breeding populations
on the far northern Great Barrier Reef, Australia: trends and influences. Emu 98, 44 –57.
Brewer, D.T., Blaber, S.J.M., & Salini, J.P. 1991 Predation on penaeid prawns by fishes in
Albotross Bay, Gulf of Carpentaria. Marine Biology 109, 231–240.
Christensen, V. & Pauly, D. 1992 ECOPATH II a software for balancing steady-state models
and calculating network characteristics. Ecological Modelling 61, 169–185.
Froese, R. & Pauly, D. (eds) 1999 FishBase 99. World Wide Web electronic publication.
Gribble, N.A. & Robertson, J. 1998 Fishing effort in the far northern cross-shelf closure of the
Great Barrier Reef Marine Park: the effectiveness of area closures. Journal of
Environmental Management 52, 53–67.
Haywood, M.D.E., Heales, D.S., Kenyon, R.A., Loneragan, N.R., & Vance, D.J. 1998
Predation of juvenile tiger prawns in a tropical Australian estuary. Marine Ecology
Progress Series 162, 201–214.
Johnson, C., Klump, D.W., Field, J., & Bradbury, R. 1995 Carbon flux on coral reefs: effects
of large shifts in community structure. Marine Ecology Progress Series 126, 123–143.
Klump, D.W., McKinnon, A.D., & Mundy, C.N. 1988 Motile cryptofauna of a coral reef: abun-
dance, distribution and trophic potential. Marine Ecology Progress Series 45, 95–108.
Milton, D.A., Smith, G.C., & Blaber, S.J.M. 1996 Variable success in breeding of the roseate
tern Sterna dougallii on the northern Great Barrier Reef. Emu 96, 123–131.
Opitz, D. 1993 A quantitative model of the trophic interactions in a Caribbean coral reef
ecosystem. In Christensen, V. & Pauly, D. (eds) Trophic Models of Aquatic Ecosystems.
ICLARM Publication, Manila, 390 pp.
Opitz, S. 1996 Trophic Interactions in Caribbean Coral Reefs. ICLARM Publication Manila,
268 pp.
Pauly, D., Soriano-Bartz, M.L., & Palomares, M.L.D. 1993 Improved construction, parameti-
zation and interpretation of steady-state ecosystem models. In Christensen, V. & Pauly, D.
(eds) Trophic Models of Aquatic Ecosystems. ICLARM Publication, Manila, 390 pp.
Poiner, I., Glaister, J., Burridge, J., Pitcher, R., Wassenberg, T., Gribble, N., Hill, B., Blaber,
S., Brewer, D., & Ellis, N. 1998 Environmental Effects of Prawn Trawling on the Far
Northern Section of the Great Barrier Reef. Final report the Great Barrier Reef Marine
Park Authority and to the Fisheries Research and Development Corporation. CSIRO
Publication Vols. 1 and 2, Cleveland, 500 pp.
Polovina, J.J. 1984 Model of a coral reef ecosystem. I. The ECOPATH model and its applica-
tion to French Frigate Shoals. Coral Reefs 3, 1–11.
Randall, J.E., Allen, G.R., & Steene, R.C. 1990 Fishes of the Great Barrier Reef and Coral
Sea. University of Hawaii Press, Honolulu, 507 pp.
Roman, M.R., Furnas, M.J., & Mullin, M.M. 1990 Zooplankton abundance and grazing at
Daves Reef, Great Barrier Reef, Australia. Marine Biology 105, 73–82.
Salini, J.P., Blaber, S.J.M., & Brewer, D.T. 1990 Diets of piscivorous fishes in a tropical
Australian estuary, with special reference to predation on penaeid prawns. Marine
Biology 105, 363–374.
Salini, J.P., Blaber, S.J.M., & Brewer, D.T. 1992 Diets of sharks from estuaries and adjacent
waters of the north-eastern Gulf of Carpentaria, Australia. Australian Journal of Marine
and Freshwater Research 43, 87–96.
Salini, J.P., Brewer, D.T., & Blaber, S.J.M. 1998 Dietary studies on the predatory fishes of the
Norman River Estuary, with particular reference to penaeid prawns. Estuarine, Coastal
and Shelf Science 46/6, 837–847.
204 Oceanographic Processes of Coral Reefs
© 2001 by CRC Press LLC
Sorokin, Y.I. 1994 Role of plankton in the turnover of organic matter on the Great Barrier Reef,
Australia. Hydrobiologia 308, 35–44.
Walters, C., Pauly, D., & Christensen, V. 1998 Ecospace: Prediction of Meso-Scale Spatial
Patterns in Trophic Relationships of Exploited Ecosystems, with Emphasis on the Impacts
of Marine Protected Areas. ICES, Visualisation of Spatial data .CM 1998/S4. Cascais,
Portugal.
A Model of the Ecosystem and Associated Penaeid Prawn Community 205
© 2001 by CRC Press LLC
206 Oceanographic Processes of Coral Reefs
FIGURE 2 Example of trawl bycatch, comprising a
high proportion of small sea-bottom associated fish
(“fish omnivore”), a low proportion of large fish
(“large fish carnivore”), a sponge (“sessile animals”),
and a large sea turtle in the background.
FIGURE 3 Box diagram of the far northern GBR
lagoon and inter-reef ecosystem showing the major
groups, relative biomass of each group, and biomass
flows between groups.
FIGURE 1b Simulated study area used for
ECOSPACE spatial simulations of the effects of
trawling on the GBR ecosystem. (Land/islands area in
black, blue ϭ inner lagoon, light-green ϭ reef/shoal,
med-green ϭ inter-reef, dark-green ϭ offshore
lagoon.)
FIGURE 1a Map of Queensland showing the far
northern GBR study area. Dotted areas represent
shoals and submerged reefs.
a
b
FIGURE 4 Network analysis of the mixed trophic
impacts in the far northern GBR lagoon and inter-reef
ecosystem.
© 2001 by CRC Press LLC
A Model of the Ecosystem and Associated Penaeid Prawn Community 207
FIGURE 5 ECOSYM dynamic simulation of the
transient effect of varying trawl effort on the biomass
of the three major commercial prawn species.
FIGURE 6 ECOSYM dynamic simulation of a
100-year time-series effect on the three major
commercial prawn species to varying trawl effort.
FIGURE 7 ECOSYM simulation of the scenario of a
5% drop in trawl effort until 50% of current levels is
reached. (No spatial component to the temporal
simulation.)
FIGURE 8 ECOSPACE simulation of the effect of
spatially explicit habitat (see Figure 1b) on the
dynamic simulation of the scenario of a 5% drop in
trawl effort per year until 50% of current levels is
reached. Note: the rapid initial adjustment of the
ECOPATH biomass estimates for the spatial
distribution, then relatively smaller impact of the
change of trawl effort, due to the presence of offshore
spatial refugia.
ANIMATION 1 ECOSPACE simulation of the effect
of spatially explicit habitat (see Figure 1b) and areas
fished on the dynamic simulation of the scenario of a
5% drop in trawl effort per year until 50% of the
current level is reached. Upper left ϭ spatial
distribution of P. longistylus (red-spot king prawn);
upper right ϭ P. esculentus (tiger prawn); lower
left ϭ large sea turtles; lower right ϭ M. endeavouri
(endeavour prawn).
© 2001 by CRC Press LLC