principles of epidemiology in public health practice|_part2 pot
Bạn đang xem bản rút gọn của tài liệu. Xem và tải ngay bản đầy đủ của tài liệu tại đây (885.9 KB, 49 trang )
Introduction to Epidemiology
Page 1-38
Table 1.3 Reported Cases of SARS through November
3, 2004–United States, by Case Definition Category and
State of Residence
Location
Total
Cases
Reported
Total
Suspect
Cases
Reported
Total
Probable
Cases
Reported
Total
Confirmed
Cases
Reported
Alaska
1 1 0 0
California 29 22 5 2
Colorado 2 2 0 0
Florida 8 6 2 0
Georgia 3 3 0 0
Hawaii 1 1 0 0
Illinois 8 7 1 0
Kansas 1 1 0 0
Kentucky 6 4 2 0
Maryland 2 2 0 0
Massachusetts 8 8 0 0
Minnesota 1 1 0 0
Mississippi 1 0 1 0
Missouri 3 3 0 0
Nevada 3 3 0 0
New Jersey 2 1 0 1
New Mexico 1 0 0 1
New York 29 23 6 0
North Carolina 4 3 0 1
Ohio 2 2 0 0
Pennsylvania 6 5 0 1
Rhode Island 1 1 0 0
South Carolina 3 3 0 0
Tennessee 1 1 0 0
Texas 5 5 0 0
Utah 7 6 0 1
Vermont 1 1 0 0
Virginia 3 2 0 1
Washington 12 11 1 0
West Virginia 1 1 0 0
Wisconsin 2 1 1 0
Puerto Rico 1 1 0 0
Total 158 131 19 8
Adapted from: CDC. Severe Acute Respiratory Syndrome (SARS)
Report of Cases in the United States; Available from:
Table 1.4 Reported Cases of SARS through November
3, 2004–United States, by High-Risk Area Visited
Area Count* Percent
Hong Kong City, China
45 28
Toronto, Canada 35 22
Guangdong Province, China 34 22
Beijing City, China 25 16
Shanghai City, China 23 15
Singapore 15 9
China, mainland 15 9
Taiwan 10 6
Anhui Province, China 4 3
Hanoi, Vietnam 4 3
Chongqing City, China 3 2
Guizhou Province, China 2 1
Macoa City, China 2 1
Tianjin City, China 2 1
Jilin Province, China 2 1
Xinjiang Province 1 1
Zhejiang Province, China 1 1
Guangxi Province, China 1 1
Shanxi Province, China 1 1
Liaoning Province, China 1 1
Hunan Province, China 1 1
Sichuan Province, China 1 1
Hubei Province, China 1 1
Jiangxi Province, China 1 1
Fujian Province, China 1 1
Jiangsu Province, China 1 1
Yunnan Province, China 0 0
Hebei Province, China 0 0
Qinghai Province, China 0 0
Tibet (Xizang) Province, China 0 0
Hainan Province 0 0
Henan Province, China 0 0
Gansu Province, China 0 0
Shandong Province, China 0 0
* 158 reported case-patients visited 232 areas
Data Source: Heymann DL, Rodier G. Global Surveillance, National
Surveillance, and SARS. Emerg Infect Dis. 2004;10:173-175.
This is trial version
www.adultpdf.com
Introduction to Epidemiology
Page 1-39
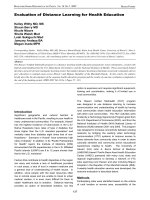
Although place data can be shown in a table such as Table 1.3 or
Table 1.4, a map provides a more striking visual display of place
data. On a map, different numbers or rates of disease can be
depicted using different shadings, colors, or line patterns, as in
Figure 1.11.
Figure 1.11 Mortality Rates for Asbestosis, by State, United States, 1968–1981 and 1982–2000
Source: Centers for Disease Control and Prevention. Changing patterns of pneumoconiosis mortality–United States, 1968-2000.
MMWR 2004;53:627-32.
Another type of map for place data is a spot map, such as Figure
1.12. Spot maps generally are used for clusters or outbreaks with a
limited number of cases. A dot or X is placed on the location that
is most relevant to the disease of interest, usually where each
victim lived or worked, just as John Snow did in his spot map of
the Golden Square area of London (Figure 1.1). If known, sites that
are relevant, such as probable locations of exposure (water pumps
in Figure 1.1), are usually noted on the map.
Figure 1.12 Spot Map of Giardia Cases
This is trial version
www.adultpdf.com
Introduction to Epidemiology
Page 1-40
Analyzing data by place can identify communities at increased risk
of disease. Even if the data cannot reveal why these people have an
increased risk, it can help generate hypotheses to test with
additional studies. For example, is a community at increased risk
because of characteristics of the people in the community such as
genetic susceptibility, lack of immunity, risky behaviors, or
exposure to local toxins or contaminated food? Can the increased
risk, particularly of a communicable disease, be attributed to
characteristics of the causative agent such as a particularly virulent
strain, hospitable breeding sites, or availability of the vector that
transmits the organism to humans? Or can the increased risk be
attributed to the environment that brings the agent and the host
together, such as crowding in urban areas that increases the risk of
disease transmission from person to person, or more homes being
built in wooded areas close to deer that carry ticks infected with
the organism that causes Lyme disease? (More techniques for
graphic presentation are discussed in Lesson 4.)
“Person” attributes include
age, sex, ethnicity/race, and
socioeconomic status.
Person
Because personal characteristics may affect illness, organization
and analysis of data by “person” may use inherent characteristics
of people (for example, age, sex, race), biologic characteristics
(immune status), acquired characteristics (marital status), activities
(occupation, leisure activities, use of medications/tobacco/drugs),
or the conditions under which they live (socioeconomic status,
access to medical care). Age and sex are included in almost all
data sets and are the two most commonly analyzed “person”
characteristics. However, depending on the disease and the data
available, analyses of other person variables are usually necessary.
Usually epidemiologists begin the analysis of person data by
looking at each variable separately. Sometimes, two variables such
as age and sex can be examined simultaneously. Person data are
usually displayed in tables or graphs.
Age. Age is probably the single most important “person” attribute,
because almost every health-related event varies with age. A
number of factors that also vary with age include: susceptibility,
opportunity for exposure, latency or incubation period of the
disease, and physiologic response (which affects, among other
things, disease development).
When analyzing data by age, epidemiologists try to use age groups
that are narrow enough to detect any age-related patterns that may
be present in the data. For some diseases, particularly chronic
diseases, 10-year age groups may be adequate. For other diseases,
10-year and even 5-year age groups conceal important variations in
disease occurrence by age. Consider the graph of pertussis
This is trial version
www.adultpdf.com
Introduction to Epidemiology
Page 1-41
occurrence by standard 5-year age groups shown in Figure 1.13a.
The highest rate is clearly among children 4 years old and younger.
But is the rate equally high in all children within that age group, or
do some children have higher rates than others?
Figure 1.13a Pertussis by 5-Year Age Groups Figure 1.13b Pertussis by <1, 4-Year, Then 5-Year
Age Groups
To answer this question, different age groups are needed. Examine
Figure 1.13b, which shows the same data but displays the rate of
pertussis for children under 1 year of age separately. Clearly,
infants account for most of the high rate among 0–4 year olds.
Public health efforts should thus be focused on children less than 1
year of age, rather than on the entire 5-year age group.
Sex. Males have higher rates of illness and death than do females
for many diseases. For some diseases, this sex-related difference is
because of genetic, hormonal, anatomic, or other inherent
differences between the sexes. These inherent differences affect
susceptibility or physiologic responses. For example,
premenopausal women have a lower risk of heart disease than men
of the same age. This difference has been attributed to higher
estrogen levels in women. On the other hand, the sex-related
differences in the occurrence of many diseases reflect differences
in opportunity or levels of exposure. For example, Figure 1.14
shows the differences in lung cancer rates over time among men
and women.
34
The difference noted in earlier years has been
attributed to the higher prevalence of smoking among men in the
past. Unfortunately, prevalence of smoking among women now
equals that among men, and lung cancer rates in women have been
climbing as a result.
35
This is trial version
www.adultpdf.com
Introduction to Epidemiology
Page 1-42
Figure 1.14 Lung Cancer Rates in the United States, 1930–1999
Data Source: American Cancer Society [Internet]. Atlanta: The American Cancer Society,
Inc. Available from: Cancer_
Statistics_2005_Presentation.asp.
Ethnic and racial groups. Sometimes epidemiologists are
interested in analyzing person data by biologic, cultural or social
groupings such as race, nationality, religion, or social groups such
as tribes and other geographically or socially isolated groups.
Differences in racial, ethnic, or other group variables may reflect
differences in susceptibility or exposure, or differences in other
factors that influence the risk of disease, such as socioeconomic
status and access to health care. In Figure 1.15, infant mortality
rates for 2002 are shown by race and Hispanic origin of the
mother.
This is trial version
www.adultpdf.com
Introduction to Epidemiology
Page 1-43
Figure 1.15 Infant Mortality Rates for 2002, by Race and Ethnicity of Mother
Source: Centers for Disease Control and Prevention. QuickStats: Infant mortality rates*, by selected racial/ethnic
populations—United States, 2002, MMWR 2005;54(05):126.
Socioeconomic status. Socioeconomic status is difficult to
quantify. It is made up of many variables such as occupation,
family income, educational achievement or census track, living
conditions, and social standing. The variables that are easiest to
measure may not accurately reflect the overall concept.
Nevertheless, epidemiologists commonly use occupation, family
income, and educational achievement, while recognizing that these
variables do not measure socioeconomic status precisely.
The frequency of many adverse health conditions increases with
decreasing socioeconomic status. For example, tuberculosis is
more common among persons in lower socioeconomic strata.
Infant mortality and time lost from work due to disability are both
associated with lower income. These patterns may reflect more
harmful exposures, lower resistance, and less access to health care.
Or they may in part reflect an interdependent relationship that is
impossible to untangle: Does low socioeconomic status contribute
to disability, or does disability contribute to lower socioeconomic
status, or both? What accounts for the disproportionate prevalence
of diabetes and asthma in lower socioeconomic areas?
36,37
A few adverse health conditions occur more frequently among
persons of higher socioeconomic status. Gout was known as the
“disease of kings” because of its association with consumption of
rich foods. Other conditions associated with higher socioeconomic
This is trial version
www.adultpdf.com
Introduction to Epidemiology
Page 1-44
status include breast cancer, Kawasaki syndrome, chronic fatigue
syndrome, and tennis elbow. Differences in exposure account for
at least some if not most of the differences in the frequency of
these conditions.
This is trial version
www.adultpdf.com
Introduction to Epidemiology
Page 1-45
Exercise 1.6
Using the data in Tables 1.5 and 1.6, describe the death rate patterns for
the “Unusual Event.” For example, how do death rates vary between men
and women overall, among the different socioeconomic classes, among
men and women in different socioeconomic classes, and among adults and
children in different socioeconomic classes? Can you guess what type of situation might
result in such death rate patterns?
Table 1.5 Deaths and Death Rates for an Unusual Event, by Sex and Socioeconomic Status
Socioeconomic Status
Sex Measure High Middle Low Total
Males Persons at risk 179 173 499 851
Deaths 120 148 441 709
Death rate (%) 67.0% 85.5% 88.4% 83.3%
Females Persons at risk 143 107 212 462
Deaths 9 13 132 154
Death rate (%) 6.3% 12.6% 62.3% 33.3%
Both sexes Persons at risk 322 280 711 1313
Deaths 129 161 573 863
Death rate (%) 40.1% 57.5% 80.6% 65.7%
Table 1.6 Deaths and Death Rates for an Unusual Event, by Age and
Socioeconomic Status
Socioeconomic Status
Age Group Measure High/Middle Low Total
Adults Persons at risk 566 664 1230
Deaths 287 545 832
Death rate (%) 50.7% 82.1% 67.6%
Children Persons at risk 36 47 83
Deaths 3 28 31
Death rate (%) 8.3% 59.6% 37.3%
All Ages Persons at risk 602 711 1313
Deaths 290 573 863
Death rate (%) 48.2% 80.6% 65.7%
Check your answers on page 1-82
This is trial version
www.adultpdf.com
Introduction to Epidemiology
Page 1-46
Analytic Epidemiology
As noted earlier, descriptive epidemiology can identify patterns
among cases and in populations by time, place and person. From
these observations, epidemiologists develop hypotheses about the
causes of these patterns and about the factors that increase risk of
disease. In other words, epidemiologists can use descriptive
epidemiology to generate hypotheses, but only rarely to test those
hypotheses. For that, epidemiologists must turn to analytic
epidemiology.
Key feature of analytic
epidemiology =
Comparison group
The key feature of analytic epidemiology is a comparison group.
Consider a large outbreak of hepatitis A that occurred in
Pennsylvania in 2003.
38
Investigators found almost all of the case-
patients had eaten at a particular restaurant during the 2–6 weeks
(i.e., the typical incubation period for hepatitis A) before onset of
illness. While the investigators were able to narrow down their
hypotheses to the restaurant and were able to exclude the food
preparers and servers as the source, they did not know which
particular food may have been contaminated. The investigators
asked the case-patients which restaurant foods they had eaten, but
that only indicated which foods were popular. The investigators,
therefore, also enrolled and interviewed a comparison or control
group — a group of persons who had eaten at the restaurant during
the same period but who did not get sick. Of 133 items on the
restaurant’s menu, the most striking difference between the case
and control groups was in the proportion that ate salsa (94% of
case-patients ate, compared with 39% of controls). Further
investigation of the ingredients in the salsa implicated green onions
as the source of infection. Shortly thereafter, the Food and Drug
Administration issued an advisory to the public about green onions
and risk of hepatitis A. This action was in direct response to the
convincing results of the analytic epidemiology, which compared
the exposure history of case-patients with that of an appropriate
comparison group.
When investigators find that persons with a particular
characteristic are more likely than those without the characteristic
to contract a disease, the characteristic is said to be associated with
the disease. The characteristic may be a:
• Demographic factor such as age, race, or sex;
• Constitutional factor such as blood group or immune status;
• Behavior or act such as smoking or having eaten salsa; or
• Circumstance such as living near a toxic waste site.
Identifying factors associated with disease help health officials
This is trial version
www.adultpdf.com
Introduction to Epidemiology
Page 1-47
appropriately target public health prevention and control activities.
It also guides additional research into the causes of disease.
Thus, analytic epidemiology is concerned with the search for
causes and effects, or the why and the how. Epidemiologists use
analytic epidemiology to quantify the association between
exposures and outcomes and to test hypotheses about causal
relationships. It has been said that epidemiology by itself can never
prove that a particular exposure caused a particular outcome.
Often, however, epidemiology provides sufficient evidence to take
appropriate control and prevention measures.
Epidemiologic studies fall into two categories: experimental and
observational.
Experimental studies
In an experimental study, the investigator determines through a
controlled process the exposure for each individual (clinical trial)
or community (community trial), and then tracks the individuals or
communities over time to detect the effects of the exposure. For
example, in a clinical trial of a new vaccine, the investigator may
randomly assign some of the participants to receive the new
vaccine, while others receive a placebo shot. The investigator then
tracks all participants, observes who gets the disease that the new
vaccine is intended to prevent, and compares the two groups (new
vaccine vs. placebo) to see whether the vaccine group has a lower
rate of disease. Similarly, in a trial to prevent onset of diabetes
among high-risk individuals, investigators randomly assigned
enrollees to one of three groups — placebo, an anti-diabetes drug,
or lifestyle intervention. At the end of the follow-up period,
investigators found the lowest incidence of diabetes in the lifestyle
intervention group, the next lowest in the anti-diabetic drug group,
and the highest in the placebo group.
39
Observational studies
In an observational study, the epidemiologist simply observes the
exposure and disease status of each study participant. John Snow’s
studies of cholera in London were observational studies. The two
most common types of observational studies are cohort studies and
case-control studies; a third type is cross-sectional studies.
Cohort study. A cohort study is similar in concept to the
experimental study. In a cohort study the epidemiologist records
whether each study participant is exposed or not, and then tracks
the participants to see if they develop the disease of interest. Note
that this differs from an experimental study because, in a cohort
This is trial version
www.adultpdf.com
Introduction to Epidemiology
Page 1-48
study, the investigator observes rather than determines the
participants’ exposure status. After a period of time, the
investigator compares the disease rate in the exposed group with
the disease rate in the unexposed group. The unexposed group
serves as the comparison group, providing an estimate of the
baseline or expected amount of disease occurrence in the
community. If the disease rate is substantively different in the
exposed group compared to the unexposed group, the exposure is
said to be associated with illness.
The length of follow-up varies considerably. In an attempt to
respond quickly to a public health concern such as an outbreak,
public health departments tend to conduct relatively brief studies.
On the other hand, research and academic organizations are more
likely to conduct studies of cancer, cardiovascular disease, and
other chronic diseases which may last for years and even decades.
The Framingham study is a well-known cohort study that has
followed over 5,000 residents of Framingham, Massachusetts,
since the early 1950s to establish the rates and risk factors for heart
disease.
7
The Nurses Health Study and the Nurses Health Study II
are cohort studies established in 1976 and 1989, respectively, that
have followed over 100,000 nurses each and have provided useful
information on oral contraceptives, diet, and lifestyle risk factors.
40
These studies are sometimes called follow-up or prospective
cohort studies, because participants are enrolled as the study begins
and are then followed prospectively over time to identify
occurrence of the outcomes of interest.
An alternative type of cohort study is a retrospective cohort study.
In this type of study both the exposure and the outcomes have
already occurred. Just as in a prospective cohort study, the
investigator calculates and compares rates of disease in the
exposed and unexposed groups. Retrospective cohort studies are
commonly used in investigations of disease in groups of easily
identified people such as workers at a particular factory or
attendees at a wedding. For example, a retrospective cohort study
was used to determine the source of infection of cyclosporiasis, a
parasitic disease that caused an outbreak among members of a
residential facility in Pennsylvania in 2004.
41
The investigation
indicated that consumption of snow peas was implicated as the
vehicle of the cyclosporiasis outbreak.
Case-control study. In a case-control study, investigators start by
enrolling a group of people with disease (at CDC such persons are
called case-patients rather than cases, because case refers to
occurrence of disease, not a person). As a comparison group, the
This is trial version
www.adultpdf.com
Introduction to Epidemiology
Page 1-49
investigator then enrolls a group of people without disease
(controls). Investigators then compare previous exposures between
the two groups. The control group provides an estimate of the
baseline or expected amount of exposure in that population. If the
amount of exposure among the case group is substantially higher
than the amount you would expect based on the control group, then
illness is said to be associated with that exposure. The study of
hepatitis A traced to green onions, described above, is an example
of a case-control study. The key in a case-control study is to
identify an appropriate control group, comparable to the case group
in most respects, in order to provide a reasonable estimate of the
baseline or expected exposure.
Cross-sectional study. In this third type of observational study, a
sample of persons from a population is enrolled and their
exposures and health outcomes are measured simultaneously. The
cross-sectional study tends to assess the presence (prevalence) of
the health outcome at that point of time without regard to duration.
For example, in a cross-sectional study of diabetes, some of the
enrollees with diabetes may have lived with their diabetes for
many years, while others may have been recently diagnosed.
From an analytic viewpoint the cross-sectional study is weaker
than either a cohort or a case-control study because a cross-
sectional study usually cannot disentangle risk factors for
occurrence of disease (incidence) from risk factors for survival
with the disease. (Incidence and prevalence are discussed in more
detail in Lesson 3.) On the other hand, a cross-sectional study is a
perfectly fine tool for descriptive epidemiology purposes. Cross-
sectional studies are used routinely to document the prevalence in a
community of health behaviors (prevalence of smoking), health
states (prevalence of vaccination against measles), and health
outcomes, particularly chronic conditions (hypertension, diabetes).
In summary, the purpose of an analytic study in epidemiology is to
identify and quantify the relationship between an exposure and a
health outcome. The hallmark of such a study is the presence of at
least two groups, one of which serves as a comparison group. In an
experimental study, the investigator determines the exposure for
the study subjects; in an observational study, the subjects are
exposed under more natural conditions. In an observational cohort
study, subjects are enrolled or grouped on the basis of their
exposure, then are followed to document occurrence of disease.
Differences in disease rates between the exposed and unexposed
groups lead investigators to conclude that exposure is associated
with disease. In an observational case-control study, subjects are
This is trial version
www.adultpdf.com
Introduction to Epidemiology
Page 1-50
enrolled according to whether they have the disease or not, then are
questioned or tested to determine their prior exposure. Differences
in exposure prevalence between the case and control groups allow
investigators to conclude that the exposure is associated with the
disease. Cross-sectional studies measure exposure and disease
status at the same time, and are better suited to descriptive
epidemiology than causation.
This is trial version
www.adultpdf.com
Introduction to Epidemiology
Page 1-51
Exercise 1.7
Classify each of the following studies as:
A. Experimental
B. Observational cohort
C. Observational case-control
D. Observational cross-sectional
E. Not an analytical or epidemiologic study
__________ 1. Representative sample of residents were telephoned and asked how much
they exercise each week and whether they currently have (have ever been
diagnosed with) heart disease.
__________ 2. Occurrence of cancer was identified between April 1991 and July 2002 for
50,000 troops who served in the first Gulf War (ended April 1991) and
50,000 troops who served elsewhere during the same period.
__________ 3. Persons diagnosed with new-onset Lyme disease were asked how often
they walk through woods, use insect repellant, wear short sleeves and
pants, etc. Twice as many patients without Lyme disease from the same
physician’s practice were asked the same questions, and the responses in
the two groups were compared.
__________ 4. Subjects were children enrolled in a health maintenance organization. At
2 months, each child was randomly given one of two types of a new
vaccine against rotavirus infection. Parents were called by a nurse two
weeks later and asked whether the children had experienced any of a list
of side-effects.
Check your answers on page 1-83
This is trial version
www.adultpdf.com
Introduction to Epidemiology
Page 1-52
Concepts of Disease Occurrence
A critical premise of epidemiology is that disease and other health
events do not occur randomly in a population, but are more likely
to occur in some members of the population than others because of
risk factors that may not be distributed randomly in the population.
As noted earlier, one important use of epidemiology is to identify
the factors that place some members at greater risk than others.
Causation
A number of models of disease causation have been proposed.
Among the simplest of these is the epidemiologic triad or triangle,
the traditional model for infectious disease. The triad consists of
an external agent, a susceptible host, and an environment that
brings the host and agent together. In this model, disease results
from the interaction between the agent and the susceptible host in
an environment that supports transmission of the agent from a
source to that host. Two ways of depicting this model are shown in
Figure 1.16.
Agent, host, and environmental factors interrelate in a variety of
complex ways to produce disease. Different diseases require
different balances and interactions of these three components.
Development of appropriate, practical, and effective public health
measures to control or prevent disease usually requires assessment
of all three components and their interactions.
Figure 1.16 Epidemiologic Triad
Agent originally referred to an infectious microorganism or
pathogen: a virus, bacterium, parasite, or other microbe. Generally,
the agent must be present for disease to occur; however, presence
of that agent alone is not always sufficient to cause disease. A
variety of factors influence whether exposure to an organism will
result in disease, including the organism’s pathogenicity (ability to
cause disease) and dose.
This is trial version
www.adultpdf.com
Introduction to Epidemiology
Page 1-53
Over time, the concept of agent has been broadened to include
chemical and physical causes of disease or injury. These include
chemical contaminants (such as the L-tryptophan contaminant
responsible for eosinophilia-myalgia syndrome), as well as
physical forces (such as repetitive mechanical forces associated
with carpal tunnel syndrome). While the epidemiologic triad serves
as a useful model for many diseases, it has proven inadequate for
cardiovascular disease, cancer, and other diseases that appear to
have multiple contributing causes without a single necessary one.
Host refers to the human who can get the disease. A variety of
factors intrinsic to the host, sometimes called risk factors, can
influence an individual’s exposure, susceptibility, or response to a
causative agent. Opportunities for exposure are often influenced by
behaviors such as sexual practices, hygiene, and other personal
choices as well as by age and sex. Susceptibility and response to an
agent are influenced by factors such as genetic composition,
nutritional and immunologic status, anatomic structure, presence of
disease or medications, and psychological makeup.
Environment refers to extrinsic factors that affect the agent and
the opportunity for exposure. Environmental factors include
physical factors such as geology and climate, biologic factors such
as insects that transmit the agent, and socioeconomic factors such
as crowding, sanitation, and the availability of health services.
Component causes and causal pies
Because the agent-host-environment model did not work well for
many non-infectious diseases, several other models that attempt to
account for the multifactorial nature of causation have been
proposed. One such model was proposed by Rothman in 1976, and
has come to be known as the Causal Pies.
42
This model is
illustrated in Figure 1.17. An individual factor that contributes to
cause disease is shown as a piece of a pie. After all the pieces of a
pie fall into place, the pie is complete — and disease occurs. The
individual factors are called component causes. The complete pie,
which might be considered a causal pathway, is called a sufficient
cause. A disease may have more than one sufficient cause, with
each sufficient cause being composed of several component causes
that may or may not overlap. A component that appears in every
pie or pathway is called a necessary cause, because without it,
disease does not occur. Note in Figure 1.17 that component cause
A is a necessary cause because it appears in every pie.
This is trial version
www.adultpdf.com
Introduction to Epidemiology
Page 1-54
Figure 1.17 Rothman’s Causal Pies
Source: Rothman KJ. Causes. Am J Epidemiol 1976;104:587-592.
The component causes may include intrinsic host factors as well as
the agent and the environmental factors of the agent-host-
environment triad. A single component cause is rarely a sufficient
cause by itself. For example, even exposure to a highly infectious
agent such as measles virus does not invariably result in measles
disease. Host susceptibility and other host factors also may play a
role.
At the other extreme, an agent that is usually harmless in healthy
persons may cause devastating disease under different conditions.
Pneumocystis carinii is an organism that harmlessly colonizes the
respiratory tract of some healthy persons, but can cause potentially
lethal pneumonia in persons whose immune systems have been
weakened by human immunodeficiency virus (HIV). Presence of
Pneumocystis carinii organisms is therefore a necessary but not
sufficient cause of pneumocystis pneumonia. In Figure 1.17, it
would be represented by component cause A.
As the model indicates, a particular disease may result from a
variety of different sufficient causes or pathways. For example,
lung cancer may result from a sufficient cause that includes
smoking as a component cause. Smoking is not a sufficient cause
by itself, however, because not all smokers develop lung cancer.
Neither is smoking a necessary cause, because a small fraction of
lung cancer victims have never smoked. Suppose Component
Cause B is smoking and Component Cause C is asbestos.
Sufficient Cause I includes both smoking (B) and asbestos (C).
Sufficient Cause II includes asbestos without smoking, and
Sufficient Cause C includes smoking without asbestos. But
because lung cancer can develop in persons who have never been
exposed to either smoking or asbestos, a proper model for lung
cancer would have to show at least one more Sufficient Cause Pie
that does not include either component B or component C.
This is trial version
www.adultpdf.com
Introduction to Epidemiology
Page 1-55
Note that public health action does not depend on the identification
of every component cause. Disease prevention can be
accomplished by blocking any single component of a sufficient
cause, at least through that pathway. For example, elimination of
smoking (component B) would prevent lung cancer from sufficient
causes I and II, although some lung cancer would still occur
through sufficient cause III.
This is trial version
www.adultpdf.com
Introduction to Epidemiology
Page 1-56
Exercise 1.8
Read the Anthrax Fact Sheet on the following 2 pages, then answer the
questions below.
1. Describe its causation in terms of agent, host, and environment.
a. Agent:
b. Host:
c. Environment:
2. For each of the following risk factors and health outcomes, identify whether they are
necessary causes, sufficient causes, or component causes.
Risk Factor Health Outcome
____________ a. Hypertension Stroke
____________ b. Treponema pallidum Syphilis
____________ c. Type A personality Heart disease
____________ d. Skin contact with a strong acid Burn
Check your answers on page 1-83
This is trial version
www.adultpdf.com
Introduction to Epidemiology
Page 1-57
Anthrax Fact Sheet
What is anthrax?
Anthrax is an acute infectious disease that usually occurs in animals such as livestock, but can also affect humans.
Human anthrax comes in three forms, depending on the route of infection: cutaneous (skin) anthrax, inhalation
anthrax, and intestinal anthrax. Symptoms usually occur within 7 days after exposure.
Cutaneous: Most (about 95%) anthrax infections occur when the bacterium enters a cut or abrasion on the skin after
handling infected livestock or contaminated animal products. Skin infection begins as a raised itchy bump that
resembles an insect bite but within 1-2 days develops into a vesicle and then a painless ulcer, usually 1-3 cm
in diameter, with a characteristic black necrotic (dying) area in the center. Lymph glands in the adjacent area
may swell. About 20% of untreated cases of cutaneous anthrax will result in death. Deaths are rare with
appropriate antimicrobial therapy.
Inhalation: Initial symptoms are like cold or flu symptoms and can include a sore throat, mild fever, and muscle
aches. After several days, the symptoms may progress to cough, chest discomfort, severe breathing problems
and shock. Inhalation anthrax is often fatal. Eleven of the mail-related cases were inhalation; 5 (45%) of the
11 patients died.
Intestinal: Initial signs of nausea, loss of appetite, vomiting, and fever are followed by abdominal pain, vomiting of
blood, and severe diarrhea. Intestinal anthrax results in death in 25% to 60% of cases.
While most human cases of anthrax result from contact with infected animals or contaminated animal products,
anthrax also can be used as a biologic weapon. In 1979, dozens of residents of Sverdlovsk in the former Soviet Union
are thought to have died of inhalation anthrax after an unintentional release of an aerosol from a biologic weapons
facility. In 2001, 22 cases of anthrax occurred in the United States from letters containing anthrax spores that were
mailed to members of Congress, television networks, and newspaper companies.
What causes anthrax?
Anthrax is caused by the bacterium
Bacillus anthracis
. The anthrax bacterium forms a protective shell called a spore.
B. anthracis spores are found naturally in soil, and can survive for many years.
How is anthrax diagnosed?
Anthrax is diagnosed by isolating
B. anthracis
from the blood, skin lesions, or respiratory secretions or by measuring
specific antibodies in the blood of persons with suspected cases.
Is there a treatment for anthrax?
Antibiotics are used to treat all three types of anthrax. Treatment should be initiated early because the disease is
more likely to be fatal if treatment is delayed or not given at all.
How common is anthrax and where is it found?
Anthrax is most common in agricultural regions of South and Central America, Southern and Eastern Europe, Asia,
Africa, the Caribbean, and the Middle East, where it occurs in animals. When anthrax affects humans, it is usually the
result of an occupational exposure to infected animals or their products. Naturally occurring anthrax is rare in the
United States (28 reported cases between 1971 and 2000), but 22 mail-related cases were identified in 2001.
Infections occur most commonly in wild and domestic lower vertebrates (cattle, sheep, goats, camels, antelopes, and
other herbivores), but it can also occur in humans when they are exposed to infected animals or tissue from infected
animals.
How is anthrax transmitted?
Anthrax can infect a person in three ways: by anthrax spores entering through a break in the skin, by inhaling
anthrax spores, or by eating contaminate, undercooked meat. Anthrax is not spread from person to person. The skin
(“cutaneous”) form of anthrax is usually the result of contact with infected livestock, wild animals, or contaminated
animal products such as carcasses, hides, hair, wool, meat, or bone meal. The inhalation form is from breathing in
spores from the same sources. Anthrax can also be spread as a bioterrorist agent.
This is trial version
www.adultpdf.com
Introduction to Epidemiology
Page 1-58
Anthrax Fact Sheet (Continued)
Who has an increased risk of being exposed to anthrax?
Susceptibility to anthrax is universal. Most naturally occurring anthrax affects people whose work brings them into
contact with livestock or products from livestock. Such occupations include veterinarians, animal handlers, abattoir
workers, and laboratorians. Inhalation anthrax was once called Woolsorter’s Disease because workers who inhaled
spores from contaminated wool before it was cleaned developed the disease. Soldiers and other potential targets of
bioterrorist anthrax attacks might also be considered at increased risk.
Is there a way to prevent infection?
In countries where anthrax is common and vaccination levels of animal herds are low, humans should avoid contact
with livestock and animal products and avoid eating meat that has not been properly slaughtered and cooked. Also,
an anthrax vaccine has been licensed for use in humans. It is reported to be 93% effective in protecting against
anthrax. It is used by veterinarians, laboratorians, soldiers, and others who may be at increased risk of exposure, but
is not available to the general public at this time.
For a person who has been exposed to anthrax but is not yet sick, antibiotics combined with anthrax vaccine are
used to prevent illness.
Sources: Centers for Disease Control and Prevention [Internet]. Atlanta: Anthrax. Available from:
and Anthrax Public Health Fact Sheet, Mass. Dept. of Public Health,
August 2002.
This is trial version
www.adultpdf.com
Introduction to Epidemiology
Page 1-59
Natural History and Spectrum of Disease
Natural history of disease refers to the progression of a disease
process in an individual over time, in the absence of treatment. For
example, untreated infection with HIV causes a spectrum of
clinical problems beginning at the time of seroconversion (primary
HIV) and terminating with AIDS and usually death. It is now
recognized that it may take 10 years or more for AIDS to develop
after seroconversion.
43
Many, if not most, diseases have a
characteristic natural history, although the time frame and specific
manifestations of disease may vary from individual to individual
and are influenced by preventive and therapeutic measures.
Figure 1.18 Natural History of Disease Timeline
Source: Centers for Disease Control and Prevention. Principles of epidemiology, 2
nd
ed.
Atlanta: U.S. Department of Health and Human Services;1992.
The process begins with the appropriate exposure to or
accumulation of factors sufficient for the disease process to begin
in a susceptible host. For an infectious disease, the exposure is a
microorganism. For cancer, the exposure may be a factor that
initiates the process, such as asbestos fibers or components in
tobacco smoke (for lung cancer), or one that promotes the process,
such as estrogen (for endometrial cancer).
After the disease process has been triggered, pathological changes
then occur without the individual being aware of them. This stage
of subclinical disease, extending from the time of exposure to
onset of disease symptoms, is usually called the incubation period
for infectious diseases, and the latency period for chronic
diseases. During this stage, disease is said to be asymptomatic (no
symptoms) or inapparent. This period may be as brief as seconds
for hypersensitivity and toxic reactions to as long as decades for
certain chronic diseases. Even for a single disease, the
characteristic incubation period has a range. For example, the
typical incubation period for hepatitis A is as long as 7 weeks. The
This is trial version
www.adultpdf.com
Introduction to Epidemiology
Page 1-60
latency period for leukemia to become evident among survivors of
the atomic bomb blast in Hiroshima ranged from 2 to 12 years,
peaking at 6-7 years.
44
Incubation periods of selected exposures
and diseases varying from minutes to decades are displayed in
Table 1.7.
Table 1.7 Incubation Periods of Selected Exposures and Diseases
Exposure Clinical Effect Incubation/Latency Period
Saxitoxin and similar Paralytic shellfish poisoning few minutes-30 minutes
toxins from shellfish (tingling, numbness around lips
and fingertips, giddiness,
incoherent speech,
respiratory paralysis,
sometimes death)
Organophosphorus Nausea, vomiting, cramps, few minutes-few hours
ingestion headache, nervousness,
blurred vision, chest pain,
confusion, twitching,
convulsions
Salmonella
Diarrhea, often with fever and cramps usually 6–48 hours
SARS-associated Severe Acute Respiratory
corona virus Syndrome (SARS) 3–10 days, usually 4–6 days
Varicella-zoster virus Chickenpox 10–21 days, usually 14–16 days
Treponema pallidum
Syphilis 10–90 days, usually 3 weeks
Hepatitis A virus Hepatitis 14–50 days, average 4 weeks
Hepatitis B virus Hepatitis 50–180 days, usually 2–3 months
Human immunodeficiency virus AIDS <1 to 15+ years
Atomic bomb radiation (Japan) Leukemia 2–12 years
Radiation (Japan, Chernobyl) Thyroid cancer 3–20+ years
Radium (watch dial painters) Bone cancer 8–40 years
Although disease is not apparent during the incubation period,
some pathologic changes may be detectable with laboratory,
radiographic, or other screening methods. Most screening
programs attempt to identify the disease process during this phase
of its natural history, since intervention at this early stage is likely
to be more effective than treatment given after the disease has
progressed and become symptomatic.
The onset of symptoms marks the transition from subclinical to
clinical disease. Most diagnoses are made during the stage of
clinical disease. In some people, however, the disease process may
This is trial version
www.adultpdf.com
Introduction to Epidemiology
Page 1-61
never progress to clinically apparent illness. In others, the disease
process may result in illness that ranges from mild to severe or
fatal. This range is called the spectrum of disease. Ultimately, the
disease process ends either in recovery, disability or death.
For an infectious agent, infectivity refers to the proportion of
exposed persons who become infected. Pathogenicity refers to the
proportion of infected individuals who develop clinically apparent
disease. Virulence refers to the proportion of clinically apparent
cases that are severe or fatal.
Because the spectrum of disease can include asymptomatic and
mild cases, the cases of illness diagnosed by clinicians in the
community often represent only the tip of the iceberg. Many
additional cases may be too early to diagnose or may never
progress to the clinical stage. Unfortunately, persons with
inapparent or undiagnosed infections may nonetheless be able to
transmit infection to others. Such persons who are infectious but
have subclinical disease are called carriers. Frequently, carriers
are persons with incubating disease or inapparent infection.
Persons with measles, hepatitis A, and several other diseases
become infectious a few days before the onset of symptoms.
However carriers may also be persons who appear to have
recovered from their clinical illness but remain infectious, such as
chronic carriers of hepatitis B virus, or persons who never
exhibited symptoms. The challenge to public health workers is that
these carriers, unaware that they are infected and infectious to
others, are sometimes more likely to unwittingly spread infection
than are people with obvious illness.
This is trial version
www.adultpdf.com
Introduction to Epidemiology
Page 1-62
Chain of Infection
As described above, the traditional epidemiologic triad model
holds that infectious diseases result from the interaction of agent,
host, and environment. More specifically, transmission occurs
when the agent leaves its reservoir or host through a portal of
exit, is conveyed by some mode of transmission, and enters
through an appropriate portal of entry to infect a susceptible
host. This sequence is sometimes called the chain of infection.
Figure 1.19 Chain of Infection
Source: Centers for Disease Control and Prevention. Principles of epidemiology, 2
nd
ed.
Atlanta: U.S. Department of Health and Human Services;1992.
Reservoir
The reservoir of an infectious agent is the habitat in which the
agent normally lives, grows, and multiplies. Reservoirs include
humans, animals, and the environment. The reservoir may or may
not be the source from which an agent is transferred to a host. For
example, the reservoir of Clostridium botulinum is soil, but the
source of most botulism infections is improperly canned food
containing C. botulinum spores.
Human reservoirs. Many common infectious diseases have human
reservoirs. Diseases that are transmitted from person to person
without intermediaries include the sexually transmitted diseases,
measles, mumps, streptococcal infection, and many respiratory
pathogens. Because humans were the only reservoir for the
smallpox virus, naturally occurring smallpox was eradicated after
the last human case was identified and isolated.
8
This is trial version
www.adultpdf.com