The Hands-on Guide for Science Communicators - L. Christensen (Springer 2007) Episode 6 ppsx
Bạn đang xem bản rút gọn của tài liệu. Xem và tải ngay bản đầy đủ của tài liệu tại đây (1.15 MB, 20 trang )
95
12. DISTRIBUTION
Many different methods for the distribution of science communication
products can be chosen to fi ght the “battle to be heard” a nd several
of them are often employed in parallel. Some of the most commonly
used are:
Direct mailing of physical materials.
Email distribution lists: Create y our own lists as well as using
external ones.
Web distribution (a lso discussed in sections 6.4 and 13.3): Near-
ly all products need to be available on the web. The web is un-
beatable as a repository tool and offers 24-7 availability.
Distribution via third-party partners: S uch as press release por-
tals, v ideo portals (v ortals) or external companies that sell your
products (for the latter see section 20.1).
Press conferences (see chapter 18).
Networking: The personal contact between journalists and sci-
entists/PIOs will always work better than more or less anony-
mously distributed paper and electronic products.
T he preferred method in a given situation depends on the target groups,
the products and past experience. Some means of distribution have a
high cost per person reached, some lower costs. Some are very push-
oriented, s ome rely more on the target group pulling ma terial from the
EPO offi ce after the contact has been made. Some methods are under
the full control of the EPO offi ce, some methods rely on a third-party.
Speed varies immensely between methods.
Mediators (s ee also chapter 5), including the news media, teachers,
scientists and amateurs are vital for the distribution process as they
help to disseminate communication products directly, thereby acting
as a link between communicators an d consumers. C ommunicators
need these amplifying outlets to reach a larger audience. Apart from
increasing the numbers reached, mediators can infl uence how much
the communication can touch or teach the individual directly. Commu-
nicators can inspire interest and thereby raise public awareness ab out
science, but understanding ta kes more effort and the time-consuming
efforts of mediators such as teachers and lecturers are extremely valu-
able in this regard.
Distribution is — perhaps apart from the actual production process
— the most important link in the production chain, b ut often not
enough effort is put into this area. There may be many different rea-
sons for this:
It is fairly time consuming to build, and not least, to update,
a large and consistent address database of recipients for the
products.
Distribution and promotion are rather close to what is known
elsewhere in society as “selling”, and it is perhaps diffi cult for an
EPO offi ce to accept that it is necessary to “sell” scientifi c results.
•
•
•
•
•
•
•
•
DISTRIBUTION
T he preferred method
of distribution in a
given situation depends
on the target groups,
the products and past
experience.
96
THE HANDS-ON GUIDE FOR SCIENCE COMMUNICATORS
But it is! Today there is such fi erce competition wi th other news
and content providers that we have to follow suit.
There may be internal obstacles in the organisation that prevent
an effective and at times aggressive distribution.
12.1 THE PRESS RELEASE VISIBILITY SCALE
Whe n publishing or distributing a given science result, an organisa-
tion can choose different “levels of effort” in the distribution process
according to the importance of the given result. Here we illustrate this
by listing the different distribution methods on a press release visibility
sc ale consisting of seven steps with magnitude 7 being the highest
level of effort an organisation can put into communicating a result
(details below). If too high a level of effort is chosen relative to the sto-
ry’s science importance, credibility problems may occur (Nelkin, 1995,
p. 161). The higher the level of effort the more solid the science case
and the evidence have to be. Equally, the higher the level of effort the
greater the need for a retraction if the science is later proven wrong
— and the actual retraction should have a commensurate visibility
(Ni elsen et al, 2006). NASA’s g uidelines and practices for media efforts
follow a similar scale (Space Telescope Science Institute, 2005; Watzke
& Arcand, 2005).
It is important to note that the press release visibility scale only de-
scribes the level of effort chosen by PIOs to emphasise a given press
release, and not the level of attention the given press release will actu-
ally receive in the media. However the level of communication efforts
and the level of media attention are closely correlated — although not
in a direct one to one relationship. A beautiful astronomical photo re-
lease (mag nitude 2) may occasionally get just as much press attention
•
Figure 33: If only a parcel
could speak… This image
illustrates some of the
problems with distribution.
The parcel came back
somewhat the worse for
wear from Egypt after 4
months (!) due to delivery
problems. Handling mass
mailing distribution of
physical products certainly
takes great effort.
Whe n publishing or
distributing a given
science result, an
organisation can choose
different “levels of
effort” in the distribution
process according to the
importance of the given
result.
97
as a live televised press conference on something of a more technical
nature (magnitude 6).
The number of images/animations in the press packs of press releases,
together with distribution restrictions such as whether the given news
is embargoed or not, can affect the visibility to a minor degree. Science
news will not be broadcast on television unless the news is released
with video clips. However, the size of the press package tends to grow
the higher the release is on the press release visibility scale.
Magnitude 7 — Live televised press conference with presence of a high
ranking political fi gure
A live televised press conference with the presence of or statements
from a major political fi gure is the highest communication effort that
can be put into a press release for major scientifi c discoveries. As an
example, when (NASA, 1996) announced they had found “evidence that
strongly suggests primitive life may have existed on Mars”, President Bill
Clinton stat ed la ter the same day, that:
“If this discovery is confi rmed, it will surely be one of the
most stunning insights into our Universe that science has
ever uncovered”.
The White House (1996)
Only major scientifi c discoveries are endorsed by politicians, whose
presence will pull the media in even more strongly. Normally the news
will be based on an accepted peer reviewed paper to be published in a
prominent science journal like Science or N ature.
DISTRIBUTION
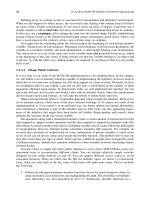
Figure 34: The press release
visibility scale.
Magnitude 1: Web-only posting
Magnitude 2: Photo release
Magnitude 3: Press release
Magnitude 4: Media teleconference
Magnitude 5: Press conference
Magnitude 6: Live televised press conference
Magnitude 7:
Live televised press conference with
presence of a high ranking political figure
The Press Release Visibility Scale
98
THE HANDS-ON GUIDE FOR SCIENCE COMMUNICATORS
Mag nitude 6 — Live televised press conference
If a result is released via a live televised press conference this effort tells
journalists that the scientifi c institution believes the scientifi c fi nding
is of major importance.
Magnitude 5 — Press conference
Press conferences tha t are not televised live are likely to receive less
attention than their live televised counterpart, mainly because they
require journalists to gather in person in one place. As with the live
televised press conferences, the science news will normally be based
on a paper to be published in a prominent science journal: press confer-
ences at scientifi c conferences are the exception.
Magnitude 4 — Media tele-conference
A media tele-conference rele ases science news representing major sci-
entifi c discoveries to the press. A scientist will give a presentation and
journalists may ask questions afterwards (similar to real press confer-
ences, see chapter 18). The media tele-conference allows journalists to
be in close contact with the scientist without having to travel. The news
is also based on an accepted peer reviewed paper that will typically be
published in a prominent science journal.
Magnitude 3 — Press release
Press releases are the most frequently used way of communicating
science news that represents a scientifi c discovery of signifi cant im-
portance to the general public. Press releases are sent out via distribu-
tion lists that cover hundreds of journalists and news media. However
journalists are fl ooded with press releases everyday, all competing to
get page space, and this makes it important that a press release catches
the attention of journalists in the headline. If a wire service picks up a
press release many local newspapers will pick the up the story. Most
often an accepted peer reviewed paper will back up the story.
Magnitude 2 — Photo release
Photo releases do n ot usually represent major scientifi c discoveries,
but contain aesthetic images. Even though the scientifi c content is
relatively low, a photo release of, for instance, Mars may still achieve
con siderable media attention, and appear on the front page of New
York Times (Levay, 2005). Consequently, photo releases may attract more
attention than live televised press conferences at times, despite the
lack of a “proper” scientifi c fi nding. There is usually no scientifi c paper
to b ack up a photo release.
Magnitude 1 — Web stories
Web stories, pos ted only on the scientifi c institution’s website, contain
news or information from the scientifi c institution that may only inter-
est a smaller audience such as web visitors with political or technical
interests. The news mostly concerns stories about the signing of agree-
99
ments, new telescope openings, appointments etc. A key point is that
the end-user needs to be active to “pull” the material from the scientifi c
institution’s website since there usually is no proactive distribution
for this type of release. This makes the impact a lot smaller than that
of methods higher up on the scale where the messages are pushed
towards the end-user.
12.2 ADDRESS LISTS
One of the key elements in any distribution is address lists . The larger
they are and the better maintained, the better tools they are. Address
lists seem to be something that many organisations maintain on an
individual basis, and it may be of mutual benefi t to share such a re-
source between organisations.
An example of a relatively advanced media database is seen in fi gure
35. The database is Filemaker Pro , and the main fi elds for each record
contain:
Institute/institution: The name of the television station, news-
paper or main contact point.
Postal address: For distribution of physical material such as bro-
chures and hard copies.
Telephone number: For personal follow-up.
Email: For emailing distribution.
Website: To keep track of the record and to facilitate later up-
dating.
Customer type (see chapter 5): Media such as television stations
or freelance journalist s, educators such as teachers or science
centres and decision-makers such as members of the European
Commission or committee members.
To keep the database growing every person who requests material or
information should end up in the distribution database. This can be
done by printing the mailing labels from the database, thereby forcing
the data into the system for future use.
12.3 EXTERNAL DISTRIBUTION PARTNERS
12.3.1 External mailing lists
In addition to the internal database, external partners may have access
to other markets and other customer segments. It may be worthwhile
considering using specialised external distribution lists. These lists usu-
ally specialise in their own science area. Two specifi c examples of good
external distribution outlets in astronomy are:
The American Astronomical Society’s press emailing distribution
list: Currently has more than 1500 science journalists with a
special interest in astronomy (Maran, 2005).
The Royal Astronomical Society’s press emailing list: Has more
than 200 members (Mitton, 2001).
•
•
•
•
•
•
•
•
DISTRIBUTION
100
THE HANDS-ON GUIDE FOR SCIENCE COMMUNICATORS
12.3.2 Press release portals
Recent years have seen a clear tendency for journalists and PIOs to rely
more on syndicated press release portals such as AAAS’s
31
EurekAlert
32
and AlphaGalileo
33
, originally supported by the European Commission.
These portals offer a superb searchable overview of the available press
releases to journalists. They also provide services such as access to em-
bargoed stories, advance warning per email and more. For PIOs it may
be worth considering registering with some of these portals and taking
advantage of their services.
12.3.3 Video portals (vortals)
Video portals (or vortals) (analogous to press release portals) have also
started to show up on the web. AthenaWeb is one such example (see
fi gure 45). At the moment vortals seem to be less useful for media with
31 American Association for the Advancement of Science
32 />33 />Figure 35: A fairly
comprehensive distribution
database. The coloured fi elds
get a cross corresponding
to the record’s target group
type. A comment fi eld makes
it possible to go back and
check who was sent what at
a later stage.
101
a short lead time such as daily news, while magazine programmes with
weeks of lead time are better suited to take advantage of their offers.
12.3.4 Video on Demand (VoD)
Video on Demand is an up-and-coming concept. In a few years we may
not see many more DVD rental shops in the street and we will exclusively
rent and download movies online. Some Video on Demand (VoD)
34
com -
panies already exist. These companies have descriptive pages on the
web and a credit card payment option, from where the movie (prepaid)
can be downloaded by the user directly via the Internet. The companies
are naturally commercial, but may still be interested in taking (fully-
fl edged) scientifi c documentaries into their product portfolio and rent-
ing them out to both their and the EPO offi ce’s advantage. An example
of such a company is the German One 4 Movie
35
. VoD websites may
have access to a very different segment of the population than that
normally targeted and addressed by an EPO offi ce. VoD is sometimes
known as Over IP Video or OIPV.
34 />35
DISTRIBUTION
103
13. EVALUATION AND ARCHIVING
A long-term communication strategy is necessary to secure a smooth
production fl ow for the line of products in an education and public
outreach offi ce. Part of the strategy should be to clearly identify some
success metrics and evaluate products after completion. But it is very
diffi cult to quantify successful science communication. What defi nes a
success? Is it the “importance” of the medium? The number of readers?
The type of readers? The increase in the level of the reader’s under-
standing of science and the scientifi c work process? Is it the number
of web hits or the downloaded Gigabytes? Most often it is a complex
mix of all these factors. Science communication is not an exact science,
but this should not prevent us from seeking indications of our impact
on the target groups.
13.1 QUALITATIVE EVALUATION
When limited resources prevent a rigorous statistical investigation of
the impact an intuitive/subjective understanding of the market re-
sponse can also play an important role in evaluating success. Such a
qualitative impact estimate can only be made if very close contact with
the target groups is maintained. Sporadic monitoring of the im pact in
selected media, ideally spanning a few years, will foster an intuitive
understanding of which products, approaches and angles are the most
effective. This is naturally a method that requires years of personal
experience among the EPO staff.
13.2 QUANTITATIVE EVALUATION
Obviously some sort of quantitative success metric such as gathering
quantitative data concerning a product’s or project’s penetration into
the target group is more satisfactory.
As an example, the number of times a given science result has been
mentioned in the media will, to a fi rst approximation, refl ect the in-
terest of the press and public in the product and the organisation and
show whether the EPO offi ce workfl ow has functioned well. However it
is not possible to extract information about the content of the articles
in large numbers: whether the articles were of a positive nature or
whether the message actually came across to the public. Qualitative
indications (see above) gained from daily contact with representatives
of each target group (journalists, scientists, public etc) remain an im-
portant addition to quantitative metrics.
For the special case of quantitative evaluation of video productions,
see section 15.5.3.
13.2.1 Press clippings
Some communication offi ces use press clippings as a success metric.
These are a fairly accurate estimator if a good selection of the press is
sampled. Press clipping agencies can check written and electronic press
EVALUATION AND ARCHIVING
A long-term
communication strategy
is necessary to secure a
smooth production fl ow
for the line of products in
an education and public
outreach offi ce.
104
THE HANDS-ON GUIDE FOR SCIENCE COMMUNICATORS
for pre-specifi ed keywords such as the name of the organisation or the
project. This type of press clipping service costs real money, but can be
a grand tool when justifying a continued or improved communication
operation (provided the numbers come out in favour of the EPO offi ce
of course).
13.2.2 Press release portal stats
A relatively simple way to test a given press release’s success with jour-
nalists is to check how many journalists look at it on press release por-
tals such as AlphaGalileo or EurekAlert. Such portals often provide easy
access to statistical information.
13.2.3 Google News
A nother example of an impact estimator is Google News o r similar ser-
vices. Google News is a machine-generated list of the news items that
appear on over 4500 news websites
36
. Apart from listing news coverage
Google News also creates “clusters” o f news coverage that have the
same origin (for instance a press release).
The biggest political stories have a “Google News index” ( number of
websites carrying the story) of more than 1000. Good science stories
36 As of January 2006.
Figure 37: A machine-
generated Google News
cl uster with 28 related
stories (other news websites
covering this particular
story) in the cluster.
Google News
Figure 36: An example of
press release statistics from
EurekAlert.
105
can make it above 100, and 20 can be considered quite satisfactory.
Google News li sts web articles for a consecutive 30-day period.
Using Google News it is possible to evaluate how successful individual
releases are relative to each other. It is not always easy to understand
why some releases fare better than others, although some of the ef fects
may be attributed to random external factors.
13.2.4 Web statistics
A third way to estimate impact is to use web statistics.
Haigh and Megarity (1998) conclude that web statistics have to be
taken with a pinch of salt as they often oversimplify the complex be-
haviour of users. However, as a minimum, web statistics can be used to
EVALUATION AND ARCHIVING
Figure 38: Example Google
news statistics for ESA/
Hubble. The graph shows
how many news websites
picked up the individual
releases in 2004 and 2005.
Figure 39: Web statistics in
their purest form. The server
(here for spacetelescope.
org, one of ESA/Hubble’s
servers) can be monitored
every second of the day via
this status screen (lower
half): the number of users,
the download volume,
the actual fi les being
downloaded and also (top)
some accumulated stats.
These stats are stored in
a text log fi le that can be
summarised graphically
with different web log
analysis software tools.
106
THE HANDS-ON GUIDE FOR SCIENCE COMMUNICATORS
show the relative impact of web material. Comparisons may be drawn
with previous similar work or with similar websites. Web stats include
a number of parameters, but usually include the following three pa-
rameters: hits, vis itors, and download traffi c.
A s the use of the Internet increases, web stats should move upwards
on average over a reasonable sample period, for instance from month-
to-month.
Hits
The number of hits represents the number of fi les downloaded (html
pages, images etc).
Figure 40: The number
of web hits per month
over a 2 year period for
spacetelescope.org, one of
ESA/Hubble’s servers.
Figure 41: The number of
web visitors per month
over a 2 year period for
spacetelescope.org, one of
ESA/Hubble’s servers.
107
Visitors
The n umber of visitors or sessions can be interpreted as the number
of people visiting a website per month (it can also be “unique visitors”
if repeat visitors are not counted).
Traffi c
The tr affi c is a simply the measure of data transfer or traffi c in units of
kilobytes, megabytes or gigabytes per month.
Stickiness
Another useful estimator is the time per session, ie the average time
a user spends on the website. This valuable number is an indicator of
the “stickiness” of the content, that can be interpreted as the “quality”
of the material itself, and not merely the quality of the advertising that
got users to the site in the fi rst place. There can be problems with this
estimator as it not so easy to extract from the web server log by web
server log analysis software tools. As Haigh and Megarity (1998) state,
the extraction is usually based on two unsound assumptions:
That a “host” corresponds to an individual user.
That the user does not pause to go to another site or have a
cup of coffee.
This makes the estimator a gross estimate at best for the real time per
session, but is still useful for measuring the change in stickiness over
time, or to compare with other sites that calculate time per session in
the same way.
13.3 ARCHIVING
Good information management is one of the trademarks of a well-
functioning education and public outreach offi ce. This a pplies both
internally within the group and externally towards the customers.
•
•
EVALUATION AND ARCHIVING
Figure 42: The web traffi c
measured in Gigabytes per
month over a 2 year period
for spacetelescope.org, one
of ESA/Hubble’s servers.
Good information
management is one of
the trademarks of a well-
functioning education
and public outreach
offi ce.
108
THE HANDS-ON GUIDE FOR SCIENCE COMMUNICATORS
Being able to fi nd information quickly when needed internally is the
fi rst step in any successful workfl ow and can be a real showstopper if
neglected. Proper information management of the products offered to
the outside world will decide whether customers can fi nd what they
are looking for or not.
The single most important concept in information management is
ar chiving. Archiv ing splits naturally into two categories. One is fairly
straight forward, namely archiving physica l materials, whereas the
other is more diffi cult, namely archiving electro nic materials.
13.3.1 Archiving of physical materials
Proper archiving of physical materials is naturally highly desirable to
smooth work internally within the group. The following production
materials should be archived as a minimum:
the raw material that went into the production of a product;
copies of the actual fi nished product;
material that relates to the evaluation of the product: press
coverage, web articles, statistics etc.
An archive with easily accessible copies of the fi nished products makes
distribution — especially later — much easier.
The best system is a matter of personal preference and working style.
Do not underestimate the time saved by being able to fi nd things in-
stantly and so spend some strategic time setting up a proper archive
as early as possible in an operation. For the author, hanging-fi le fold-
er archives strike the right balance between “input time” (archiving
the material) and “output time” (fi nding it again). It takes less than a
•
•
•
Figure 43: A simple archive
of raw material and fi nished
press release copies in paper
and glossy print form.
109
minute to set up a new case and to archive the material on the input
side, and only a few seconds to fi nd the materials again.
13.3.2 Archiving of electronic materials
Electron ic information management is naturally a huge topic and is
something that becomes ever more important as time passes. Gener-
ally an electronic archive consists of four components:
Data: The pro ducts or materials themselves (often consisting
of pixels).
Metadata: Informa tion that describes the data.
Front-end: Softwar e that interacts with the user and allows him
to “mine” the data.
Look and feel: Graphi cal interface that presents the informa-
tion and the choices in a simple, appealing manner with a good
overview.
See section 14.5.3 for an example of how this is implemented for a
web archive system.
1.
2.
3.
4.
EVALUATION AND ARCHIVING
Figure 44: An example of
a virtual archive: NASA’s
Space Science Education
Resource Directory (http://
t eachspacescience.stsci.
edu). NASA’s Space Science
educational products are
entered into this service
with a rich set of metadata
describing content, target
group (grade) and more. The
service contains pointers
to repositories such as
websites that contain the
data, except for educational
material that is stored
physically as PDFs and
offered directly from the
service.
NASA
Electron ic information
management is naturally
a huge topic and is
something that becomes
ever more important as
time passes.
110
THE HANDS-ON GUIDE FOR SCIENCE COMMUNICATORS
There seem to be two different approaches to archiving electronic
EPO materials: physical archives of data and virt ual archives of data.
In toda y’s web-oriented age we have very little concern about the geo-
graphical location of electronic materials and this issue fi lters into the
whole archiving discussion. What ultimately matters is whether an
archive is kept up-to-date and not whether it contains direct links to the
data (stored centrally) or pointers to the data that are stored in decen-
tralised locations with the creators or publishers for practical reasons.
The choice depends on the amount of data and other practical issues,
but the magic question to ask is: what takes the most resources: port-
ing the data to a centralised hold, or making sure that a decentralised
virtual archive is kept up-to-date? In a virtual archive the creators or
publishers often have a strong interest in making sure that their data
are available, and therefore this responsibility can be transferred to
them. The role of the virtual archive in this scenario becomes focused
on the important task of devising and creating the system that con-
nects the data and the metadata with the user through an appealing
front-end.
Figure 45: An example of
a physical archive: The EC’s
AthenaWeb. This archive is
a repository of broadcast
video clips from European
research organisations and
others. The decision to make
this a physical archive, ie to
transport all the data (the
footage) to a centralised
repository and control it
from there accepts high
manpower needs and costs.
AthenaWeb/EC
111
13.3.3 Case study: The Virtual Repository, a world-w ide virtual
archive
“An image is worth a thousand words, BUT only if you
can fi nd it!”
Paraphrase of an old Chinese proverb
The Internet and the web have been d etermining technologies in allow-
ing effi cient access to information and provide a fruitful environment
for the creation of new information. Although innovative search tools,
such as Google, have been developed to search the textual parts of the
available information on the web, similarly effi cient tools for searching
audiovisual content such as images and videos stored in archives do
not exist. There is some emphasis currently on the limited ability of
these search engines to access and index archives of data. As yet there
seem to be no global standards (like html for simple text and images)
for accessing electronic archives of audiovisual content. A possible so-
lution may be to set standards for how the data are metadata tagged,
and allowing archives to agree to conform to some kind of standard
for how they are accessed. This would allow the creation of a collective
world-wide virtual archive of audiovisual content.
In astronomy the coordinated exploitation of astronomical science ar-
chive data through the Virtual Observatory (VO) will h ave a major ef-
fect on the way astronomers work. The exploding volume of incoming
data and the emergence of technologies and tools to mine the archives
will inevitably also have a knock-down effect and result in signifi cant
changes for outreach and education as well. There is un doubtedly a
great potential for exploiting “VO-data” (meaning data in the VO era)
and facilities in the educational and outreach context, but there is
EVALUATION AND ARCHIVING
Figure 46: The dream of
the Digital Universe is
slowly becoming reality.
Image from the Uniview
application , property of Sciss
AB Sweden, and the Digital
Universe database, property
of the American Museum of
Natural History.
Sciss AB Sweden/AMNH
112
THE HANDS-ON GUIDE FOR SCIENCE COMMUNICATORS
equally no doubt that this task is diffi cult and will need a coordinated
worldwide effort.
At the same time as the scientists are experiencing a “data fl ood ”, we
in the EPO world are also experiencing a similar parallel development.
Larger and larger amounts of EPO audiovisual multimedia materials are
being made available to press, educators and lay people on the web.
The volume of digital products — outreach images, videos and news
— is increasing all the time and the trend seems to be accelerating.
Vast quantities of “clean” outreach material are available on the web
today. The problem is that they are stored in individual archives with
research organisations and are not linked systematically, so it is next
to impossible for the press and public to search these resources in a
simple manner.
Today’s search engines work by searching and indexing the textual in-
formation in html text-pages on the web. Existing audiovisual search
tools, such as Google Images , can only search textual information that is
placed around embedded images on a webpage. This information con-
sists largely of random pieces of text that often have little to do with the
ac tual images and furthermore only images embedded in html pages
can be searched. All audiovisual content in image or video archives, or
databases, cannot be searched in this way and thus a large majority of
existing audiovisual content is excluded. In addition, real archives are
the preferred storage method for the highest quality content, ie the
content closest to the scientifi c and cultural sources.
What is needed for astronomy EPO is a framework that enables seam-
less searching in archival databases on the web. One such idea is the
Virtual Repository
37
. Here, as above, repository is used in the meaning
of an archive, or a “place” where outreach and education resources are
“collected” and “virtual” in the sense that no physical transport of data
should take place — only a framework whereby the data can be ac-
cessed seamlessly in a sort of “Virtual Observatory-style” is required.
The search should be advanced, and allow users to specify search cri-
teria such as quality, size, popularity and more. The Virtual Repository
project is dedicated to improve the accessibility and usability of digital
astronomical material in a multilingual environment. The project will
coordinate collections in astronomical audiovisual archives worldwide
and enhance the quality of the audiovisual material using well-defi ned
metadata. It will reinforce cooperation between digital content stake-
holders such as the existing image archives at the large observatories.
The aim is to give access to the unique resource that is the sky — a vast
laboratory of science that is always in operation and accessible at all
times to everybody.
A few possible applications of such a Virtual Repository are:
Search engines (such as a hypothetical Google Universe).
Interactive click-and-point experiences in the planetarium dome
(“let’s look at the Orion Nebula in different wavelengths”).
37 />1.
2.
Vast quantities of “clean”
outreach material are
available on the web
today but it is next to
impossible for the press
and public to search
these resources in a
simple manner.
113
The sky on your home desktop: Links with existing commercial
planetarium software (Redshift , Starry Night , The Sky etc).
AstroKiosk (exhibition kiosks that automatically tap into, and
exploit the daily stream of astro-news, provided they are coded
with the right VR-metadata).
Educational material.
There are no limits to the potential applications when a Virtual Reposi-
tory framework is in place, interlinking multi-wavelength images and
videos and placing them in the right context.
3.
4.
5.
EVALUATION AND ARCHIVING
114
herrumbroso/istockphoto.com
115
PART III
SELECTED
TOPICS