TPM Route to World Class Performance Episode 10 pps
Bạn đang xem bản rút gọn của tài liệu. Xem và tải ngay bản đầy đủ của tài liệu tại đây (886.08 KB, 20 trang )
162
TPM-A
Route
to
World-Class
Performance
projects and associated
CAN
DO improvement zones will be mobilized,
together with the supporting activities of:
awareness and training, including an immediate on-site four-day hands-
on workshop for facilitators, key contacts and members of the Steering
Group, together with the core team nominees;
poky and roll-out plan development;
on-the-job coaching;
Steering Group/Audit review.
The pilot projeds themselves support a number of implementation processes:
Training for the core teams
On-the-job coaching for the core teams, team leaders and facilitators
Identification of issues which restrict the application of TPM principles
Integration of TPM with existing internal systems and procedures
Development of the policy and roll-out plan to support the systematic
implementation of TPM across the site
Th_ls
is
the key phase for moving the TPM process from 'Strategic Intent' to
'Making it Happen', concentrating on focused improvements on the pilots
using
WCS's
unique nine-step Improvement Plan and getting everyone
involved via the plant clear and clean activities of the 5S/CAN
DO
philosophy.
This
phase
also
includes setting up the TPM infrastructure, including the
Steering Group,
TF'M
facilitator and TPM pillar champions.
The objectives of the TPM pilot training are to:
conduct communications and awareness sessions;
implement the selected pilots using the nine-step improvement plan,
based on the three cycles of measurement, condition, problem prevention;
design, develop and implement a plant-wide clear and clean process
using
5S/CAN DO philosophy;
establish performance and measurement to record progress, with specific
au&t and reviews;
establish infrastructure to support eventual site-wide deployment of
TPM,
including pillar champion roles, responsibilities and TPM coaching
needs;
gain
experience and identify key learning points;
highlight the inhibitors to effective implementation for action;
ensure
that the policy guidelines defined earlier are applied;
monitor
and
review progress with the Steering Group.
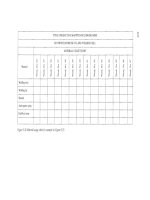
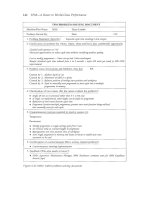
As
shown
in
Table
7.1,
the core teams will introduce low cost/no cost
improvements throughout the pilot over twelve to sixteen weeks. During
tfus
time, they
wdl
need to meet
a
minimum
of
eight times, following our
structured nine-step approach. At the end of the period, they will feed back
their recommendations for future action and also their views on the effectiveness
of
TPM.
Planning
and
launching
the
TPM
pilot
163
Table
7.1
Typical TPM pilot project timetable
Week Content
NO
~~
Support activities
1
2
to
3
4
to
5
6
to
7
Initial training and pilot selection
equipment history
OEE
evaluation/assessment
of
6
losses
Criticality assessment /condition
appraisal
Refurbishment plan/asset
care
8
to
9
Best
practice routines/problem
resolution
10
to
11
Prepare for feedback/presentation
OEE
definitions
TPM
activity board
5S/CAN
DO
clear
and clean
activity
Refurbishment plan
Asset care training
Refurbishment action
Trial improvements
Single-point lessons
M/C
visual help/aids
Refurbishment action (cont
/
d)
Trial improvements (cont/d)
Training
plan
12
Feedback dry run/presentation
In parallel, and following on from the general awareness sessions, all
shopfloor personnel in the identified geographic improvement zones
(determined largely by the logic of the team leader’s span of control) will be
involved in workplace organization activities, starting with a plant clear and
clean activity. This aims to reinforce the key learning points from the training
in a way which raises existing housekeeping standards and introduces the
concept of shopfloor ownership in a hands-on way, based on the existing
shift-based geographic zone. The activity also includes a very detailed and
structured audit and review of the
CAN
DO
process to target areas for
improvement and to ensure that the gains are held.
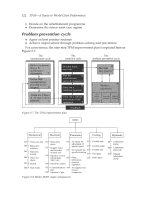
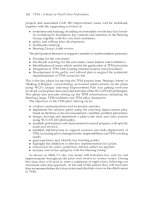
Implementation
of
improvement zone
The pilot provides management with the experience to identify gaps
in
general
areas of best practice. This results in the generation of management standards
which can be translated into local policy at a shopfloor improvement zone.
See Table
7.2.
The improvement zone implementation progress can then be measured
against these standards, providing
a
basis for team-based recognition at each
level.
If top-down management job descriptions and personal development
plans
are amended to reflect success at each improvement zone level, this effectively
ties in top-down and bottom-up recognition systems.
Table
7.2
TPM
bottom-up
standards
Step
OEF
OAC
MAC
Coritrnzious
skill
development
Early
equipinent
iriaiiagemei? t
Lvss
Focused
Plaiined
Qualily Function Safety
deployment irriprouerneiit
maintenance
maintenance
development deployinent
Highlight loss
levels, priorities
KPIs, cross-shift
accountabilities
and progress
reporting
Establish team-
based
performance
management at
all levels linked
to the current
year business
planning
process
Integrate future
business
planning with
PDP
and
specific
loss
reduction
targets
Define future
loss vision
linked to exceed
future customer
expectations
Support technical
problcm/improvement
activities in initial roll-
out phases to
address sources of
contamination
Transfer lessons
across similar
equipment
Focus
on
support
problem/iinprovement
activities, including
PDP
targets
Assess supply chain
losses. Define the
future customer
requirements
Initial cleaning
of
workplace
and
equipment/
condition
appraisal
Action of
source,
including
cleaning and
use
of
SPLs
Adopt apple a
day standards
and use of
visual
indicators
Adopt
thermometer
standards
Maintenance
WPO
refurbishment
and critical
system back-up
routines
Contain
accelerated
deterioration,
develop counter
measure,
including
correct
parameter
setting
Set
thermom etcr
/
injection needle
standards to
improve
response tune
and feedback
Eliminate
sporadic losses
(breakdown
analysis,
condition-based
repla cem en t)
Teclmical
documentation,
critical
assessment.
Define key
checkpoints/
preventive
maintenance
Analyse/address
accelerated
deterioration and
impact of
improve
6
LCC
loss factors
include ease of
use, etc.
Correct design
weaknesses to
improve
precision and
feed back to
knowledge base
Improve
technical
documentation,
raise
understanding
and ownership
Actions to
formalize
current
practices across
the shifts
Actions to
standardize
core
competences,
including
correct
operation and
basic
maintenance
techniques
Actions to
simplify,
combine,
eliminate
Establish
training plans to
support normal
conditions and
future skill gap
analysis
Safety
assessment to
align actual and
current
practices (plus
future needs)
Actions to
reduce safety
risk and
promote
behavioural
safety as part
of
CI
Refine
procedures
using visual
indicators to
reduce risk and
maintain
awareness
Define future
safety and
environmental
needs.
Establish
normal
conditions
Actions to
identify design,
technology and
project
management
losses (EEM
policy)
Actions to
measure
LCC
reduce losses.
Integrate
equipment
management
roles
(FI,
QM,
EEM) and
establish
knowledge
base
Design actions
to eliminate
sources of
contamination
and support
zero
breakdowns
Define the
future company
response. Early
product
management
Managing the
TPM
journey
8.1
Future
vision, planning and control
The introduction of
TPM
to an enterprise starts with a vision of the future,
and
this
is
illustrated
in
very clear terms by Figure
8.1.
All the means of
achieving
TPM
which have been discussed in earlier chapters lead to the
continuous improvement habit, which embodies the spirit of
kuizen
and which
can be brought to reality by following the
WCS
approach to TPM. The key
point is that when people
want
to change the way they do things, then they
will
sustain it.
Some
of
the major changes which will result from the introduction of TPM,
and the benefits which those changes will bring, are as shown in Table
8.1.
Planning, organization and control are essential prerequisites:
Plannzng
entails allocation of resources on a realistic and achievable
basis
with
regular review and progressive development on the long-
term
basis
necessary for success.
0
Organization
requires defined resources with clear allocation of roles
and responsibilities; this must be accompanied by effective and clearly
understood methods of working.
1.
OUR
HIGHEST
PRIORITY
TAKING
CONTROL OF
OUR
EQUIPMENT
I
I
2.
the company
Time to
work
in
teams
to
solve
our
problems
far
good
cr
cr
cr
Delegate day-to-day running to
supervision
and
beloa
Easy
to
use
working
%
methods,
e.g
spare puts
clearly labelled
Communication
Completely safe
No
011,
water
or
air leaks
Customer satisfaction with quality products
Zero
waste, breakdowns,
90%
OEE
Ouoted
bv
others
as
wdd
class
6.
TO
DELIVER THIS
I
we
expect from
our
employees
Q
Ownershiplhighly motivated
Q
Minimum supervision
@
with improving
OEE
Q
Proud to
be
part
of TPM
Well
maintained colourful equipment
Discipline to work the whole shift using
best practice routines
Figure
8.1
Our
‘Spark to Start vision’ win/win contract
166
TPM-A
Route
to
World-Class Performance
Table
8.1
TPM
enablers and results
Enabler
Machines
run
close to name-plate capacity
Ideas
to
improve
often
proposed by operators
Breakdown rate reduced
Machines adapted
to
our needs by our
Operators
solve
problems themselves
Cleanliness and pride in continuous
More
output
from
existing plant
people
improvement
Result
Reduce need
for
excess capacity
Ownership /success
Used
to
learn and teach the team
Our
machines will be better
Fewer
delays and stoppages
Good working environment
More
profits
Contvol
The two aspects of control are
coordination,
which is concerned
with what happens next and is most effective with simple vision systems
and procedures; and
feedback,
which is
-
concerned with goals for time, cost and quality
-
used to identify the reasons for failure and to prevent recurrence
-
the source of objective evidence of the need for increased resources,
modification of goals or the introduction of specialists.
8.2
Role
of
managers
The implementation of TPM has three dimensions:
Top-down:
creating the environment for continuous improvement
Bottom-up:
small group activity
Organizational learning:
capturing and sharing lessons learned
These align with first line and senior management roles and provide the
basis for integrating management priorities through an infrastructure illustrated
in Figure
8.2.
This is also aimed at giving the bottom-up, team-based activity
the necessary recognition at each level of TPM progress (see Figure
8.3).
Top
down
Pillar champions focus on co-ordinating the implementation of individual
TPM principles by setting policy and supporting its application. Policy is
about problem solving and sets out a fluid set of ground rules in the form of
priorities and standards. TPM provides the tools to deploy that policy,
translating top-level perspective stepwise into shopfloor accountabilities
through the first line management or area champions. An outline of these
standards is included in Chapter
7.
Bo
f
tom-up
First line managers are allocated physical areas in which to focus their
improvement resources. Their role is to develop the capability of multi-
Managing
the
TPM journey
167
Promotion
Steering Committee
(this
year,
3-5
years)
Top-down champions (this month, this quarter, this year)
Bottom-up activity (this week, this month)
Supervisor/
I
Team Leader SHIFT A SHIFT
B
SHIFT C SHIFT
D
Core
Core Key
Team Team Contact
Figure
8.2
TPM
infrastructure/roles
for
a
continuous improvement
habit
LGIVE TEAM RECOGNITION AT EACH LEVEL1
Success will reflect the degree
of
management commitment
\
Core team
activities
Spread out the general lessons
Figure
8.3
Give team recognition
at
each level
168
TPM-A
Route
to
World-Class Pevformance
1
2
discipline teams
of
five to seven personnel. These teams will direct a minimum
of
5
per cent
of
their time to continuous improvement.
Organizational learning
Often first line management is perceived as the barrier to change. In reality,
’what gets measured gets attention’. Traditionally first line management is
left alone provided the tonnes
go
out of the door. Anything else
is
a ’nice to
have’, and if it doesn’t happen, then it will be ignored.
TPM
overcomes this by measuring progress against quality milestones
(see Figure 8.3) based on evidence of bottom-up progress through the
improvement zone implementation steps (see Figure 8.4). Figures 8.4 and 8.5
Assessment
Yes No
Review point Evidence
Are improvement areas and zones clearly defined?
Are
zone
production capacities/bottlenecks
identified?
TPM IMPROVEMENT
ZONE
AUDITREVIEW
Milestone: PlanningMobilization Level:
Department:
Zone:
Auditors: Date:
10
Has
the TPM information centre been updated?
I
3
I
Have weaknesses in documentation been assessed?
I
I I
I
Has
an
assessment
of
improvement zone benefits
been made/documented and priorities defined?
5
I
Has future TPM vision been clarified?
I I
I
I
Ill
6
I
Are team leaders allocated to improvement zones?
I
Have facilitation responsibilities and resources been
identified?
8
I
Has
a
firm timetable of activities been developed?
I
I
n
Has
an
assessment been made
of
current levels of
housekeeping?
Has
a
roll-out cascade been defined
by
the team
leader for each improvement zone?
l1
I I
12
1
Have teams been briefed?
I
1-
Figure
8.4
Mobilization
checklist
Managing
the
TPM
journey
169
1
TPM IMPROVEMENT ZONE AUDITlREVIEW
I
Milestone: Introduction
Department:
Auditors:
Level: 1A
Zone:
Date:
Assessment Evidence
Review point
-
No
Score
5
~
5
Is
a
TPM
board in place for each
improvement zone?
Safety procedures defined
3
=
up
to
date
4
=
improved
3
=
used
5
=
improved
Workplace initial clean (CAN DO Step
1)
5
CAN
DO
audit
results
Equipment initial clean
5 5
=
maintained
Cross-shift supervisor prioritization
5
3
=
agreed
Identification of frequent problems
(6
losses)
and root causes
5
-
5
3
=
recorded
5
=
improvement
3
=
available PLChomputer software back-up
Equipment description (sketch, critical
areas, parameters. process flow chart)
5
3
=
acceptable
5
=
understood
3
=
available
Checkpoints (e.g. pressure, temperature,
RMP) and preventive maintenance schedule
5
Problem register in place recording
equipment history, including identification
of accelerated deterioration
5
3
=
recording up
to
5
=
reduction
in
date
stoppages
50
TOTAL
I
Minimum score
30
=
level 1A,
40
=
level
1B
Rating based
on
procedureskystems which
are:
1 Not in place, with
no
plans to address
4
Well defined, executed and understood
2
Weakldeficient
5
Well defined, with
a
track record of
3
continuous improvement
Able to meet departmentaUplant goals with
plans to improve
Figure
8.5
First-level bottom-up audit criteria
170
TPM-A
Route
to
World-Class Performance
are sample checklists to support the launching and initial auditing
of
an
improvement zone.
As
this requires the active co-operation
of
management
the rate
of
progress is
a
measure
of
the degree
of
alignment between top-
down and bottom-up priorities. The rate
of
progress is, therefore,
also
a
measure
of
organizational learning (see Figure
8.6).
The management role can be summarized
as
three activities,
as
shown in
Figure
8.7.
DEPARTMENT
-1
SM
=
Shift Manager
STL
=
Shift Team LeadeI
MS
=
Milestone
MSI
0MS20
MS3m
MS40
PILLARS
______.
.
.
.
.
. . .
for
STL
Figure
8.6
Audit/review process:
Linking
team objectives to the
TPM
(act
on
suggestions)
Set expectations and recognize
of
successkoach
to next level
CREATING THE ENVIRONMENT
Figure
8.7
Top-down
champion role/process
Managing
the
TPM
journey
171
These priorities are
linked
to the
future
business vision through the use
of
a continuous improvement master plan. The master plan
is
simply a
summary
of
intentions laid out against the predictable stages of the
TPM
change
programme. These
are
shown in Table 8.2.
The master plan
also
integrates pillar champion activities to deliver a
single agenda
for
change. Each milestone
of
the plan provides a quality check
that the management team are pulling together. Progress towards each
milestone is monitored and supported by the quarterly top-down audit
coaching precess.
This looks
for evidence
of
progress bottom-up to highlight
where top-down policy
is
effective or needs support (see Table 8.2).
Table
8.2
Basic
structure
of
the
TPM
master
plan
Milestone
Theme
Activity
Benq'it
Times
ca
le
1
Introduction Get everyone Improved ownership 1-2
yrs
2 Refine best Standardize and Reduced sporadic
2-3
yrs
activities
35%
3
Build Redeploy expertise Increased plant
%4
yrs
capability
to
achieve capability
with
less
4
Strive for
zero
Optimize progress Better
than
new
P5
yrs
involved
OEE
+10 to
15%
practice simpw routine
loss
OEE
+20
to
Milestone
4
intervention
breakdowns performance
OEE+50
to
60%
8.3
TPM
cost/benefit
analysis
The impact
of
equipment losses ripples
through
the organization, touching
every function and promoting reactive, inward-looking systems and processes.
As
equipment becomes more reliable through the application
of
TPM, these
ways
of
working will not be automatically revised to reflect that fact.
As
Figure 8.8 illustrates, there
is
little merit in getting a machine OEE up from
65
per cent to
90
per cent,
if
the door-to-door losses stay at
55
per cent.
To
address this issue, company-wide
TPM
considers company-wide losses
under
four
main
headings:
Equipment
0
Transformation
MateIial
Management
Equipment
losses
This
covers the traditional
six
classic losses plus design losses
of
operability
172
TPM-A
Route
to
World-Class Performance
45%
‘VALUE CHAIN’ OEE
(80%)
55%
DOOR-TO-DOOR
OEE
(85%)
4
b
Line
of
factory
Suppliers
-
65%
M/C
OEE
(90%)
Classic
6
x
losses
4
F
,
FLOOR-TO-FL00
4
OEE
4
Customers
-
Figure
8.8
The
value
stream
and
the
OEE
(ease of use), maintainability (ease
of
maintaining), reliability and safety.
This includes labour and other operational resources which do not reduce
when consumed (in the short term). These resources when released also have
the potential to add value and improve competitive capability.
Trans forma
tion
losses
Energy costs do not vary directly with output. In some businesses, 80 per
cent of energy costs are fixed.
As
a result, such costs can be volume-driven.
It is not just a case of switching lights off. Reducing minor stops through
improved asset care will reduce energy losses while idling. Leaking air lines,
once refurbished, will reduce electricity costs. Tooling care and design can
also have a major impact on energy costs.
Maintenance materials also do not vary directly with volume. This is affected
by factors such as levels of contamination, stop/start production, corrosion
and brittleness as well as training, variation in production methods and, of
course, human error. These costs reduce when not consumed.
Ma terial losses
Often equivalent to
50
per cent of sales value, product design, improving
process capability and improved working practices can all impact levels
of
material loss.
Management losses
The remaining value chain losses influencing this cover the company response
to customer expectations (see Figure 8.9). For example, if current
OEE
results
in a cost
of
E2.10
per unit as shown in Figure 8.10, the potential cost per unit
at
10
per cent improved OEE is
E2.00.
If the additional capacity cannot be sold, management will need to restructure
overheads to compete with this achievable unit cost. Labour reduction, even
Managing
the
TPM
journey
173
Customers Drive the business
Necessary
company
A
I
resmmes
I
Figure
8.9
Customers
drive
OUT
business
cost
Variable
costs
fllunit
Fixed costs €110
(inc. labour €50)
+
100
110
Output
In
the
example
QUALITY
OEE
BOW
Prduce
Prcduce
more88%
same888
(A)
Onput
(B)
FixtdCosts
(c)
Variablecosts
@)
Totalcost
(E)
Unit
cost
IXA
0
Contribution
(G)
Unit
sales
price
Totalcontribution
(I)
Rchxnoncapital
employed
100 110
110 110
100 110
210 220
€2.10 €2.00
1.05 1.15
3.15 3.15
105 126.5
-
+20W
~~
~~
100
105*
100
-
205
€2.05
@+A
1.10
3.15
110
(FXA
+5
(t
Producing 10 per cent more
in
the same time increases return
on
capital employed by 20 per cent
Producing
the
same in 10 per cent
less
time increases return
on
capital employed by 5
per
cent
(*reduced
labour
cost
by
10 per
cent)
What
is
your organization’s potential return
on
capital employed?
Figure
8.10
OEE/loss
relationship
if
it
is
possible, will not be enough.
This
will reduce unit cost to only
€2.05.
There are other hidden losses associated with redundancy
-
not least the
barriers it presents to continuous improvement.
Finding
the additional demand
will
avoid the
loss
of
5p/unit.
Loss
prioritization
Loss
modellmg allows a comparison
of
potential cost
structures
at current
and forecast OEE levels and volumes.
Using
best
of
best and average OEE
improvement Curves, it
is
possible to predict forward the likely cash flow
gains
from improved OEE. These areas of
loss
avoidance can be both linked
to
the appropriate
TPM
techniques and allow resources to be
focused
and
then deployed through the
pillar
champions to the shopfloor teams.
174
TPM-A
Route
to
World-Class Performance
CAPABILITY
8.4
Steps to achieve the
TPM
vision
Experience of implementing TPM has shown that the route to world-class
performance begins with eliminating
sporadic
losses. Once these are under
control, the task of eliminating
chronic
losses is made easier.
There are two main contributors to sporadic losses:
equipment condition
human error
Using TPM techniques, the route to addressing these factors takes around
three years and
is
the main focus for the first
two
milestones of the master
plan:
Get everyone involved.
Refine best practice and standardize.
This is the structured mechanism for the TPM master plan which integrates
the vision and actions of the management team, providing consistent:
0
prioritization
expectations
reward and recognition
As
a result, skills are progressively developed
so
that:
operators become technicians;
0
maintainers become engineers;
supervisors become managers;
managers become entrepreneurs.
the route practice capability losses
.
I
&standardge
I
.
.
start vision
TIME
3
years
plus
Initial pilot(s) and everyone
involved
Get the basics
INPUT
EFFORT
OWNERSHIP
Figure
8.11
Skill
development
Managing the TPM journey
175
The focus
for
facilitators, production, maintenance and management to deliver
the
TPM
vision through the four milestones is set out in Table
8.3.
8.5
Management structure
and
the
roles
of
supervisors
A
plant-level TPM project structure taken from an actual case history is shown
in Figure
8.2.
This shows clearly the involvement
of
top management and the
relationship of all the aspects of
TPM
which have been addressed in earlier
chapters.
The roles and responsibilities of the management and supervisors as key
contact to the TPM teams are repeated here to underline their importance:
0
Input and release of people for TPM training
o
Release
of
equipment for restoration and subsequent asset care
0
Technical and historical information
Table
8.3
Steps to achieve the
TPM
vision
Introduction Refine best practice Build capability
Continuous
(pilots) and standardize (promotion and improvement
(roll-out) practice)
(stabilization)
Facilitator-driven Facilitator/supervisor- Supervisor-driven Small-group
driven maintainer/operator-
driven (i.e. self-
sustaining
Production focus
All
departments All employees Autonomous small
Selected begin improvement use TPM groups implement
operators in pilot activities concepts activities
area work
on
Establish Early problem
improvement standardization detection/solving
plan
Maintenance
Maintenance
Training in Reducing
focus
organizes to support maintenance
equipment lifetime
maintainers and planned operators and
work with pilot maintenance maintainers
team
Management
Stimulating interest, Encouraging Striving for world
focus
managing resources teamwork, class performance
Policies and training and skill
structure to development
support long-
term
commitment
Selected plant-wide projects skills for costs
176
TPM-A
Route
to
World-Class Pevformance
0
Plant and line
OEEs
0
Commercial and market benefits definition
0
Visual management of information
0
TPM publicity and awareness communication
0
Inter-shift communications
0
TPM activity logistics and facilitator support
0
Standardization of best practice
0
Spares forecast and consumption rates
0
Hygiene and/or safety training and policy
0
Input to problem solving and solutions
A
dramatic message for managers and supervisors is embodied
in
Figure
8.12.
Requirement
To be a world-class manufacturer
Through
Just in time, lean production, one-piece flow
Prerequisite
for
success
We will be planning for failure regarding our daily and weekly output schedules unless the six
losses
of:
Breakdown
Set-up and adjust
Idling and minor stoppages
Reduced speed
Defects and rework
start-up
are systematically tackled and eliminated through the TPM improvement plan. This will be reflected
in
an
OEE
performance of
85
per cent
+
rather than the
c.70
per cent
OEE
of
today.
The choice?
Either
100
per cent sustained commitment from management and supervision for TPM
or
Continue
to
plan
for
failure
Figure
8.12
The
choice
for
management
8.6
Barriers to introduction
of
TPM
Inevitably, when major changes in an enterprise are being introduced there
will be suspicion and opposition: this has been discussed in Chapter
7.
Some
of the common reasons for suspicion are as follows:
Management shows impatience for quick fixes rather than 'stickability'
and commitment.
Managing
the
TPM
journey
177
0
I
operate, you
iix:
I
add value, you cost money.
0
Operators are
taking
our
jobs away (say maintainers).
TPM
is
a people reduction programme (threat
of
job losses).
TPM
is
just another cost reduction driven programme.
0
TPM
is
a hidden agenda to get operators to do the maintainer's job.
In
the early stages,
if
communication
is
poor, then resistance
will
be
inevitable.
An
open and clearly thought out agenda
for
TPM
is
absolutely
vital.
8.7
Visibility
of
information
The importance
of
visible sources
of
information to reinforce discussion and
verbal
instructions
cannot be too strongly stated. One of the major lessons
learned
in
the early stages
of
TPM
introduction
in
Japanese enterprises was
the
use
of sight
as
part
of
communications to complement hearing. Some
examples are
as
follows.
TPM
equipment
or
activity boards
Handwritten documentation
of
status,
progress
and achievements prominently displayed
in
the work area,
with objectives included.
A
schematic example
is
shown
in
Figure
8.13.
0
Black
museums
Examples
of
problems solved,
or
waiting
to be solved.
0
Training records
Displayed publicly; updated by
trainees.
0
Notice boards
Located at factory entrances. Professionally implemented,
with excellent graphics. Processes and achievements clearly analysed.
Include safety records.
Figure
8.13
Lineside activity board
178
TPM-A
Route
to
World-Class Performance
0
Operation information
A4 format located on or by the equipment.
Maintenance points
Marked by red arrows and frequency symbols. Colour
coding for clarity of assembly/repair sequence. Optimum maintenance
routes clearly marked. Machine defects tagged.
8.8
Support for teams and
key
contacts
Management support for these groups must be visible and total. Support of
teams involves: active listening; supporting and, if differing, taking
responsibility; stating issues which are your concern; and being specific. Some
negative team practices which need to be gently corrected are: over-talking;
not joining in; flying off at a tangent; and hijacking the discussion.
Some guidelines for helping teams to succeed are as follows:
Agreed priorities and strategy
Effective planning, control and delivery systems
0
Clear organization of labour, equipment and materials
Insistence on measurable results and individual commitment to them
0
Encouragement to identify and meet task and process skills needs
Active reinforcement of teamworking
Promotion of a positive outlook to problem solving and new ideas
Mutual trust
Mutual support
Good communication
Shared objectives
Managed conflict
0
Effective use of skills
The role of key contacts is to:
0
provide support to the team in specialized areas which impact on the
shopfloor;
improve the working relationship between direct and indirect staff;
create an environment where all business functions can help improve
the value adding process.
8.9
Importance of safety
The emphasis on safety at work has steadily increased in recent years, and in
today’s industrial scene everyone in an enterprise must be concerned about
safe practices.
TPM
is very much concerned to enhance safe working. Some
of the main ways in which this can be achieved are as follows:
Neglect and penny-pinching are false economies in the context
of
the
cost of injuries due to unreliable machines.
Maintenance and safety are tied partners. Most injuries and accidents
are caused by operators trying to intervene because their machines are
not operating correctly.
Managing
the
TPM
journey
179
Maintenance means proper guarding, no exposed parts,
minimum
adjustment: it means the operator is protected.
The Health and Safety Executive says most hearing damage
is
caused
by badly maintained machines.
When cleaning or driving our car we can idenbfy at least
27
condition
checks, of which
17
have sigruficant road safety implications.
Bring
ths
good practice into work with you
(see
Figure
3.3).
The notion of the competent and trained person, Linked to assets that
are
fit for purpose and safe, plus statutory obligations, must be central
to your
TPM
strategy, policy and practice.
8.10
Summary
Some of the intangible benefits of why
TPM
works are as follows:
TPM
is
common sense and is therefore valued by employees and
employers alike
Practical vehicle for implementing the company’s
goals
and vision
Changes the employee’s
mind,
creating ownership
Belief
in
his/her equipment
Protected and maintained by hun/her
Through self-help (autonomous maintenance)
Give the employees confidence in themselves: create a feeling
of
’where
there’s a
will
there‘s a way’
Clean environment and environmentally clean
Good corporate image
Figure
8.14
poses a question and provides the answer which epitomizes
the TPM approach. Figure
8.15
illustrates what WM meant to a team based
on their experiences of
running
a sixteen-week TPM pilot exercise at an
automotive manufacturer
in
the north of England.
There is no better way of rounding
off
this
chapter than by quoting the
general manager
of
the plant after attending a team presentation of a
TPM
improvement plan pilot:
We
started
our
TPM programme
-
or TPM journey
as
I
prefer to
tl-unk
of it
-
about three months ago,
so
it’s early days yet.
However, the
things
that
struck
me most about the
TPM
team’s
Question
If
you
haven’t
got
the
time
to
do
things right
the
first
time
How
are
you
going
to
find
the
time
to put
them
right?
Aluwer
TPM
gives
you
the
time
to
do
things
right
the
fmt time, every time!
Figure
8.14
TPM:
the
answer
fo
a
problem
180
TPM-A
Route
to
World-Class Performance
presentation today were their obvious enthusiasm for what is
proving to be a grass roots process with real business benefits.
The other factor which is quite clear to me is that TPM can only
be sustained provided our supervisors and managers support
the TPM process wholeheartedly. Our workforce obviously values
the process: it is up to us to give them the time and full resources
to carry it out. We’ve always known that our equipment and
process capability is not what it should and could be. Everyone
thinks about quality output. TPM adds the missing link: quality
output from world-class and effective equipment.
Today People Matter
Totally Pampered Machines
Totally Perfect Manufacturing
Training People Meaningfully
Teamw ork Production Maintenance
The alternative:
Tomorrow? Probably.
. .
Maybe.
. .
Figure
8.15
What
TPM
means
to
us
TPM
for equipment designers
and suppliers
Behind the plant and equipment used
in
the production process there are
three functional groups, namely:
Operations
Commercial
Engineering
These make up three essential partners for new product/equipment
introduction.
This
chapter describes in outhe how these activities must be
co-ordinated and focused on the TPM objectives. The partnership requires a
sustained drive towards improving project and design management
performance through the elimination
of
hidden losses such as poor
maintainability, operability, and reliability early
in
the equipment management
process.
Designers and engineers need to improve their
skills
by:
regular visits to the shopfloor and learning from what operators and
maintainers have to say;
studymg what has been achieved in equipment improvement as a result
of self-direded and
quality
maintenance activities;
gaining hands-on experience with equipment, including operation,
cleaning, lubrication and inspection;
supporting
P-M
analysis as part
of
the key contad/team activities;
conducting maintenance prevention analyses.
Figures
9.1
and
9.2
show how the five
goals
of TPM can be achieved
through
design feedback, early warning systems and objective testing
of
new
ideas.
Figure
9.3
portrays the benefits
of
using
TOM design techniques,
TPM
(D),
as the driver
for
Early Equipment Management
(EEM).
All
partners
are
involved
in
achieving the continuous improvement habit, learning how to deliver
flawless operation in less time.
It
also
shows what the TPM (D) process can deliver over the life of the
equipment. The gap between typical
(or
traditional) output/value and true
potential by getting it right
in
the early stages
is
huge.
Figure
9.4
illustrates the concept that two-thirds
of
the lifetime costs
of
new equipment
is
determined (but not spent)
in
the early design specification
stages and can, therefore, be said to be designed in.
T~IS
serves to emphasize