Báo cáo y học: " Reproducibility of the airway response to an exercise protocol standardized for intensity, duration, and inspired air conditions, in subjects with symptoms suggestive of asthma" pdf
Bạn đang xem bản rút gọn của tài liệu. Xem và tải ngay bản đầy đủ của tài liệu tại đây (1.25 MB, 12 trang )
RESEARC H Open Access
Reproducibility of the airway response to an
exercise protocol standardized for intensity,
duration, and inspired air conditions, in subjects
with symptoms suggestive of asthma
Sandra D Anderson
1,2*
, David S Pearlman
3
, Kenneth W Rundell
4
, Claire P Perry
5
, Homer Boushey
6
,
Christine A Sorkness
7
, Sara Nichols
8
, John M Weiler
8,9
Abstract
Background: Exercise testing to aid diagnosis of exercise-induced bronchoconstriction (EIB) is commonly
performed. Reproducibility of the airway response to a standardized exercise protocol has not been reported in
subjects being evaluated with mild symptoms suggestive of asthma but without a definite diagnosis. This study
examined reproducibility of % fall in FEV
1
and area under the FEV
1
time curve for 30 minutes in response to two
exercise tests performed with the same intensity and duration of exercise, and inspired air conditions.
Methods: Subjects with mild symptoms of asthma exercised twice within approximately 4 days by running for
8 minutes on a motorized treadmill breathing dry air at an intensity to induce a heart rate between 80-90%
predicted maximum; reproducibility of the airway response was expressed as the 95% probability interval.
Results: Of 373 subjects challenged twice 161 were positive (≥10% fall FEV
1
on at least one challenge). The EIB was
mild and 77% of subjects had <15% fall on both challenges. Agreement between results was 76.1% with 56.8% (212)
negative (< 10% fall FEV
1
) and 19.3% (72) positive on both challenges. The remaining 23.9% of subjects had only one
positive test. The 95% probability interval for reproducibility of the % fall in FEV
1
and AUC
0-30
min was ± 9.7% and ±
251% for all 278 adults and ± 13.4% and ± 279% for all 95 children. The 95% probability interval for reproducibility of
%fallinFEV
1
and AUC
0-30 min
for the 72 subjects with two tests ≥10% fall FEV
1
was ± 14.6% and ± 373% and for the
34 subjects with two tests ≥15% fall FEV
1
it was ± 12.2% and ± 411%. Heart rate and estimated ventilation achieved
were not significantly different either on the two test days or when one test result was positive and one was negative.
Conclusions: Under standardized, well controlled conditions for exercise challenge, the majority of subjects with
mild symptoms of asthma demonstrated agreement in test results. Performing two tests may need to be
considered when using exercise to exclude or diagnose EIB, when prescribing prophylactic treatment to prevent
EIB and when designing protocols for clinical trials.
Background
Exercise is a widely recognised stimulus for provoking
transient airway narrowing. Exercise-induced broncho-
constriction (EIB) is the term used to describe this phe-
nomenon. The most commonly used measure to express
severity of EIB is the post-exercise fall in forced
expiratory volume in one second (FEV
1
), as a percentage
of the pre-exercise value [1]. A ≥10% fall in FEV
1
is
reported to provide the best discrimination between asth-
matic and normal resp onses in laboratory based running
tests [2]. It is also the value suggested as th e cut off for a
positive test in the ATS and ERS gu idelines for testing
for EIB [3,4]. A s econd index of EIB se verity is the area
under the % fall in FEV
1
time curve (AUC
0-30 min
), which
summarizes the extent and duration of bronchoconstric-
tion. Thi s second index is used to assess the benefit of
* Correspondence:
1
Department of Respiratory & Sleep Medicine, 11 West, Royal Prince Alfred
Hospital, Missenden Road, Camperdown NSW 2050, Australia
Full list of author information is available at the end of the article
Anderson et al. Respiratory Research 2010, 11:120
/>© 2010 Anderson et al; licensee BioMe d Central Ltd. This is an Ope n Access article distributed under the terms of the Creative
Commons Attribution License (http://creativ ecommons.org/licenses/by/2.0 ), which permits unrestricted use, distribution, and
reproduction in any medium, provided the original work is properly cited.
medications that enhance recovery to a greater extent
than their benefit on the immediate post exercise fall in
FEV
1
[5]. The AUC
0-30 min
reflects the contribut ion of
the numerous mediators involved in EIB [6,7].
EIB commonly occurs in people with clinically recog-
nized asthma [8] and has been reported in school chil-
dren, elite athletes, and military recruits without other
clinical signs and symptoms of asthma [9-11]. EIB is
often the first indication of asthma [12] so it is important
to diagnose and then treat underlying asthma recognized
by exercise intolerance. We recently studied and reported
a large number of adults and children with signs and
symptoms suggestive of asthma but without a definitive
diagnosis [13]. The study investigated sensitivity and spe-
cificity of airway responsiveness to methacholine and
mannitol to identify EIB and a physician diagnosis of
asthma [13]. The study e xamined duplicate controlled
exercise challenges in 373 subjects and the data provided
an opportunity to examine reproducibility of the airway
response to exercise in the type of individual most likely
to be referred for exercise testing for EIB.
Exercise testing to identify EIB in the laboratory i s
affected by the type of exercise, intensity and duration
of exercise, inspired air conditions, baseline lung func-
tion and time s ince last medication or exercise. This
paper reports the reproducibility of the % f all in FEV
1
and AUC
0-30 min
in response to an exercise protocol
that carefully controlled these variables.
Methods
Subjects: Inclusion/Exclusion Criteria
Subjects were enrolled if they were aged 6-50 years with
a BMI of <35, and reported signs and symptoms sugges-
tive of asthma according to the Nation al Institute of
Health (NIH) Questionnaire [14]. They were required to
have an FEV
1
≥70% of the predicted value at the Screen-
ing Visit [15,16]. Subjects were required to have a
National Asthma Education and Prevention Program
(NAEPPII) asthma severity score of Step 1 with neither
a firm diagnosis of asthma nor an exclusion of the diag-
nosis of asthma. Step 1 of NAEPPII is the mildest and is
defined as symptoms ≤2 times per week, asymptomatic
and normal peak expiratory flow measurements between
exacerbations, exacerbations from only a few hours to a
few days, night time symptom frequency of ≤ 2times
per month, FEV
1
or PEF ≥80% predicted and PEF varia-
bility ≤20%.
Subjects were excluded from participation if they: had
any known other pulmonary disease; had smok ed more
than 1 cigarette per wee k within the past year or had a
≥10 pack year smoking history; had a respiratory tract
infection within the previous 4 weeks; had been skin
test positive to aeroallergens that were present in the
environment during the time of enrolment and reported
worsening of symptoms when exposed to these aero-
allergens during the study; had been diagnosed at the
Screening Visit as definitively (95 to 100% likelihood)
having or not having asthma; had cl inically significantly
abnormal chest x-ray or ECG; or had failed to observe
washout time of medications that would interfere with
exercise (including, but not limited to, no use of corti-
costeroids within 4 weeks of the Screening Visit).
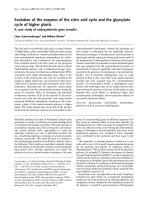
The disposition of the study population is given in
Figure 1. The data presented are from the 375 subject s
in the per protocol population that included all subjects
with no major protocol violations previously reported
[13]. Of the 375 subjects, two c ompleted only one ex er-
cise challenge leaving 373 who completed two exercise
tests; there were 95 children and 278 adults.
Procedures
The protocol was approved by institutional review boards
and performed at 25 sites in the USA. Each subject or
parent gave written informed consent or assent for min-
ors <18 years of age. At screening the following were
assessed: e ligibility; demography; med ical history; medi-
cations; spirometry with reversibility (following 360 mcg
of albuterol/salbutamol from a pressurised metered dose
inhaler); and allergy skin-prick testing to 10 common
allergens (positive test taken as a wheal size ≥3mm
of the control). The NIH NAEPPII Questionnaire was
administered and a score was assigned.
Exercise was performed on two separate occasions
beginning 1 - 4 days after the screening visits and within
2 hrs of the same t ime of day. Medication withholding
was confirmed (Table 1), and spirometry was measured
to determine consistency with values obtained at screen-
ing as previously described [13]. The exercise was per-
formed on consecutive visits (2 and 3) with the second
challenge being in 1 - 4 days after the first. FEV
1
needed
to be >70% predicted and within 15% of FEV
1
at screen-
ing in order for an exercise challenge to be performed.
Exercise protocol
Exercise was performed by running on a motorized tread-
mill while breathing medical grade dry air (20-25°C) from
a reservoir (Douglas Bag) via a two-way non-rebreathing
valve [17]. Subjects began by walking then running with
the treadmill speed at 2.5 mph with 2.5% incline. Speed
and incline were increased over 2 minutes so that heart
rate (HR) reached 80-90% of predicted maximum (220-
age) and then was maintained for 6 minutes for a total
duration of 8 minutes. T his intensity aimed to achieve a
ventilation rate be tween 14 and 21 times FEV1 L values
that represent between 40 and 60% of maximum predicted
ventilation (35 × FEV
1
) [18]. The challenge c ould
be stopped at any time. HR was monitored during and for
30 min after exercise.
Anderson et al. Respiratory Research 2010, 11:120
/>Page 2 of 12
FEV
1
and FVC were measured before and FEV
1
(not
FVC) was measured 5, 10, 15, and 30 minutes after
exercise. The % fall in FEV
1
was calculated by su btract-
ing the lowest value recorded after exercise taking the
best of two acceptable attempts at each time point, from
the value measured immediately before exercise,
expressed as a percentage of the pre-exercise value.
Values were not rounded; a 9.99% fall was considered
negative. A subject was deemed positive if there was a
fall of ≥10% in FEV
1
at one time point on at least one
of the two exercise challenges [3,4]. Values are report ed
as mean and standard deviation (SD) . Values for FEV
1
post-exercise that remained higher than the pre-exercise
value were censored as 0% falls. The AUC
0-30 min
was
calculated by the trapezoidal method [19] and expressed
as % fall in FEV
1
min
-1
.
Spirometry data were captured by using ClinDataLink
®
(CDL) (CompleWare Corporation, North Liberty, IA)
and met or exceeded the requirements proposed by
American Thoracic Society/European Respiratory
Figure 1 Subject Disposition. Reproduced from Respiratory Research 2009, 10:4 (23 January 2009) with the permission of the authors.
Anderson et al. Respiratory Research 2010, 11:120
/>Page 3 of 12
Society Joint Statement [20]. Calibration was verified
each day at three flow rates before use. WebCDL
® soft-
ware displayed an electronic record of the volume-time
curves, flow-volume displays, and flow-time displays.
An estimate was made of ventilation in the 2
nd
and 6
th
minutes of exercise based on the relationship between
speed and incline of treadmill and oxygen consumption
in ml [21]. The ventilatory equivalent was estimated as
27LperLofVO
2
[22], and ventilation was expressed
as % of maximum voluntary ventilation (MVV). The
estimate of oxygen consumption in mls was:
1.262*weight*(3.5 + (5.36*speed) + (0.24*speed*-
incline)) for running
1.262*weight*(3.5 + (2.68*speed) + (0.48*speed*-
incline)) for walking.
Weight is expressed in kilograms and speed is
expressed in miles per hour. Three miles per hour was
taken to be running.
Statistical Analysis
Reproducibility of the exercise test response was illu-
strated using a Bland-Altman-type plot [23] and calcu-
lated using the method of Chinn [24]. In brief, the
standard deviation of a single measurement was calcu-
lated by dividing the standard deviation of the differences
in % fall in FEV
1
values between the two tests (i.e. 7.6 for
the whole group) by the square root of 2 giving a 5.4%
fall, from which we calculated a 95% probability interval
of ± 10.8%. This interval defines a 95% probability that
the difference between any single measurement and the
true value for the subject is within that range. This gives
information about variability of the response that can be
expected in an individual with repeated testing.
Results
Demography
For the per protocol population (n = 375): females com-
prised 51.5%; subjects were 76.3% Caucasian, 8.3% Hispa-
nic and 8.5% Black; subjects had near-normal baseline
spirometry (Table 2); and 7.2% responded positively to a
bronchodilator with ≥12% and ≥200 ml increase in FEV
1
above baseline. The characteristics of the 95 children and
278 adults are summarised in Table 2. The mean NAEP-
PIIasthmascorewas1.22(SD0.52)fortheadultsand
1.21 (0.48) for the children. Positive skin tests to at least
one allergen were seen in 78% of the adults and children.
Reproducibility of the Response
The 373 subjects who completed two exercise challenges
did so within 2.6 ± 3.2 (median 2) days. The agreement
Table 1 Required medication withholding periods for medications before exercise tests
Factor Withholding
Period
Inhaled agents Short acting bronchodilators (isoproterenol, isoetharine, metaproterenol, albuterol, levalbuterol, terbutaline)
(e.g. Proventil® or Ventolin®)
8hr
Inhaled anticholinergics or combination products (e.g. Atrovent® or Combivent®) 1 week
Long acting inhaled bronchodilators (salmeterol, formoterol) (e.g. Serevent® or Foradil®) 2 weeks
Inhaled corticosteroid/long acting inhaled bronchodilator combination (e.g. Advair®) 4 weeks
Oral
bronchodilators
Theophylline 24 hr
Intermediate theophylline 48 hr
Long acting theophylline 48 hr
Standard b-agonist tablets 24 hr
Long acting b-agonist tablets 48 hr
Corticosteroids There is no washout for topical corticosteroids applied to skin unless they are high potency steroids 4 weeks
Other
medications
Hydroxyzine, cetirizine (and other antihistamines) 72 hr
Tiotropium bromide 72 hr
Nasals corticosteroids 1 week
b-blockers 1 week
Cromolyn sodium 2 weeks
Nedocromil 2 weeks
Leukotriene modifiers 6 weeks
Foods Coffee, tea, cola drinks, chocolate (caffeinated foods) 12 hr
Strenuous exercise or exposure to cold air to a level that would be expected to interfere with challenges 12 hr
Tobacco 6hr
Anderson et al. Respiratory Research 2010, 11:120
/>Page 4 of 12
for exercise resp onse was 76.1% wi th 56.8% (212) nega-
tive and 19.3% (72) positive on both challenges.
Seventy-two, 34, and 19 of the 373 subjects had FEV
1
falls of ≥10%, ≥15% ≥20%, respectively on both exercise
challenges.
The reproducibility (95% probability value) of the % fall
in FE V
1
and the AUC % fall in FEV
1
min
-1
for the whole
group and for adults and children separately are given in
Table 3, together with mean and highest falls in FEV
1
.
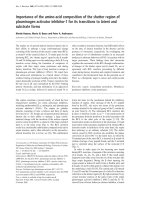
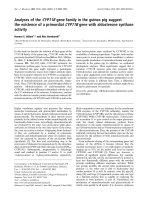
The variation for the response in all the adults and all the
children i s illustrated in F igures 2 and in Figures 3a and
3b for those with ≥10% fall in FEV
1
on both tests.
The reproducibility of the exercise response in relation
to the different NAEPPII scores is given in Table 3.
There was no relationship between the NAEPII score
and th e severity of the response to exercise expressed as
the % fall in FEV
1
after exercise (Figure 4).
Exercise Response
Post-exercise, 163 of the 375 subjects had ≥10% fall in
FEV
1
(mean % fall ± SD was 19.1% ± 9.25 or 610 ±
330 ml) after at least one exercise challenge with 86
having ≥ 15% and 56 ≥ 20% fall in FEV
1
. Those 77 with
very mild EIB i.e. 10 to 15% fall in FEV
1
had a mean fall
of 12.3% ± 1.5 or 395 ± 116 ml. The distribution of the
values for the maximum % fall in FEV
1
isgiveninFig-
ure5.Ofthe163subjects,161completedtwoexercise
challenges with 88 having a fall in FEV
1
of ≥10% at two
or more time points after exercise and 157 having a fall
in FEV
1
≥ 200 ml (median 530 ml). On the first exercise
challenge 119 had ≥10% fall in FEV
1
;67had≥15% fall
in FEV
1
.Ofthose27witha≥12% and 200 ml after
broncho dilator, 10 were positive to and 7 were negat ive
to both exercise challenges, and 10 were positive to only
one challenge.
There were 89 subjects who had a positive test on
only one of two challenges; 45 on the first challenge and
44 on the 2
nd
challenge (Figure 6a). For t he 89 the
mean difference in FEV
1
between the positive and nega-
tive test result was 308 ± 173 ml. For the 44 of 161 sub-
jects identified as positive with a fall in FEV
1
≥10%, only
on the second challenge, 39 (89%) had a fall in F EV
1
≤16% and only three subjects had a fall in FEV
1
> 20%.
Fifty-five of the 373 subjects had only a rise in FEV
1
from baseline on the 1
st
challenge;only7ofthese55
subjects had ≥10% fall in FEV
1
on the 2
nd
challenge.
The mean values for % fall in FEV
1
for adults and
children and for those with two negative (< 10% fall),
two positive (≥10% fall ) and one positive and one nega-
tive test on each occasion are il lustrated Figure 6a.
AUC
0-30 min
associated with these % falls in FEV
1
is
given in Figure 6b. There was no significant difference
in the response to exercise between adults and children.
There was a significant correlation between the maxi-
mum % fall in F EV
1
and the corresponding ‘maximum’
AUC
0-30 min
(r = 0.87, p < 0.001).
Work Load
The exercise load was similar on both tests days. Exer-
cise resulted in a HR, % predicted maximum at 2 and
6 minutes of 82.1% ± 5.6 and 86.6% ± 8.9 on Day 1 and
of 81.5% ± 6.7 and 89.9% ± 6.5 on Day 2 in adults
(p = NS) and 81.9% ± 5.7 and 85.9% ± 10.3 on Day 1
and 81.8% ± 6.3 and 86.7% ± 4.9 on Day 2 in children
(p = NS). There was no significant difference in the esti-
mated ventilation expressed as a % of maximum volun-
tary ventilation between Days 1 and 2 for either the
adults (Day 1 at 2 min 56.8% ± 15. 3 and Day 2 58.0% ±
15.2) and children (Day 1 at 2 min 54.7% ± 13.1 and
Day 2 56.3% ± 11.9).
Table 2 Anthropometric data, forced expiratory volume in one second, and smoking history in the per protocol
population
Children
N = 95 Age (yr) BMI FEV
1
(L) % Pred FEV
1
% Rise Post BD FEV
1
(L) Pack Yrs
N=1
Ht (cm) Wt (kg)
Mean 13.0 21.5 2.83 94.2 6.9 0.43 157.6 54.9
SD 3.0 4.3 0.92 12.5 12.8 16.7 18.2
Range 6-17 13.4-33.1 1.15-5.15 63.7-127.4 0-115 118-192 20-102
Median 14 21.3 2.69 92.2 4.4 158 54.9
Adults
N = 278 Age (yr) BMI FEV
1
(L) % Pred FEV
1
% Rise Post BD FEV
1
(L) Pack Yrs
N=44
Ht (cm) Wt (kg)
Mean 28.2 25.3 3.49 93.4 5.1 3 170.7 74.2
SD 8.8 4.1 0.71 10.2 5.8 2.9 9.7 15.7
Range 18-50 14.7-34.9 1.97-5.62 70.3-140.1 0-51.5 0-9 150-204 38-135
Median 25 25.0 3.38 93.3 3.99 2.5 170 72.3
Anderson et al. Respiratory Research 2010, 11:120
/>Page 5 of 12
There was no significant difference in the HR, % of
predicted maximum at 2 and 6 minutes on the day of
the highest percent fall in FEV
1
of 82.0% ± 5.0 and
87.4% ± 5.0 in adults, and 82.4% ± 5.1 and 86.9% ± 5.1
in children.
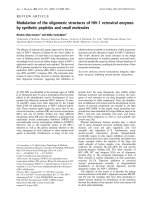
The distribution of the estimated ventilation as % of
MVV during the exercise is shown in Figure 7. The
mean estimated ventilation calculated as a percent of
maximum voluntary ventilation during the 2
nd
and 6
th
minute of the exercise with the highest fall in FEV
1
was
57.3% ± 14.5 and 53.1% ± 12.9 for adults and 54.6% ±
12.9 and 51.1% ± 11.0 for the children. The estimated
ventilation as % of MVV on the 2
nd
exercise test showed
a small (+1.21% MVV) though significantly (< 0.009)
higher v alue compared with the 1
st
test for adults and a
small (+1.35% MVV) but not significantly (P < 0.052)
different value for children.
There was no significant difference between the HR %
predicted and estimated ventilation % MVV between the
test on the day the highest % fall in FEV
1
was documen-
ted, and on the test on the day the lowest % fall in FEV
1
was recorded for the different groups of subjects (data
not shown). There was also no significant difference in
baseline FEV
1
% predicted for the two days in the group
where the % falls in FEV
1
≥10%withbothtests.The
FEV
1
% predicted was higher on the day of the highest
%fallinFEV
1
for all the other groups; however, the
baseline values for FEV
1
% predicted were always above
90% and all the differences were less than 2.4%
predicted.
Discussion
One pr oblem in using an exercise challenge to identify
EIB in the laboratory is ensuring that intensity of
Table 3 Values for the 95% probability interval for % fall in FEV
1
and AUC, highest % fall in FEV
1
, the associated AUC,
mean % fall FEV
1
and the SD of the difference between two tests shown for Groups and for different NAEPP values
%Fall
FEV
1
AUC % fall FEV
1
min
-
1
mean ± SD
Highest
% Fall FEV
1
mean ± SD AUC % fall FEV
1
min
-1
Mean
% fall FEV
1
two
tests
SD
difference
two tests
% fall FEV
1
Whole
Group
n = 373
± 10.8% ± 259% 10.95% ± 9.4 -221% ± 221 8.2 7.6
Adults
n = 278
± 9.7% ± 251% 10.4% ± 8.9 -212% ± 214 7.9 6.9
Children
n=95
± 13.4% ± 279% 12.6% ± 10.5 -249% ± 239 9.3 9.5
2 tests ≥
10%
n=72
± 14.6% ± 373% 24.7% ± 9.7 -525% ± 245 20.8 10.3
2 tests ≥
15%
n=34
± 12.2% ± 411% 29.4 ± 8.5 -613% ± 259 25.9 8.6
2 tests ≥
20%
n=19
± 14.3 ± 470% 34.0 ± 8.2 -707% ± 246 30.1 10.1
1 test ≥ 10%
n=89
± 15.7 ± 370% 14.3 ± 4.8 -289% ± 151 9.4 11.1
2 tests <10%
n = 212
± 5.2% ± 117% 4.9% ± 2.9 -89% ± 75 3.5 3.7
2 tests <
15%
n = 288
± 7.1% ± 168% 6.8% ± 4.2 -132% ± 107 4.9 5.0
NAEPP
Scores
NAEPP = 1
n = 309
±10.7% ± 252% 10.7% ± 9.2 -206% ± 211 8.1 7.5
NAEPP > 1
n=64
± 11.4% ± 289% 12.0% ± 10.1 -249% ± 248 9.1 8.1
NAEPP = 2
n=48
± 10.3% ± 284% 10.3% ± 8.9 -228% ± 252 7.8 7.3
NAEPP = 3
n=16
± 14.6% ± 312% 17.1 ± 11.8 -313% ± 235 12.9 10.3
Anderson et al. Respiratory Research 2010, 11:120
/>Page 6 of 12
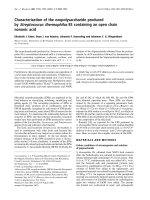
Figure 2 Reproducibility of the % fall in FEV
1
and area under the FEV
1
curve following exercise. The difference between values for % fall
FEV
1
and AUC
0-30 min
% fall FEV
1
per min on the two exercise challenges in relation to the average value for the two challenges in adults (a and
b) and children (c and d). The interval defines the 95% probability that the difference between a single measurement and the true value for the
subject is within that range.
Figure 3 Reproducibility of the % fall in FEV
1
and area under the FEV
1
curve following exercise in subjects positive on both occasions.
The difference between values for a) % fall in FEV
1
; and b) AUC
0-30 min
on the two challenges in relation to the average value on the two
challenges for those who had a fall in FEV
1
≥10% on both challenges. The interval defines the 95% probability that the difference between a
single measurement and the true value for the subject is within that range.
Anderson et al. Respiratory Research 2010, 11:120
/>Page 7 of 12
exercise, exercise duration, and condition of the inspired
air are controlled and are ad equate for eliciting the EIB
response. In this multicentre study exercise duration
was 8 minutes, inspired air was dry, and intensity of
exercise was sufficient for HR to reach the value
required by the protocol, i.e. 80-90% predicted maxi-
mum by the 2
nd
minute of exercise and HR was not sig-
nificantly different on the two test days. Appropriate
times for withdra wal of medic ations were ver ified and
pre-exercise FEV
1
was >70% predicted in all but 2 sub-
jects (both children) and it was similar on both occa-
sions (and was actually greater than a mean of 90%). No
subject had taken inhaled corticoster oids within the last
4 weeks, or long or short- acting beta
2
agonist for
48 hours or 8 hours, respectively. Minimising the differ-
ence in these variables between tests allowed us to
examine the natural variation of the airway response
within a few days . We used one time point ≥10% fall to
identify a positive test because this has been common
practice. However we allow ed a period of 5 minutes for
recovery before the first FEV
1
was measured. We
excluded those who were symptomatic t o the allergens
to which they tested positive to a skin test at the time
to reduce variability due to enviro nmental factors. We
are unaware of any other study that has given this level
of attention to variables when performing two exercise
challenges to identify EIB. Knowledge about normal var-
iation in the exercise resp onse is cr itically important
when interpreting a negative test or when evalu ating an
exercise response to a therapeutic agent.
The ventil ation reache d and sustained during exercise
is a primary determinant of the % fall in FEV
1
[4]. How-
ever equipment for measuring ventilation during e xer-
cise is expensive and heart rate has been preferred to
confirm the intensity of exercise in the Uni ted States of
America. To ensure that subjects r eached the minimum
ventilation (40% of MVV recommended by othe r proto-
cols [4]) we made an estimate of oxygen consumption
from the speed and slope of the treadmill and the
weight of the subject protocols and assumed a ventila-
tory equivalent of 27L of ventilation per L of VO
2
using
published equations [4]. This target ventilation was
achieved between by the 2
nd
minute of exercise and
MVV exceeded 50% in the majority of adults and chil-
dren. While a direct measurement of ventilation would
have been preferable the estimated values, based on the
work load and expressed as a % MVV, at 2 min and
Figure 4 %fallinFEV
1
in relation to NAEPPII severity score.
Individual values for the maximum % fall in FEV
1
after exercise in
relation to the NAEPPII severity grading for asthma.
Figure 5 Distribution of the maximum % fall in FEV
1
. Distribution of the highest % fall in FEV
1
after exercise challenge in 375 subjects.
Anderson et al. Respiratory Research 2010, 11:120
/>Page 8 of 12
Figure 6 %fallinFEV
1
and AUC on the two exer cise tests. The mean and standard deviation for:- a) average % fall FEV
1
on exercise; b)
average AUC
0-30 min
FEV
1
in 373 subjects and for 278 adults and 95 children. The groups are:- those negative, <10% fall in FEV
1
after exercise,
those negative/positive and positive/negative on the 1
st
and 2
nd
challenge, and those with two positive challenges, i.e. ≥10% fall in FEV
1
.
Anderson et al. Respiratory Research 2010, 11:120
/>Page 9 of 12
6 min were the same as the values measured in adults
during 8 minutes of bicycle exercise [25].
As may have been expected from a group of patients
without a definitive diagnosis of asthma, the response to
exercise, when positive, was mild and 77% of the sub-
jects had a fall in FEV
1
< 15% on both exercise chal-
lenges.Inonly34of161subjectsdida≥15% fall occur
on both exercise challenges, a frequency probably con-
sistent with their mild symptoms and indefinite diagno-
sis of asthma. A f all in FEV
1
after e xercise of ≥20% is
the value suggested for inclusion in clinical trials to
evaluate a drug for EIB (FDA Guidance for Industry,
./cder/guidance). This value occurred
on two exercise challenges in only 19 of the 161 subjects
(11.8%) with EIB in this study or only i n 5.1% o f the
subjects who were exercised twice.
For those who had two exercise challenges with falls
greater than 10%, the mean maximum fall after exercise
was 24.7% ± 9.7, leaving little doubt about a diagnosis
of EIB. The reproducibility of the response in this group
was ±14.6% and compares well with the value of ±15.8%
calculated in adults with a n established d iagnosis of
asthma performing repeated exercise on a cycle
ergometer [25].
We assigned a value of 0% fall for those demonstrating
onlyariseinFEV
1
in response to exercise; a post-exer-
cise fall is characteristic of asthma while a post-exercise
rise in FEV
1
is not and occurs in many non-asthmatic
subjects [26]. The mean maximum fall in FEV
1
plus 2SDs
(4.9% ± SD 2.9) for the group with two negative chal-
lenges (e.g. those who had <10% fall in FEV
1
on both
challenges) was 10.7% and similar to that reported for
groups of normal adults or children, without a history of
symptoms of asthma, exercising in ambient air in a
laboratory [2,10,27]. Thus, subjects with an NAEPPII
asthma severity score of ≥ 1 can have a reproducible
response to exercise similar to that of a healthy subject
with no history of asthma
The study results co nfirm that there is little difference
between adults and children for the indices used to
express EIB and we used a value o f 10% in both groups.
However higher cut-off values have been recommended
to identify EIB in children [28,29]. Using the 15% cut
point recommended by Haby [28], the prevalence of EIB
in the children was reduced from 51.5% (49/95) to
28.4% (27/95). We consider that the 5 times difference
inthedegreeofEIBinthosewith≥10% fall in FEV
1
(24.7% ± 9.7) on both occasions and those with ≤10%
fall on both occasions (4.9% ± 2.9) supports the use of a
10% cut-off to include or exclude a definitive diagnosis
of EIB when challenges are repeated over a short period.
We used a cut off point of ≥10% fall in FEV
1
to analyse
the AUC
0-30 min
and its reproducibility. There was also
>5 times difference in the AUC
0-30 m in
between those
with two challenges with ≥10% fall in FEV
1
(-525 ± 245%
FEV
1
min
-1
)comparedwiththosewithtwochallenges
with <10% fall in FEV
1
(-89 ± 75% FEV
1
min
-1
). Based on
the mean plus 2SDs in those with two challenges with
<10% fall in FE V
1
, we suggest an upper cut-off value for
AUC
0-30 min
of 240% fall in FEV
1
min
-1
for a negative
test. The utility of having values for the reproducibility of
AUC
0-30 min
is that there are drugs such as montelukast
that have limited effect on the maximum % fall in FEV
1
but have a profound benefit in enhanc ing recovery of
FEV
1
to baseline [5]. In keeping with others [30] who
reported a smaller group of known asthmatic subjects
over a lo nger period, the values for reproducibility of the
% fall in FEV
1
were superior to the AUC
0-30 min
.
In the 89 subjects posit ive on only one challenge
(Figure 6) we considered that this variation may have
bee n due to a change in the intensity of exercise on the
two test days or perhaps other characteristics of this
group.Howeverthevariationinthe%fallinFEV
1
on
the two test days was not explained by differences in the
ventilation % MVV, HR % predicted maximum. The
FEV
1
% predicted was significantly higher (p < 0.02) on
the day of the positive challenge (92.1% ± 11.3) com-
pared with the day of the negative test (90.2% ± 11.1)
although the difference was small. The variability
between a positive and negative test result may be due
to other factors, perhaps environmental or dietary, or
simply the intrinsic reproducibility of the test itself.
The study group had mild symptoms and signs sug-
gestive of asthma but the NAEPPII grading could not be
relied upon either to identif y EIB or to predict its sever-
ity or reproducibility of the response. However, the
NAEPPII is a score of asthma severity [14] and does not
necessarily include symptoms provoked by exercise.
This may not be important in that other investigators
who have qu estioned subjects specifically about exercise
Figure 7 Distribution of the % of maximum voluntary
ventilation during the 6
th
minute of exercise. Distribution of the
values estimated for percentage of maximum voluntary ventilation
during exercise test on the test when the highest fall in FEV
1
was
measured.
Anderson et al. Respiratory Research 2010, 11:120
/>Page 10 of 12
symptoms have found symptoms alone to be unreliable
predictors of either presence or severity of EIB
[10,31,32].
The data presented here are a secondary analysis of a
previously reported study (NCT0025229 1) [13]. The
protocol required two exercise challenge tests to be per-
formed under the same controlled conditions on conse-
cutive visits prior to a mannitol a nd a methacholine
challenge. All but two subjects of the 375 in the pre-
viously reported st udy performed two challenge tests.
For these reasons this study offered an ideal opportunity
to determine reproducibility of the response to exercise
in a large group in an unbiased manner.
The usefulness of these data are not only in under-
standing that more than one test may be required to
exclude a diagnosis of EIB but also in determining the
benefit of treatment or how severe EIB should be for
inclusion in a drug trial. For example the variability in
the % fall in FEV
1
as expressed by the 95% probability
value for subjects with two tests ≥20%was14.3%and
themean%fallinFEV
1
was 30.3%. That means that on
a second test a subject with a fall o f 30.1% on initial
testing would fall 30.1% ± 14.3% (range 44.4-15.8%) on
a second occasio n ex ercising under identical con ditions
within a few days. Thus for a drug to be regarded as
beneficial the % fall would need to be less than 15.8%
on repeated challenge.
In our subjects with mild symptoms of asthma, good
lung function, and a low response rate to bronchodila-
tor, a single exercise test did not rule out mild EIB
and a second exercise test under the same conditions
identified an extra 44 subjects, 27% of the total posi-
tive, with ≥10% fall in FEV
1
. It is unlikely that repeat
exercise challenge is useful in those recording a rise in
FEV
1
on the initial challenge, as the chance of being
positive on the second test was low and, even when
the exercise challenge was positive, the f alls in FEV
1
were very mild.
Conclusions
The majority of subjects with signs and symptoms sug-
gestive of asthma without a definitive diagnosis will have
the same outcome i.e. positive or negative test result fol-
lowing rechallenge when exercise is standardized for
intensity, duration, and condition of the inspired air.
However a minority will have a positive test result on
onlyoneexercisetest.Thesedataalsoshowthatfor
most subjects the EIB will be mild (< 15% fall in FEV
1
)
and pa rticularly so for those positive on a second chal-
lenge after the first exercise challenge was negative. This
study provides evidence f or the degree of variability in
response to duplicate exercise challenges and suggests
that for some subjects with mild symptoms more than
one test may be required before either a diagnosis of
EIB is exc luded or prophylactic treatment is prescribed.
Finally, these data in a large number of adults indicate
that the reproducibility of the response in adults is simi-
lar to that observed in children.
Abbreviations
AUC
0-30 min
: area under the % fall in FEV
1
time curve; BHR: bronchial
hyperresponsiveness; CDL: ClinDataLink; EIB: exercise-induced
bronchoconstriction; FEV
1
: forced expiratory volume in one second; FVC:
forced vital capacity; ITT: intention to treat; MVV: % of maximum voluntary
ventilation; NAEPPII: National Asthma Education and Prevention Program II:
NIH National Institutes of Health; PPP: per protocol population.
Acknowledgements
The A305 Study Group - Principal Investigators:
Homer Boushey, University of California, CA; Thomas Casale, Creighton
University Allergy Division, Creighton University Medical Center, NE; Linda
Ford, The Asthma and Allergy Center, P.C., NE; Leon Greos, Colorado Allergy
& Asthma Centers, PC, CO; Phillip Halverson, Clinical Research Institute, MN;
Frank Hampel, Central Texas Health Research, TX; Phillip Korenblat, The
Clinical Research Center, MO; Craig LaForce, North Carolina Clinical Research,
NC; Anne-Marie Irani, Children’s Medical Center, VA; Jonathon Matz,
Chesapeake Medical Center, MD; Anjuli Nayak, Sneeze, Wheeze & Itch
Associates, LLC, IL; Nancy Ostrum, Allergy & Asthma Medical Group and
Research Center, CA; David Pearlman, Colorado Allergy and Asthma Centers,
PC, CO; Andrew Pedinoff, Princeton Center for Clinical Research, NJ; Bruce
Prenner, Allergy Associates Medical Group, Inc., CA; Paul Qaqundah, Pediatric
Care Medical Group, Inc. CA; Javier Quesada, West Coast Clinical Trials, CA;
Paul Ratner, Sylvana Research Associates, PA, TX; Kenneth Rundell, Keith J.
O’Neil Center for Healthy Families, Marywood University, PA; Gail Shapiro, A.
S.T.H.M.A., Inc., WA; Christine Sorkness, Allergy and Asthma Clinical Research,
WI; Sheldon Spector, California Allergy and Asthma Medical Group, CA;
Ricardo Tan, California Allergy and Asthma, Palmdale, CA; Steven Weinstein,
Allergy and Asthma Specialists, Medical Group and Research Center, CA;
Robert Ziering, Allergy and Immunology Medical Group, CA;
This study was a Phase III clinical trial study funded by Pharmaxis Ltd, NSW
Australia 2086. Dr. Brett Charlton of Pharmaxis Ltd was involved in designing
the study and identifying the statistics used in the analysis.
Author details
1
Department of Respiratory & Sleep Medicine, 11 West, Royal Prince Alfred
Hospital, Missenden Road, Camperdown NSW 2050, Australia.
2
Sydney
Medical School, University of Sydney, NSW 2006, Australia.
3
Colorado Allergy
and Asthma Centers, Suite 150/125 Rampart Way, Denver CO 80230- 6405,
USA.
4
Professor of The Basic Sciences, The Commonwealth Medical College,
150 North Washington Avenue, Scranton PA, PA 18503-1843, USA.
5
Department of Respiratory & Sleep Medicine, 11 West, Royal Prince Alfred
Hospital, Missenden Road, Camperdown NSW 2050, Australia.
6
Asthma
Clinical Research Center, University of California, San Francisco CA 90089,
USA.
7
Department of Medicine, Allergy and Asthma Clinical Research,
University of Wisconsin, Madison, WI 53705, USA.
8
CompleWare Corporation,
PO Box 3090, North Liberty, IA 52317, USA.
9
Department of Internal
Medicine, University of Iowa, Iowa City, IA52242, USA.
Authors’ contributions
SDA & JMW designed the protocol, DSP, KWR, HB, & CAS were investigators
and exercised the subjects, CP & SN carried out the statistical analysis, SDA
drafted the manuscript but all of the authors contributed to the manuscript.
All authors read and approved the final manuscript.
Authors’ Information
SDA, DSP, KWR, HB & JMW have all published in the field of exercise-
induced bronchoconstriction, both in adults and children, over a long
period of time. They appreciated the opportunity afforded by design of the
protocol standardized for the intensity and duration of exercise, and the
condition of inspired air. This allowed, for the first time, a detailed analysis of
reproducibility in subjects most likely to be referred to a laboratory for
exercise testing to identify EIB, i.e. subjects with mild symptoms of asthma
but without a definite diagnosis.
Anderson et al. Respiratory Research 2010, 11:120
/>Page 11 of 12
Homer Boushey is Chief of the Division of Allergy/Immunology and Director
of the Asthma Clinical Research Center at the University of California.
Competing interests
SDA is the inventor of the mannitol test however the intellectual property is
owned by her employer, the Sydney South West Area Health Service
(SSWAHS). SDA receives a 10% share of the royalties paid to SSWAHS. SDA
has undertaken research studies that were funded by Pharmaxis. She is a
shareholder in Pharmaxis but holds no options. She acts as a consultant to
Pharmaxis for which she has received fees since April 2009.
DSP, KWR, HB, CAS participated in the study through their respective centers
(see below) that received a research grant for study participation from
Pharmaxis Ltd.
CPP owns shares in Pharmaxis Ltd which she herself has purchased. She has
also acted as a paid consultant to Pharmaxis
SN is the statistician employed by CompleWare and carried out the
statistical analysis.
JW is the President of, and is a shareholder in, CompleWare Corporation.
CompleWare received a fee from Pharmaxis Ltd. for services in carrying out
the clinical trial.
There are no other competing interests or conflicts of interest.
Received: 9 April 2010 Accepted: 1 September 2010
Published: 1 September 2010
References
1. Anderson SD: Exercise-induced asthma. In Allergy & Allergic Diseases. Edited
by: Kay AB. Oxford: Blackwell Scientific Publications; 1997:.
2. Kattan M, Thomas CM, Keens TG, Mellis CM, Levison H: The response to
exercise in normal and asthmatic children. J Pediatr 1978, 92(5):718-721.
3. Sterk PJ, Fabbri LM, Quanjer PH, Cockcroft DW, O’Byrne PM, Anderson SD,
Juniper EF, Malo J-L: Airway responsiveness: Standardized challenge
testing with pharmacological, physical and sensitizing stimuli in adults.
Eur Respir J 1993, 6(Suppl 16):53-83.
4. Crapo RO, Casaburi R, Coates AL, Enright PL, Hankinson JL, Irvin CG,
MacIntyre NR, McKay RT, Wanger JS, Anderson SD, Cockcroft DW, Fish JE,
Sterk PJ: Guidelines for methacholine and exercise challenge testing -
1999. Am J Respir Crit Care Med 2000, 161(1):309-329.
5. Kemp JP, Dockhorn RJ, Shapiro GG, Nguyen HH, Reiss TF, Seidenberg BC,
Knorr B: Montelukast once daily inhibits exercise-induced
bronchoconstriction in 6- to 14-year-old children with asthma. J Pediatr
1998, 133(3):424-428.
6. Finnerty JP, Holgate ST: Evidence for the roles of histamine and
prostaglandins as mediators in exercise-induced asthma: the inhibitory
effect of terfenadine and flurbiprofen alone and in combination. Eur
Respir J 1990, 3:540-547.
7. Dahlén B, Roquet A, Inman MD, Karlsson Ö, Naya I, Anstrén G, O’Byrne PM,
Dahlén S-E: Influence of zafirlukast and loratadine on exercise-induced
bronchoconstriction. J Allergy Clin Immunol 2002, 109(5 Pt 1):789-793.
8. Cabral ALB, Conceição GM, Fonseca-Guedes CHF, Martins MA: Exercise-
induced bronchospasm in children. Am J Respir Crit Care Med 1999,
159:1819-1823.
9. Haby MM, Anderson SD, Peat JK, Mellis CM, Toelle BG, Woolcock AJ: An
exercise challenge protocol for epidemiological studies of asthma in
children: comparison with histamine challenge. Eur Respir J 1994, 7:43-49.
10. Rundell KW, Im J, Mayers LB, Wilber RL, Szmedra L, Schmitz HR: Self-
reported symptoms and exercise-induced asthma in the elite athlete.
Med Sci Sports Exerc 2001, 33(2):208-213.
11. Sinclair DG, Sims MM, Hoad NA, Winfield CR: Exercise-induced airway
narrowing in army recruits with a history of childhood asthma. Eur Respir
J 1995, 8(8):1314-1317.
12. Ernst P, Ghezzo H, Becklake MR: Risk factors for bronchial
hyperresponsiveness in late childhood and early adolescence. Eur Respir
J 2002, 20(3):635-639.
13. Anderson SD, Charlton B, Weiler JM, Nichols S, Spector SL, Pearlman DS,
A305 Study Group: Comparison of mannitol and methacholine to predict
exercise-induced bronchoconstriction and a clinical diagnosis of asthma.
Respir Res 2009, 10:4.
14. National Heart Lung and Blood Institute: Expert Panel Report 2: Guidelines
for the Diagnosis and Management of Asthma NIH. Bethesda (MD): NIH
Publications, 1 1997.
15. Polgar G, Promadhat V: Pulmonary Function Testing in Children:
Techniques and Standards. Philadelphia: W.B. Saunders Co 1971.
16. Crapo RO, Morris AH, Gardner RM: Reference spirometric values using
techniques and equipment that meet ATS recommendations. Am Rev
Respir Dis 1981, 123(6):659-664.
17. Weiler JM, Nathan RA, Rupp NT, Kalberg CJ, Emmett A, Dorinsky PM: Effect
of fluticasone/salmeterol administered via a single device on exercise-
induced bronchospasm in patients with persistent asthma. Ann Allergy
Asthma Immunol 2005, 94:65-72.
18. Gandevia B, Hugh Jones P: Terminology for measurements of ventilatory
capacity. Thorax 1957, 12:290-293.
19. Atkinson KA: An Introduction to Numerical Analysis. New York: John Wiley
& Sons, 2 1989.
20. Miller MR, Hankinson JL, Brusasco V, Burgos F, Casaburi R, Coates A,
Crapo R, Enright P, van der Grinten CPM, Gustafsson P, Jensen R,
Johnson DC, MacIntyre N, McKay R, Navajas D, Pedersen OF, Pellegrino R,
Viegi G, Wanger J: Standardisation of spirometry. Eur Respir J 2005,
26(2):319-338.
21. Franklin BA, Balady G: ACSM’s guidelines for exercise testing and
prescription. University of Michigan: Lippincott Williams & Wilkins, 6 2000.
22. Jones NL: Clinical Exercise Testing. Philadelphia: WB Saunders, 4 1997.
23. Bland JM, Altman DG: Statistical methods for assessing agreement
between two methods of clinical measurement. Lancet 1986, 1:307-310.
24. Chinn S: Repeatability and method comparison. Thorax 1991, 46:454-456.
25. Anderson SD, Lambert S, Brannan JD, Wood RJ, Koskela H, Morton AR,
Fitch KD: Laboratory protocol for exercise asthma to evaluate salbutamol
given by two devices. Med Sci Sports Exerc 2001, 33(6):893-900.
26. Godfrey S: Exercise testing in children. London: W.B. Saunders 1974.
27. Helenius IJ, Tikkanen HO, Haahtela T: Occurrence of exercise induced
bronchospasm in elite runners: dependence on atopy and exposure to
cold air and pollen. Br J Sports Med 1998, 32:125-129.
28. Haby MM, Peat JK, Mellis CM, Anderson SD, Woolcock AJ: An exercise
challenge for epidemiological studies of childhood asthma: validity and
repeatability. Eur Respir J 1995, 8(5):729-736.
29. Godfrey S, Springer C, Bar-Yishay E, Avital A: Cut-off points defining
normal and asthmatic bronchial reactivity to exercise and inhalation
challenges in children and young adults. Eur Respir J 1999, 14(3):659-668.
30. Dahlén B, O’Byrne PM, Watson RM, Roquet A, Larsen F, Inman MD:
The
reproducibility and sample size requirements of exercise-induced
bronchoconstriction measurements. Eur Respir J 2001, 17(4):581-588.
31. Rupp NT, Brudno S, Guill MF: The value of screening for risk of exercise-
induced asthma in high school athletes. Ann Allergy 1993, 70:339-342.
32. Holzer K, Anderson SD, Douglass J: Exercise in elite summer athletes:
Challenges for diagnosis. J Allergy Clin Immunol 2002, 110(3):374-380.
doi:10.1186/1465-9921-11-120
Cite this article as: Anderson et al.: Reproducibility of the airway
response to an exercise protocol standardized fo r intensity, duration,
and inspired air conditions, in subjects with symptoms suggestive of
asthma. Respiratory Research 2010 11:120.
Submit your next manuscript to BioMed Central
and take full advantage of:
• Convenient online submission
• Thorough peer review
• No space constraints or color figure charges
• Immediate publication on acceptance
• Inclusion in PubMed, CAS, Scopus and Google Scholar
• Research which is freely available for redistribution
Submit your manuscript at
www.biomedcentral.com/submit
Anderson et al. Respiratory Research 2010, 11:120
/>Page 12 of 12