Báo cáo y học: "Abnormal spatial diffusion of Ca2+ in F508del-CFTR airway epithelial cells" pptx
Bạn đang xem bản rút gọn của tài liệu. Xem và tải ngay bản đầy đủ của tài liệu tại đây (1.21 MB, 17 trang )
BioMed Central
Page 1 of 17
(page number not for citation purposes)
Respiratory Research
Open Access
Research
Abnormal spatial diffusion of Ca
2+
in F508del-CFTR airway
epithelial cells
Fabrice Antigny, Caroline Norez, Anne Cantereau, Frédéric Becq and
Clarisse Vandebrouck*
Address: Institut de Physiologie et Biologie Cellulaires, Université de Poitiers, CNRS, 86022 Poitiers, France
Email: Fabrice Antigny - ; Caroline Norez - ;
Anne Cantereau - ; Frédéric Becq - ;
Clarisse Vandebrouck* -
* Corresponding author
Abstract
Background: In airway epithelial cells, calcium mobilization can be elicited by selective autocrine
and/or paracrine activation of apical or basolateral membrane heterotrimeric G protein-coupled
receptors linked to phospholipase C (PLC) stimulation, which generates inositol 1,4,5-
trisphosphate (IP
3
) and 1,2-diacylglycerol (DAG) and induces Ca
2+
release from endoplasmic
reticulum (ER) stores.
Methods: In the present study, we monitored the cytosolic Ca
2+
transients using the UV light
photolysis technique to uncage caged Ca
2+
or caged IP
3
into the cytosol of loaded airway epithelial
cells of cystic fibrosis (CF) and non-CF origin. We compared in these cells the types of Ca
2+
receptors present in the ER, and measured their Ca
2+
dependent activity before and after
correction of F508del-CFTR abnormal trafficking either by low temperature or by the
pharmacological corrector miglustat (N-butyldeoxynojirimycin).
Results: We showed reduction of the inositol 1,4,5-trisphosphate receptors (IP
3
R) dependent-
Ca
2+
response following both correcting treatments compared to uncorrected cells in such a way
that Ca
2+
responses (CF+treatment vs wild-type cells) were normalized. This normalization of the
Ca
2+
rate does not affect the activity of Ca
2+
-dependent chloride channel in miglustat-treated CF
cells. Using two inhibitors of IP
3
R1, we observed a decrease of the implication of IP
3
R1 in the Ca
2+
response in CF corrected cells. We observed a similar Ca
2+
mobilization between CF-KM4 cells
and CFTR-cDNA transfected CF cells (CF-KM4-reverted). When we restored the F508del-CFTR
trafficking in CFTR-reverted cells, the specific IP
3
R activity was also reduced to a similar level as in
non CF cells. At the structural level, the ER morphology of CF cells was highly condensed around
the nucleus while in non CF cells or corrected CF cells the ER was extended at the totality of cell.
Conclusion: These results suggest reversal of the IP
3
R dysfunction in F508del-CFTR epithelial
cells by correction of the abnormal trafficking of F508del-CFTR in cystic fibrosis cells. Moreover,
using CFTR cDNA-transfected CF cells, we demonstrated that abnormal increase of IP
3
R Ca
2+
release in CF human epithelial cells could be the consequence of F508del-CFTR retention in ER
compartment.
Published: 30 October 2008
Respiratory Research 2008, 9:70 doi:10.1186/1465-9921-9-70
Received: 1 April 2008
Accepted: 30 October 2008
This article is available from: />© 2008 Antigny et al; licensee BioMed Central Ltd.
This is an Open Access article distributed under the terms of the Creative Commons Attribution License ( />),
which permits unrestricted use, distribution, and reproduction in any medium, provided the original work is properly cited.
Respiratory Research 2008, 9:70 />Page 2 of 17
(page number not for citation purposes)
Introduction
The existence of distinct membrane localizations and
multiple isoforms of inositol 1,4,5-trisphosphate (IP
3
)
receptors (IP
3
R) within the same cell type may explain the
complex spatiotemporal patterns of Ca
2+
release from IP
3
-
sensitive calcium pools in epithelial cells. In addition to
requiring IP
3
, IP
3
R are regulated in a biphasic manner by
direct interaction with Ca
2+
, i.e. activation at low concen-
trations (up to 0.3 μM) and inhibition at higher concen-
trations (0.5–1 μM) [1]. The different modes of
interaction of IP
3
R with Ca
2+
are involved in the complex
feedback regulation of the Ca
2+
release [2]. IP
3
R activity is
also regulated by Ca
2+
-independent accessory proteins,
Mg
2+
, redox potential and ATP [3]. Furthermore, a local
Ca
2+
discharge by photolysis of NP-EGTA technique can
activate the IP
3
Rs Ca
2+
release. For example, the type 3
IP
3
R remaining open in the presence of high Ca
2+
concen-
tration, initiates a rapid, large and almost total release of
Ca
2+
from intracellular stores [4]. These properties place
IP
3
Rs at the heart of calcium signalling pathways.
Recent studies have demonstrated higher intracellular
Ca
2+
mobilization in Cystic Fibrosis (CF) compared to
normal human nasal [5] or bronchial [6] epithelia. Cystic
Fibrosis is the most frequent lethal autosomal recessive
genetic disease in Caucasian population. The most com-
mon mutation in CF is a deletion of phenylalanine at
position 508 in the Cystic Fibrosis Transmembrane con-
ductance Regulator protein (F508del-CFTR). F508del-
CFTR protein is misfolded, trapped in the endoplasmic
reticulum (ER) by the ER quality control (ERQC) [7] and
subsequently submitted to proteasomal degradation [8].
In this report we monitored the cytosolic Ca
2+
transients
using the flash photolysis technique to uncage caged Ca
2+
into the cytosol of nitrophenyl-EGTA (NP-EGTA) loaded
human CF nasal epithelial CF15 cells [9], human CF tra-
cheal gland CF-KM4 cells [10] and human non-CF tra-
cheal gland epithelial MM39 cells [11]. We also used the
membrane-permeable UV light photolysis caged IP
3
ana-
logue (iso-Ins(1,4,5)P3/PM) to examine the consequence
on the local IP
3
R Ca
2+
release of rescuing F508del-CFTR by
the pharmacological corrector miglustat [12] and after
culturing cells at low temperature [13].
Materials and methods
Cells
Human nasal epithelial JME/CF15 cells (F508del/
F508del) were grown at 37°C in 5% CO
2
under standard
culture conditions [9]. Human CF and non-CF tracheal
gland serous CF-KM4 and MM39 cells were cultured as
previously described [5]. The CF-KM4 cells transducted
with the lentiviral vector expressing the wild-type CFTR
cDNA [14] (named in this study CF-KM4 reverted), were
generously given by Dr. Christelle Coraux (INSERM
U514, Reims University, IFR53, Reims, France).
Extraction of IP
3
R mRNA and reverse transcription
Total RNA was extracted using RNABle
®
(Eurobio),
according to the protocol provided by the manufacturer
and mRNA was reverse transcribed to cDNA as described
elsewhere [15]. The specific oligonucleotide primers used
for each subtype of the IP
3
Rs are presented Table 1. The
temperature cycling conditions were initial melting at
94°C for 5 min, annealing at 56°C for 2 min followed by
30 cycles of 72°C for 30 s, 94°C for 30 s, annealing of
56°C for 30 s and a final extension at 72°C for 5 min.
Quantification of IP
3
R mRNA by RT-PCR
Quantitative PCR was used to determine the copy num-
bers of IP
3
R1, IP
3
R2, and IP
3
R3 in mRNA extracted from
CF15 cells in different conditions. The IP
3
R mRNA quan-
tities were normalized against β-actin. Quantitative PCR
were performed on the ABI Prism 7700. The specific oli-
gonucleotide primer used for each subtype of the IP
3
Rs is
presented Table 1. For β-actin-cDNA, the primers were 5'-
TGTGGATCGGCGGCTC-3' and 5'-ACTCCTGCTTGCT-
GCTGATCCAT-3' (900 nM for each primer). The probe
taqman FAM used was 5'FAM-TGGCCTCGCTGTCCAC-
CTTCCA-TAMRA3' (200 nM). The temperature cycling
conditions were: initial melting at 94°C for 5 min,
annealing at 56°C for 2 min followed by 30 cycles of
72°C for 30 s, 94°C for 30 s, annealing of 56°C for 30 s
and a final extension at 72°C for 30 s. Each sample was
analysed in triplicate. After PCR was completed, the FAM
fluorescent signal (490 nm) was analysed and converted
into a relative number of copies of target molecules. These
results were expressed by threshold cycle value (Ct =
number of necessary amplification cycle that emitted the
fluorescent signal superior at non specific fluorescence).
Table 1: Specific primers for each IP
3
Rs subtype
Accession number Primer sens Primer anti-sens bp
hlITPR 1 NM_002222 5'-AACCGCTACTC
TGCCCAAAA-3'
5'AGTTTGTTGAGTAGCACTGCGTCT-3' 86
hlITPR 2 NM_002223 5'-GCGATCTGCA
CATCTATGCTG-3'
5'-AAGTATTAATGTA
GGCCCAAGACCTATT-3'
117
hlITPR 3 NM_002224 5'-GGGCTCTCG
GTGCCTGA-3'
5'-GGAGGGCTTGC
GGAGAA-3'
150
Respiratory Research 2008, 9:70 />Page 3 of 17
(page number not for citation purposes)
Immunofluorescence
Cells were incubated with a primary specific antibody. We
used the following primary specific antibody for each IP
3
R
isoform: rabbit anti-IP
3
R1 polyclonal antibody (1:1000,
Affinity Bioreagents), goat anti-IP
3
R2 polyclonal antibody
(1:1000, Santa Cruz Biotechnology), mouse anti-IP
3
R3
monoclonal antibody (1:1000, Santa Cruz Biotechnol-
ogy) and the rabbit anti-calreticulin antibody (1:100,
Stressgen Biotechnologies) for 1 h at room temperature.
Cells were then incubated with the corresponding conju-
gated antibody. In the control, the primary antibody was
omitted. The nuclei were labelled with TOPRO-3 (1:1000,
Interchim). Other details are as described [16].
Imaging of endoplasmic reticulum
Cells were incubated in 0.5 μM ER tracker (FluoProbes
®
)
for 10 min at 37°C. This probe was excited at 488 nm, and
the emission (510 nm) was recorded with a spectral con-
focal station FV 1000 installed on an inverted microscope
IX-81 (Olympus Tokyo, Japan).
Functional assay
Ca
2+
-activated chloride channels activity was assayed on
epithelial cell populations by the iodide (
125
I) efflux tech-
nique as described [12].
Recording global calcium signals
Cells were loaded with 3 μM Fluo-4 acetoxymethyl ester
(FluoProbes
®
) for 20 min at room temperature and
Ca
2+
activity was recorded by confocal laser scanning
microscopy using Bio-Rad MRC 1024. All the experiments
were performed at minimum on two different cell pas-
sages (2 < N < 5), and in each field various cells were
selected. This number of cells is noted n on each histo-
gram. Other details are as described [16].
Monitoring cytosolic Ca
2+
transients induced by uncaging
Ca
2+
Cells were loaded with 3 μM nitrophenyl-EGTA (NP-
EGTA) (Interchim, Montluçon, France) [17] for 40 min,
and 20 min with NP-EGTA plus 3 μM Fluo-4 AM at room
temperature in buffer solution containing: (in mM) 130
NaCl, 5.4 KCl, 2.5 CaCl
2
, 0.8 MgCl
2
, 5.6 glucose, 10
Hepes, pH 7.4 (adjusted with Tris base). Cells were then
washed and allowed to desesterification for 10 min. Ca
2+
transients were monitored using confocal laser scanning
microscope FV1000 (Olympus, France) installed on an
inverted microscope IX-81 (Olympus, Tokyo, Japan) and
equipped with two scanning heads. One is used for imag-
ing Fluo-4 fluorescence with 488 nm line of a multi-line
argon laser using line scan mode, the other allows stimu-
lation (SIMS) with 405 nm diode. XT images were
acquired with ×60/1.2 NA water-immersion objective
with 2× optical zoom (spatial resolution of 0.2 μm/pixel)
and collected using spectral detector within 500–600 nm.
To allow comparison between different experimental con-
ditions, uncaging pulses of the same intensity were deliv-
ered with 5% of 405 nm diode for 500 ms with tornado
scanning mode in a region of interest of 10 pixels diame-
ter (= 2 μm). Simultaneous scanner system of Olympus
FV1000 station allows laser stimulation in a restricted
region while recording Fluo-4 fluorescence images with
no delay and high resolution. As shown on XY images,
laser stimulation with 405 nm diode applied on a
restricted region of interest (yellow circle in Fig. 1A)
induced a localized Ca
2+
increase that propagated
throughout the cell. For high time resolution, intracellular
Ca
2+
images were acquired in a line scan mode during 3 s
(XT image, Fig. 1B) with line scan defined in the center of
stimulation region (XY reference image, Fig. 1A). 500 ms
duration of laser stimulation was chosen for its efficacy to
induce large response with no sign of bleach or saturation
of cellular response. Typical intensity profile of Ca
2+
vari-
ation was then extracted from XT images with FV10-ASW
v1.3 software within a 10 pixels width region to reduce
noise (Fig. 1C). Intensity profiles were normalized by
dividing the fluorescence intensity of each pixel (F) by the
average resting value before stimulation (F0) to generate
an (F-F0/F0) image. With this intensity profile, we com-
pared the different Ca
2+
responses by measuring the area
under the curve (AUC) and the peak value (Fig. 1C).
Caged IP
3
experiments
To activate directly the IP
3
Rs we used the membrane-per-
meable UV light-sensitive caged IP
3
analogue, [D-2,3-O-
Isopropydylidene-6-O-(2-nitro-4,5-dimethoxy)benzyl-
myo-inositol 1,4,5-trisphosphate-hexakis(propionoxyme-
thyl)ester] = iso-Ins(1,4,5)P3/PM. Cells were loaded with
1.5 μM iso-Ins(1,4,5)P3/PM (Alexis Biochemicals) [17]
for 45 min, and still 20 min with iso-Ins(1,4,5)P3/PM
plus 3 μM Fluo-4 AM at room temperature in buffer solu-
tion containing: (in mM) 130 NaCl, 5.4 KCl, 2.5 CaCl
2
,
0.8 MgCl
2
, 5.6 glucose, 10 Hepes, pH 7.4 (adjusted with
Tris base). Cells were then washed and allowed to deses-
terification for 20 min. Ca
2+
transients were monitored
using a confocal laser scanning microscope FV1000
(Olympus, France) in absence of extracellular Ca
2+
. To
allow comparison between different experimental condi-
tions, uncaging pulses of the same intensity were deliv-
ered with 8% of 405 nm diode for 100 ms with tornado
scanning mode in a region of interest of 10 pixels diame-
ter (= 2 μm). Simultaneous scanner system of Olympus
FV1000 station allows laser stimulation in a restricted
region while recording Fluo-4 fluorescence images with
no delay and high resolution. Experiments were con-
ducted at room temperature. Intensity profiles were nor-
malized by dividing the fluorescence intensity of each
pixel (F) by the average resting value before stimulation
(F0) to generate an (F-F0/F0) image. With this intensity
Respiratory Research 2008, 9:70 />Page 4 of 17
(page number not for citation purposes)
profile, we compared the different Ca
2+
responses by
measuring the area under the curve (AUC).
Statistics
Results are expressed as mean ± SEM of n observations.
Sets of data were compared with a Student's t test. Differ-
ences were considered statistically significant when P <
0.05. ns: non significant difference, * P < 0.05, ** P <
0.01, *** P < 0.001. All statistical tests were performed
using GraphPad Prism version 4.0 for Windows (Graph-
pad Software) and Origin version 5.0.
Chemicals
2-APB, decavanadate, cyclosporine A, histamine, ATP,
A23187 and Caffeine are from Sigma. Thapsigargin is
from LC Laboratories. Miglustat and NB-DGJ are from
Toronto Research Chemicals.
Results
Role of IP
3
receptors in local ER Ca
2+
mobilization in
human epithelial cells
We first characterized IP3R isoforms in human nasal epi-
thelial CF15 cells. Using reverse transcription-PCR tech-
nique, we found mRNA for the three isoforms of IP
3
R
(Fig. 2A). Moreover, confocal immunofluorescence
microscopy studies of IP
3
Rs indicated for each isoform a
punctiform and diffuse immunostaining in the cytoplasm
of CF15 cells (Fig. 2B top images). No immunostaining of
IP
3
Rs was detected when the primary antibodies were
omitted (Fig. 2B bottom images). Then, to directly inves-
tigate IP
3
R activity, we used the flash photolysis technique
to uncage caged Ca
2+
into the cytosol of NP-EGTA loaded
CF15 cells [17]. Because the capacity of IP
3
receptors to
release Ca
2+
into the cytosol is influenced, in part, by the
cytosolic local Ca
2+
concentration, a confined discharge of
Ca
2+
by NP-EGTA photolysis induced an activation of
Ca
2+
release by IP
3
receptors. To eliminate Ca
2+
influx, we
performed all experiments in absence of extracellular Ca
2+
(Ca
2+
-free). As described in the method section, images
were acquired in a line scan mode during 3 s (XT image)
with CF15 cells cultured at 37°C (Fig. 3A). The corre-
sponding normalized fluorescence and AUC are shown
Fig. 3B (black line) and C (black bar). To study the contri-
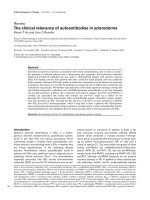
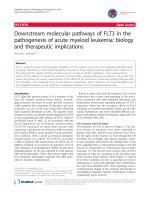
Figure 1
Determination of localized Ca
2+
mobilization by Ca
2+
caged techniqueFigure 1
Determination of localized Ca
2+
mobilization by Ca
2+
caged technique. A Confocal XY images illustrating Ca
2+
release by photolysis of NP-EGTA molecule. The uncaging
pulses were delivered with 5% of 405 nm diode for 500 ms
with tornado scanning mode in a region of interest of 10 pix-
els diameter (yellow circle). Scale bars 25 μm. B XT images
were obtained by acquisition in line scan mode (green line in
A) during 3 s. C Typical intensity profile of Ca
2+
variation was
extracted from XT images presented in B, the grey area rep-
resents the measure of area under the curve (AUC). The
number 1 to 4 represented the Ca
2+
response induce by the
photolysis at different time (in figure 1A and 1C). All the
parameters automatically measured with a computer pro-
gram developed in our laboratory under IDL 5.3 structured
language were represented on the typical intensity profile
(peak and kinetics parameters).
Respiratory Research 2008, 9:70 />Page 5 of 17
(page number not for citation purposes)
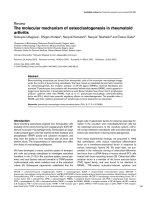
Characterization of IP
3
Rs isoforms in human nasal epithelial cellsFigure 2
Characterization of IP
3
Rs isoforms in human nasal epithelial cells. A mRNA amplification of 3 isoforms of IP
3
R by real
time PCR. B Immunostaining of IP
3
R type 1, 2 and 3 in untreated CF15 cells and staining with the secondary antibody as a neg-
ative control (bottom panels); nuclei are labelled with TOPRO-3, bar = 10 μm.
Respiratory Research 2008, 9:70 />Page 6 of 17
(page number not for citation purposes)
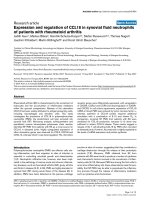
Pharmacology of IP
3
R response of local uncaging of caged Ca
2+
in CF15 cells in absence of extracellular Ca
2+
Figure 3
Pharmacology of IP
3
R response of local uncaging of caged Ca
2+
in CF15 cells in absence of extracellular Ca
2+
. A
Example of line-scan images acquired at 2 ms per line and 0.21 μm per pixel in CF15 cells untreated at 37°C in presence or not
of 100 μM 2-APB, 100 μM decavanadate, 20 mM caffeine or 10 μM cyclosporine A (all were preincubated during 10 min) and
after 2 h incubation with 10 μM thapsigargin (TG). B Average of the line-scan images in A expressed as normalized fluorescence
in each conditions C Mean normalized area measured from XT images in each experimental condition. The dash line represents
the response induced by the flash only, after complete ER Ca
2+
store depletion. Results are presented as mean ± SEM and the
number of experiments is noted on each bar graph. * P < 0.05; ** P < 0.01*** P < 0.001; ns, non significant difference.
Respiratory Research 2008, 9:70 />Page 7 of 17
(page number not for citation purposes)
bution of IP
3
receptors into the local Ca
2+
release in CF15
cells, we used 2-APB and decavanadate [18], two non spe-
cific inhibitors of IP
3
R isoforms. In these experimental
conditions, we observed a decrease by more than 70% of
the Ca
2+
response when we used either 100 μM 2-APB or
100 μM decavanadate (Fig. 3A–C). To prevent the release
of Ca
2+
by IP
3
Rs from the ER, we measured the response
that had been only induced by the flash. We treated cells
2 h with 10 μM thapsigargin (TG) to release the whole
Ca
2+
store. The light stimulation in presence of TG pro-
duced a very small response corresponding only to ~20%
of the response obtained at 37°C (Fig. 3A–B). In presence
of the receptor blockers, these Ca
2+
responses were similar
to the response induced only by the photolysis flash (rep-
resented in Fig. 3C by a dashed black line). These experi-
ments demonstrate that the total Ca
2+
response in human
nasal epithelial CF15 cells is due to the activity of IP
3
receptors.
To discriminate between the different isoforms of IP
3
Rs
implicated in Ca
2+
release, we used two inhibitors of
IP
3
R1 (caffeine, cyclosporine A) in absence of extracellular
Ca
2+
(Fig. 3). Caffeine is known to inhibit the IP
3
R type 1
and to inhibit this isoform at millimolar concentrations
[19]. In our hand, 20 mM caffeine induced an inhibition
of Ca
2+
response limited to the peak intensity (Fig. 3B).
The Ca
2+
quantity mobilized in presence of caffeine
decreased by 30% (Fig. 3C). We also compared the
uncaged Ca
2+
response induced by UV flash photolysis in
presence of cyclosporine A (CsA), an agent known to
abolish type 1 IP
3
R [20]. Cyclosporine A induced a
decrease of peak fluorescence intensity and a decrease of
Ca
2+
quantity mobilization by 45% (Fig. 3B–C). Since, we
have shown previously the absence of ryanodine receptors
in human nasal epithelial cells line [5], the fraction of
Ca
2+
response not inhibited by cyclosporine A or caffeine
probably arose from the two other isoforms of IP
3
R (type
2 and 3) activity.
Consequence on local IP3Rs Ca
2+
activity of rescuing
F508del-CFTR in CF cells
To study the consequence of F508del-CFTR rescue on the
IP
3
R activity, before loading with NP-EGTA, CF15 cells
were either cultured at 27°C during 24 h or incubated 2 h
with a culture medium containing 100 μM miglustat. We
compared the mRNA quantity of each IP
3
R isoform by
quantitative RT-PCR (Fig. 4A), and found no variation of
mRNA for each IP
3
R isoforms whatever the experimental
conditions (Fig. 4A). The activity of IP
3
receptors was then
evaluated. Example of intracellular Ca
2+
XT images are
provided for each experimental condition (Fig. 4B). By
analysis of the XT images, we observed a decrease by ≈
40% and 50% in temperature- (24 h at 27°C, grey trace
and bar) and miglustat-corrected CF15 cells (2 h at 100
μM, green trace and bar), respectively, compared to uncor-
rected CF15 cells (37°C, black trace and bar) (Fig. 4C–D).
We used NB-DGJ, because this compound is not able to
rescue the abnormal trafficking of F508del-CFTR [16]. It is
remarkable that treating CF15 cells with NB-DGJ (2 h at
100 μM) did not modify the Ca
2+
response compared to
untreated CF15 cells as shown by the XT images (Fig. 4B)
and the histograms (blue trace and bar Fig. 4C–D). Fig.
4D also provides the corresponding statistical analysis for
all these experiments. Therefore, these results show that
the rescue of F508del-CFTR either by miglustat or by low
temperature deeply affects the capacity of the ER to release
Ca
2+
into the cytosol of CF15 cells. In each treatment con-
dition, IP
3
R1 inhibition by 10 μM CsA induced a signifi-
cant decrease of Ca
2+
response by 40% in control or NB-
DGJ treated cells (Fig. 4E). In contrast, 10 μM CsA did not
modify the Ca
2+
response in CF15 corrected cells (low
temperature or miglustat treatments) (Fig. 4E).
To complement this study and to confirm our results, we
used two other epithelial cell lines which have another tis-
sue origin: the human tracheal gland serous CF cells (CF-
KM4) and non CF cells (MM39). As in CF15 cells, the RT
PCR technique shows the presence of IP
3
R1, IP
3
R2 and
IP
3
R3 in both human tracheal CF-KM4 and MM39 cells
(Fig. 5A). To confirm the exacerbated ER Ca
2+
release in
CF cells, we also applied the NP-EGTA technique to exam-
ined IP
3
R Ca
2+
dependent activity in MM39 and CF-KM4
cells. The Ca
2+
responses (Fig. 5B–D) showed 40%
increase of the Ca
2+
response in CF-KM4 cells versus non-
CF MM39 cells (black and red traces and histograms,
respectively). Figure 5B shows line-scan XT images
recorded in the absence of extracellular Ca
2+
in MM39
cells and in CF-KM4 cells maintained either at 37°C, or at
37°C for 2 h in presence of miglustat or NB-DGJ. The Ca
2+
response in CF cells was decreased by ≈ 40% after miglus-
tat treatment (Fig. 5B–E, green traces and histograms).
The local Ca
2+
response obtained following miglustat
treatment was similar to that obtained with the non-CF
MM39 cells (Fig. 5C, red traces and histograms). As for
CF15 cells, NB-DGJ did not induce any variation of Ca
2+
response in CF-KM4 cells compared to uncorrected CF-
KM4 cells (Fig. 5D). In fact, the peak of the Ca
2+
responses
was decreased in non CF MM39 cells and miglustat-cor-
rected CF-KM4 cells compared to uncorrected CF-KM4
cells (Fig. 5C, E). Thus, correction of the abnormal
F508del-CFTR trafficking by miglustat induces a profound
modification of IP
3
R Ca
2+
dependent activity in CF cells.
Then, we measured the global ER Ca
2+
release (in absence
of extracellular Ca
2+
) by 100 μM histamine in control or
NB-DGJ treated CF-KM4 or corrected CF-KM4 (by low
temperature or miglustat), and on untreated or miglustat-
treated MM39 cells (Fig. 6A–B). These experiments show
that the Ca
2+
response induced by histamine was
decreased in CF-KM4 cells corrected either by temperature
Respiratory Research 2008, 9:70 />Page 8 of 17
(page number not for citation purposes)
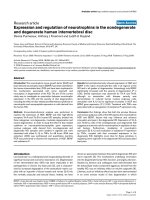
Modification of local stimulation of caged Ca
2+
in corrected F508del-CFTR CF15 cellsFigure 4
Modification of local stimulation of caged Ca
2+
in corrected F508del-CFTR CF15 cells. A Relative mRNA expres-
sion level of IP
3
R-1, IP
3
R-2, and IP
3
R-3 in different conditions compared to βActin mRNA expression. B Example of line-scan
images acquired at 2 ms per line and 0.21 μm per pixel in CF15 cells treated (27°C, miglustat, NB-DGJ and uncorrected at
37°C in absence of extracellular Ca
2+
). C Average of the line-scan images in B expressed as normalized fluorescence in absence
of extracellular Ca
2+
. D Histograms showing the amplitude of IP
3
Rs Ca
2+
response in various experimental conditions as indi-
cated. E Mean normalized area in each experimental treatment in absence or presence of 10 μM CsA. Sets of data were com-
pared to the control CF15. Results are presented as mean ± SEM and the number of experiments is noted on each bar graph.
** P < 0.01, *** P < 0.001; ns, non significant difference.
Respiratory Research 2008, 9:70 />Page 9 of 17
(page number not for citation purposes)
F508del-CFTR correction in CF-KM4 cells restored histamine ER Ca
2+
release compared to non CF MM39 cellsFigure 5
F508del-CFTR correction in CF-KM4 cells restored histamine ER Ca
2+
release compared to non CF MM39
cells. A mRNA amplification of 3 isoforms of IP
3
R by real time PCR in MM39 and CF-KM4 cells. B Example of line-scan images
acquired in MM39 cells and in uncorrected or corrected CF-KM4 cells in absence of extracellular Ca
2+
. These cells were incu-
bated 2 h at 37°C with 100 μM miglustat or 100 μM NB-DGJ. C Average of the line-scan images in A expressed as normalized
fluorescence in each conditions. D Histogram of the normalized area under curve of intensity profile of Ca
2+
response
extracted from A in various experimental conditions as indicated. E Mean of amplitude of Ca
2+
response in each experimental
condition. Results are presented as mean ± SEM and the number of experiments is noted on each bar graph. *** P < 0.001; ns,
non significant difference.
Respiratory Research 2008, 9:70 />Page 10 of 17
(page number not for citation purposes)
F508del-CFTR correction in CF-KM4 cells restored local Ca
2+
wave propagation compared to non CF MM39 cellsFigure 6
F508del-CFTR correction in CF-KM4 cells restored local Ca
2+
wave propagation compared to non CF MM39
cells. A Typical traces of Ca
2+
mobilization in miglustat-treated and untreated CF-KM4 and MM39 during 5 min stimulation by
100 μM histamine in absence of extracellular Ca
2+
. B Histogram of the normalized area under the curve corresponding to the
cytoplasmic Ca
2+
mobilization induced by 100 μM histamine (in 0 mM Ca
2+
) after various treatments. These cells were incu-
bated 2 h at 37°C with 100 μM miglustat (for MM39, CF-KM4 and CF-KM4 reverted cells) or 24 h at 27°C, 100 μM NB-DGJ
for CF-KM4 cells. The number on each bar indicates the number of cells. **P < 0.01, *** P < 0.001; ns, non significant differ-
ence.
Respiratory Research 2008, 9:70 />Page 11 of 17
(page number not for citation purposes)
(by 25%) or miglustat (by 30%), compared to uncor-
rected CF-KM4 cells (Fig. 6A–B). Example tracings are per-
formed Figure 6A. Again, these ER Ca
2+
mobilizations are
similar to that observed with MM39 cells. To emphasize
the specificity of the effect of miglustat, we also noted that
NB-DGJ treatment has no effect on histamine-ER Ca
2+
release (Fig. 6B). Furthermore, the histamine-ER Ca
2+
release in miglustat-treated MM39 cells was similar to the
response observed in untreated MM39 cells (Fig. 6B).
Therefore, the decrease of ER Ca
2+
release observed in
miglustat corrected CF-KM4 cells is not a side effect of
miglustat on Ca
2+
homeostasis but rather the consequence
of F508del-CFTR ER escape.
Direct activation of the IP
3
Rs using cell-permeable IP3 in
human tracheal gland cells
Calcium is known to directly activate IP
3
R and ryanodine
receptors (RYRs), but the sensitivity of the IP
3
receptors to
Ca
2+
depending on a process CICR (Ca
2+
increase Ca
2+
release) requires IP
3
[1]. However, in absence of agonist
stimulation, the level of intracellular IP
3
remains very low.
When we used 10 mM caffeine to activate specifically
RYRs, we did not observe Ca
2+
mobilization, on the con-
trary of 100 μM histamine stimulation (Fig. 7A). These
results indicate that RYRs are absent or not functional in
these human epithelial cell models (CF15, CF-KM4 and
MM39 cells). Then, the Ca
2+
response produced by the
NP-EGTA photolysis was the consequence of the presence
and activity of IP
3
Rs. This explains that the Ca
2+
increase
observed is only measured during the UV photolysis (500
ms). To eliminate these limitation of the NP-EGTA tech-
nique, and to study, more directly, the IP
3
R activity, we
examined the ER Ca
2+
release by UV light photolysis of a
cell-permeable caged iso-Ins(1,4,5)P3/PM in absence of
extracellular Ca
2+
. In CF-KM4 cells, preloaded with iso-
Ins(1,4,5)P3/PM, short exposure (100 ms) to flash pho-
tolysis induced a biphasic increase of [Ca
2+
]
i
. We observed
an initial peak of Ca
2+
release which stabilized during 1 or
2 s, and an increase of Ca
2+
release by a propagation of this
Ca
2+
response at the whole cell level (Fig. 7C). In MM39
and miglustat-treated CF-KM4 cells, the UV photolysis
stimulated a biphasic increase of [Ca
2+
]
i
, but the ampli-
tude of the first peak and Ca
2+
mobilization was reduced
compared to untreated CF-KM4 cells (Fig. 7C and 7D).
Moreover, the second part of Ca
2+
response was stabilized,
and the rise of Ca
2+
release was lower than the response
measured for untreated CF-KM4 cells (Fig. 7C). We
observed the [Ca
2+
]
i
return to a basal concentration
approximately after 15 to 20 s after the UV flash (not
shown). To ensure that the response evoked by exposing
the cells to UV light was not due to phototoxicity or to a
non-specific effect, the experiments were repeated with
CF-KM4 cells loaded with fluo-4 without iso-
Ins(1,4,5)P3/PM. In this experimental condition, expo-
sure to UV flash did not induce an increase in [Ca
2+
]
i
(Fig.
7B). This experimental procedure confirms that the cor-
rection of the abnormal F508del-CFTR trafficking by
miglustat induces a profound modification of IP
3
R Ca
2+
dependent activity in CF cells.
Consequence on IP
3
Rs Ca
2+
activity of F508del-CFTR ER
retention in CF cells
Finally, we used cells derived from CF-KM4 that were sta-
bly transfected to achieve low-level expression of full-
length wild-type CFTR (wt-CFTR) (CF-KM4-reverted).
These CF-KM4-reverted cells have been shown to have
phenotypic correction of a wide range of CF phenotypes
[14]. In fact, this cell line possesses both CFTR proteins:
endogenous F508del-CFTR and transfected wild-type
CFTR (wt-CFTR). When we measured the Ca
2+
mobiliza-
tion induced by a solution of 100 μM histamine in
absence of extracellular Ca
2+
, this Ca
2+
response was also
similar to CF-KM4 cells (Fig. 6B). The Ca
2+
mobilization
induced by UV photolysis of iso-Ins(1,4,5)P3/PM in CF-
KM4-reverted was similar to CF-KM4 cells (Fig. 7C). The
plasma membrane localization of wt-CFTR did not dis-
rupt the sensitivity of IP
3
Rs to the photolysis of iso-
Ins(1,4,5)P3/PM and to agonist response. To restore the
endogenous F508del-CFTR trafficking, we treated these
cells 2 h at 37°C with 100 μM miglustat. In this condition,
the specific IP
3
R activity, measured by Ca
2+
response to
agonist stimulation and by iso-Ins(1,4,5)P3/PM photoly-
sis was reduced to the level measured in non CF cells (Fig.
6B and 7C). This abnormal increase of IP
3
R Ca
2+
release in
CF human epithelial cells compared to non CF cells
appear thus to be the consequence of F508del-CFTR reten-
tion in ER compartment.
Morphology of the ER in non CF and CF cells
To begin to understand the cause of the ER Ca
2+
release
abnormal in CF cells, we examined the ER morphology in
our experimental conditions. In a first set of experiments,
the ER structure was investigated by calreticulin immun-
ofluorescence (Fig. 8A). Calreticulin is an intraluminal ER
protein involved in Ca
2+
sequestration [21]. Figure 8A
shows that the ER remains highly concentrated around
the nucleus in untreated or NB-DGJ-treated CF-KM4 cells.
On the contrary, in MM39 and in miglustat-corrected-CF-
KM4 cells, the ER is spreaded throughout the cells. No
immunostaining of calreticulin was detected when the
primary antibodies were omitted (data not shown). To
verify whether this difference in ER morphology observed
between CF and non CF cells is due to the ER structure or
to a change of calreticulin localization, we also stained the
ER with a specific fluorescent probes (ER tracker) (Fig.
8B). Again, the ER was also found highly concentrated
around the nucleus in untreated and NB-DGJ-treated CF-
KM4 cells, whereas in periphery of the cells the ER net-
work was very thin. On the contrary, in non CF cells or
corrected CF cells, the ER was clearly extended throughout
Respiratory Research 2008, 9:70 />Page 12 of 17
(page number not for citation purposes)
Flash photolysis of iso-Ins(1,4,5)P3/PM induced release from internal stores in human tracheal gland cellsFigure 7
Flash photolysis of iso-Ins(1,4,5)P3/PM induced release from internal stores in human tracheal gland cells. A
Typical traces of Ca
2+
mobilization in CF-KM4 cells during 5 min stimulation by 100 μM histamine or 10 mM caffeine in absence
of extracellular Ca
2+
. B The CF-KM4 cells were loaded with fluo-4 and without iso-Ins(1,4,5)P3/PM and stimulated by UV light.
C Traces show average normalized fluo4 fluorescence recordings in uncorrected or corrected CF-KM4 (incubated 2 h at 37°C
with 100 μM miglustat) and in MM39 cells in absence of extracellular Ca
2+
. These cells were preincubated during 10 min in
presence or not of 100 μM 2-APB. D Histogram of the normalized area under curve of intensity profile of Ca
2+
response in var-
ious experimental conditions as indicated. These cells were incubated 2 h at 37°C with 100 μM miglustat (CF-KM4 and CF-
KM4 reverted cells). Results are presented as mean ± SEM and the number of experiments is noted on each bar graph. * P <
0.05; ** P < 0.01*** P < 0.001; ns, non significant difference.
Respiratory Research 2008, 9:70 />Page 13 of 17
(page number not for citation purposes)
the cell (Fig. 8B). Thus treatment of CF cells with the cor-
rector miglustat induces an ER spreading throughout the
cells.
What is the consequence of the ER Ca
2+
decreased on the
CaCC activity?
Since intracellular Ca
2+
regulates the functionality of
numerous proteins and because the ER Ca
2+
mobilization
was decreased in miglustat-CF cells, we determined
whether these changes in Ca
2+
signalling lead to changes
in the Ca
2+
mediated Cl
-
transport. The Ca
2+
-activated Cl
-
channels (CaCC) are functionally expressed in many non
excitable cells [22,23]. We performed iodide efflux exper-
iments in untreated and miglustat-treated MM39 (Fig. 9A)
and CF-KM4 (Fig. 9B) cells and stimulated the activity of
CaCC by the Ca
2+
ionophore A23187. No variation was
detected following the treatment of cells by miglustat (Fig.
9). Then we examined the activity of CaCC stimulated by
ER Ca
2+
release using two different agonists (ATP and his-
tamine). Again no difference was observed between
untreated vs miglustat treated cells. Taken altogether, and
in spite of the decreased ER Ca
2+
mobilization in miglus-
tat-corrected-CF cells, the activity of CaCC remained unaf-
fected by miglustat.
Discussion
Our study on the regulation of Ca
2+
signalling in human
F508del-CFTR and in corrected CF cells reveals that (i) the
ER morphology in uncorrected or corrected CF human tracheal gland cells compared to non CF human tracheal gland cellsFigure 8
ER morphology in uncorrected or corrected CF human tracheal gland cells compared to non CF human tra-
cheal gland cells. A Immunostaining of calreticulin in untreated CF-KM4, MM39 and miglustat (100 μM 2 h) or NB-DGJ (100
μM 2 h) treated CF-KM4 cells. Nuclei are labelled with TOPRO-3, bar = 10 μm. B ER imaging (with ER tracker probes) in
untreated or miglustat (100 μM 2 h) or NB-DGJ (100 μM 2 h) treated CF-KM4 cells and in untreated MM39 cells, bar = 10 μm.
Respiratory Research 2008, 9:70 />Page 14 of 17
(page number not for citation purposes)
release of ER Ca
2+
store is dependent on the presence of
the three isoforms of IP
3
R, (ii) the activity of IP
3
Rs is
implicated in the propagation of Ca
2+
waves (iii) correc-
tion of the abnormal trafficking of F508del-CFTR in CF
cells regulates local ER Ca
2+
release which is correlated to
a normalization of this local ER Ca
2+
mobilization, (iv)
IP
3
R1 participation in Ca
2+
response is decreased in cor-
rected CF15 cells (v) the ER was spreaded throughout the
cells, i.e. non CF or corrected CF cells compared to uncor-
rected CF cells where the ER was condensed around
ER Ca
2+
release decreased after F508del-CFTR correction, what is the consequence on calcium-activated chloride channel (CaCC) activity?Figure 9
ER Ca
2+
release decreased after F508del-CFTR correction, what is the consequence on calcium-activated chlo-
ride channel (CaCC) activity? A Example of mean iodide efflux for activation of CaCC in miglustat-treated (black symbol)
or not (open symbol) MM39 cells. CaCC were stimulated by 100 μM ATP in 0 mM Ca
2+
bath medium. B Histograms show the
mean relative rate for the experimental conditions (1 μM A23187, 100 μM ATP or 100 μM histamine) indicated below each
bar (n = 4) in miglustat-treated (black bars) or not (open bars) MM39 cells. C Examples of mean iodide efflux for activation of
CaCC in miglustat-treated (black symbol) or not (open symbol) CF-KM4 cells. CaCC were stimulated as for MM39 cells. D
Histograms show the mean relative rate for the experimental conditions indicated below each bar (n = 4) in miglustat-treated
(black bars) or not (open bars) CF-KM4 cells. Results are presented as mean ± S.E.M; ns, non significant difference.
Respiratory Research 2008, 9:70 />Page 15 of 17
(page number not for citation purposes)
nucleus, (vi) the activity of Ca
2+
-dependent Cl
-
channels
are not affected in CF cells, non CF cells, or corrected CF
cells.
We propose that Ca
2+
homeostasis in cystic fibrosis airway
epithelial cells is disturbed and related to the retention in
the ER of F508del-CFTR proteins.
Epithelium from trachea to distal intrapulmonary airways
(bronchioles) presented positive immunoreactivity for all
types of IP
3
Rs [24]. All three isoforms of IP
3
Rs are also
expressed in Madin-Darby canine kidney cells, a well stud-
ied tight polarized epithelial cell type [25]. Thus, in epi-
thelial cell models, multiple isoforms of IP
3
R appeared to
be present in a single cell. In our epithelial models, we
showed the presence of the three isoforms. In CF15 cells
their localisation is comparable, i.e. diffuse in the cyto-
plasm of the cells. Moreover, no variation of IP
3
Rs mRNA
was observed. The three subtypes of IP
3
R Ca
2+
release
channels share basic properties but differ in term of regu-
lation. Type 1 IP
3
R, with both Ca
2+
-dependent activation
and inhibition, is well suited for establishing Ca
2+
oscilla-
tions [1,26,27], where the frequency of Ca
2+
transients can
be modulated when IP
3
concentrations are increased
[27,28]. The effects of CsA are lower in CF15 corrected
cells than in uncorrected CF15 cells; it suggests that the
CsA-sensitive IP
3
R participation in Ca
2+
response was
decreased in CF15 corrected cells.
Human CF primary bronchial epithelial cells and respira-
tory cell lines were reported to produce an exaggerated
proinflammatory cytokine response associated with an
activation of NF-κB [29-31]. Intracellular Ca
2+
is known to
play a central role in production and secretion of Il-8
[32,33]. The IL-1β stimulation induces a prolonged
[Ca
2+
]
i
in IB3-1 cells which was correlated to NF-κB activa-
tion [34]. The deregulation of IP
3
R Ca
2+
release observed
in human nasal and tracheal epithelial cells could be
implicated in increasing inflammatory response observed
in numerous CF cell lines in particular in CF epithelial
cells [6,34].
The apical ER network is expended in human CF bron-
chial epithelial cells compared to ER volume in human
non CF bronchial epithelial cells [6]. In this present study,
the ER staining (by calreticulin immunostainning or ER
tracker probe) shows that the ER structure is highly differ-
ent in CF compared to non CF or CF-corrected cells. The
ER volume seems to be concentrated around the nucleus
in CF cells and expanded throughout the cytoplasm of
non CF and CF-corrected cells. This expansion could be
responsible for the variation in IP
3
R Ca
2+
dependent activ-
ity observed in this present study. Indeed, the display of
ER web could induce probably an augmentation of dis-
tance between IP
3
receptors which would induce a
decrease in the propagation of the Ca
2+
response. Further-
more, the F508del-CFTR correction is causing a potential
redistribution of IP
3
Rs at the ER membrane. We believed
that in corrected CF and non CF cells, IP
3
Rs are more dis-
tant from each others, leading to reduce propagation of
the Ca
2+
wave. Then IP
3
Rs clustering of the ER could facil-
itate the formation of highly sensitive Ca
2+
release sites,
thereby stimulating the Ca
2+
wave initiation and propaga-
tion [35]. For example, in maturation of oocytes, the
modifications in ER clusters are accompanied by an
increase in the sensitivity of Ca
2+
release by IP
3
[36,37].
Moreover, in CF cells IP
3
Rs are closer to each other and the
photolysis induces a long Ca
2+
wave due to a better prop-
agation. Our interpretation of the data obtained with CF-
KM4-reverted cells is that the IP
3
Rs deregulation is not
due to the CFTR absence at the plasma membrane but is
more likely due to the abnormal ER F508del-CFTR reten-
tion. The F508del-CFTR escape of ER by pharmacological
corrector treatment induces the normalization of IP
3
R
Ca
2+
release.
In the airways, pleiotropic consequences accompanied
the production of F508del-CFTR protein generating
vicious cycle of airway obstruction, infection, and inflam-
mation at the origin of most of the morbidity and mortal-
ity in cystic fibrosis. The pro-inflammatory mediator
bradykinin triggers Ca
2+
mobilization [38,39] and induces
interleukin-8 secretion in non-CF and CF human airway
epithelia [40,41]. A mechanism has been proposed to
explain the increase of Ca
2+
signals at the apical mem-
brane in human CF airway epithelia; it results from the
expansion of the ER Ca
2+
store compartment rather than
from a greater number of purinergic receptors [6,40]. We
can confirm these results in our cellular models because
we observed that the kinetics of activation of the Ca
2+
response obtained in NB-DNJ-treated CF cells do not
mimic the effect of the inhibitors of the IP
3
R and we
observed a variation of the ER morphology between non
CF or corrected and uncorrected epithelial cells.
We recently provided evidence that the pharmacological
correction of abnormal trafficking of F508del-CFTR [12]
induces a restoration of Ca
2+
mobilization in CF cells [5].
Here, we showed reduction of the inositol 1,4,5-trisphos-
phate receptors (IP
3
R) dependent-Ca
2+
response follow-
ing two different correcting treatments compared to
uncorrected cells in such a way that Ca
2+
responses
(CF+treatment vs wild-type cells) were normalized. Alto-
gether, these results suggest reversal of the IP
3
R dysfunc-
tion in F508del-CFTR epithelial cells by a
pharmacological correction of the abnormal trafficking of
F508del-CFTR in cystic fibrosis cells.
Respiratory Research 2008, 9:70 />Page 16 of 17
(page number not for citation purposes)
Abbreviations list
AM: Acetoxymethyl; 2-APB: 2-aminoethyoxydiphenyl
borate; CF: cystic fibrosis; CFTR: cystic fibrosis transmem-
brane conductance regulator; ER: endoplasmic reticulum;
IP
3
: inositol 1,4,5-trisphosphate; IP
3
caged: iso-
Ins(1,4,5)P3/PM; IP
3
R: IP
3
receptor; NB-DGJ: N-butylde-
oxygalactojirimycin; NB-DNJ: N-butyldeoxynojirimycin;
NP-EGTA: Nitrophenyl-Ethylene Glycol-bis(β-Aminoe-
thyl ether) N,N,N',N'-Tetraacetic Acid; TG: Thapsigargin;
CsA: Cyclosporine A.
Competing interests
The authors declare that they have no competing interests.
Authors' contributions
FA conducted the experiments, analysed the data and
wrote the draft of the manuscript. CN realized the iodide
efflux experiments. AC helped us to realized confocal
microscopy experiments and analysis. FB and CV revised
the manuscript. All authors read and approved of the final
manuscript.
Acknowledgements
The authors thank Nathalie Bizard, Dr. Sylvie Patri, and Dr. Vincent
Thoreau for expert technical assistance. This work was supported by Vain-
cre la Mucoviscidose (VLM) and CNRS. Fabrice Antigny and Caroline
Norez were supported by a studentship from VLM. The authors thank Dr.
Christelle Coraux for the generous gift of the CF-KM4-reverted cell line.
References
1. Bezprozvanny I, Watras J, Ehrlich BE: Bell-shaped calcium-
response curves of Ins(1,4,5)P3- and calcium-gated channels
from endoplasmic reticulum of cerebellum. Nature 1991,
351:751-754.
2. De Smedt H, Missiaen L, Parys JB, Henning RH, Sienaert I, Vanlingen
S, et al.: Isoform diversity of the inositol trisphosphate recep-
tor in cell types of mouse origin. Biochem J 1997, 322(Pt
2):575-583.
3. Thrower EC, Hagar RE, Ehrlich BE: Regulation of Ins(1,4,5)P3
receptor isoforms by endogenous modulators. Trends Pharma-
col Sci 2001, 22:580-586.
4. Hagar RE, Burgstahler AD, Nathanson MH, Ehrlich BE: Type III
InsP3 receptor channel stays open in the presence of
increased calcium. Nature 1998, 396:81-84.
5. Antigny F, Norez C, Becq F, Vandebrouck C: Calcium homeostasis
is abnormal in cystic fibrosis airway epithelial cells but is nor-
malized after rescue of F508del-CFTR. Cell Calcium 2008,
43:175-183.
6. Ribeiro CM, Paradiso AM, Carew MA, Shears SB, Boucher RC:
Cystic fibrosis airway epithelial Ca2+ i signaling: the mecha-
nism for the larger agonist-mediated Ca2+ i signals in human
cystic fibrosis airway epithelia. J Biol Chem 2005,
280:10202-10209.
7. Pind S, Riordan JR, Williams DB: Participation of the endoplas-
mic reticulum chaperone calnexin (p88, IP90) in the biogen-
esis of the cystic fibrosis transmembrane conductance
regulator. J Biol Chem 1994, 269:12784-12788.
8. Cheng SH, Gregory RJ, Marshall J, Paul S, Souza DW, White GA, et
al.: Defective intracellular transport and processing of CFTR
is the molecular basis of most cystic fibrosis. Cell 1990,
63:827-834.
9. Jefferson DM, Valentich JD, Marini FC, Grubman SA, Iannuzzi MC,
Dorkin HL, et al.: Expression of normal and cystic fibrosis phe-
notypes by continuous airway epithelial cell lines. Am J Physiol
1990, 259:L496-L505.
10. Kammouni W, Moreau B, Becq F, Saleh A, Pavirani A, Figarella C, et
al.
: A cystic fibrosis tracheal gland cell line, CF-KM4. Correc-
tion by adenovirus-mediated CFTR gene transfer. Am J Respir
Cell Mol Biol 1999, 20:684-691.
11. Merten MD, Kammouni W, Renaud W, Birg F, Mattei MG, Figarella
C: A transformed human tracheal gland cell line, MM-39,
that retains serous secretory functions. Am J Respir Cell Mol Biol
1996, 15:520-528.
12. Norez C, Noel S, Wilke M, Bijvelds M, Jorna H, Melin P, et al.: Rescue
of functional delF508-CFTR channels in cystic fibrosis epithe-
lial cells by the alpha-glucosidase inhibitor miglustat. FEBS
Lett 2006, 580:2081-2086.
13. Denning GM, Anderson MP, Amara JF, Marshall J, Smith AE, Welsh
MJ: Processing of mutant cystic fibrosis transmembrane con-
ductance regulator is temperature-sensitive. Nature 1992,
358:761-764.
14. Baconnais S, Delavoie F, Zahm JM, Milliot M, Terryn C, Castillon N,
et al.: Abnormal ion content, hydration and granule expan-
sion of the secretory granules from cystic fibrosis airway
glandular cells. Exp Cell Res 2005, 309:296-304.
15. Auzanneau C, Thoreau V, Kitzis A, Becq F: A Novel voltage-
dependent chloride current activated by extracellular acidic
pH in cultured rat Sertoli cells. J Biol Chem 2003,
278:19230-19236.
16. Norez C, Antigny F, Becq F, Vandebrouck C: Maintaining low
Ca2+ level in the endoplasmic reticulum restores abnormal
endogenous F508del-CFTR trafficking in airway epithelial
cells. Traffic 2006, 7:562-573.
17. Ellis-Davies GC, Kaplan JH: Nitrophenyl-EGTA, a photolabile
chelator that selectively binds Ca2+ with high affinity and
releases it rapidly upon photolysis. Proc Natl Acad Sci USA 1994,
91:187-191.
18. Bultynck G, Sienaert I, Parys JB, Callewaert G, De Smedt H, Boens N,
et al.: Pharmacology of inositol trisphosphate receptors.
Pflugers Arch 2003, 445:629-642.
19. Maes K, Missiaen L, De Smet P, Vanlingen S, Callewaert G, Parys JB,
et al.: Differential modulation of inositol 1,4,5-trisphosphate
receptor type 1 and type 3 by ATP. Cell Calcium 2000,
27:257-267.
20. Genazzani AA, Carafoli E, Guerini D: Calcineurin controls inosi-
tol 1,4,5-trisphosphate type 1 receptor expression in neu-
rons. Proc Natl Acad Sci USA 1999, 96:5797-5801.
21. Michalak M, Mariani P, Opas M: Calreticulin, a multifunctional
Ca2+ binding chaperone of the endoplasmic reticulum. Bio-
chem Cell Biol 1998, 76:779-785.
22. Arreola J, Melvin JE, Begenisich T: Activation of calcium-depend-
ent chloride channels in rat parotid acinar cells. J Gen Physiol
1996, 108:35-47.
23. Jentsch TJ: Chloride channels: a molecular perspective. Curr
Opin Neurobiol 1996, 6:303-310.
24. Sugiyama T, Yamamoto-Hino M, Wasano K, Mikoshiba K, Hasegawa
M: Subtype-specific expression patterns of inositol 1,4,5-tri-
sphosphate receptors in rat airway epithelial cells. J Histochem
Cytochem 1996, 44:1237-1242.
25. Bush KT, Stuart RO, Li SH, Moura LA, Sharp AH, Ross CA, et al.: Epi-
thelial inositol 1,4,5-trisphosphate receptors. Multiplicity of
localization, solubility, and isoforms. J Biol Chem 1994,
269:23694-23699.
26. Dixon CJ, Woods NM, Cuthbertson KS, Cobbold PH: Evidence for
two Ca2(+)-mobilizing purinoceptors on rat hepatocytes.
Biochem J 1990, 269:499-502.
27. Petersen CC, Toescu EC, Potter BV, Petersen OH: Inositol tri-
phosphate produces different patterns of cytoplasmic Ca2+
spiking depending on its concentration. FEBS Lett 1991,
293:179-182.
28. Kaftan EJ, Ehrlich BE, Watras J: Inositol 1,4,5-trisphosphate
(InsP3) and calcium interact to increase the dynamic range
of InsP3 receptor-dependent calcium signaling. J Gen Physiol
1997, 110:529-538.
29. Tabary O, Escotte S, Couetil JP, Hubert D, Dusser D, Puchelle E, et
al.: Genistein inhibits constitutive and inducible NFkappaB
activation and decreases IL-8 production by human cystic
fibrosis bronchial gland cells. Am J Pathol 1999, 155:473-481.
30. Venkatakrishnan A, Stecenko AA, King G, Blackwell TR, Brigham KL,
Christman JW, et al.: Exaggerated activation of nuclear factor-
kappaB and altered IkappaB-beta processing in cystic fibro-
Publish with BioMed Central and every
scientist can read your work free of charge
"BioMed Central will be the most significant development for
disseminating the results of biomedical research in our lifetime."
Sir Paul Nurse, Cancer Research UK
Your research papers will be:
available free of charge to the entire biomedical community
peer reviewed and published immediately upon acceptance
cited in PubMed and archived on PubMed Central
yours — you keep the copyright
Submit your manuscript here:
/>BioMedcentral
Respiratory Research 2008, 9:70 />Page 17 of 17
(page number not for citation purposes)
sis bronchial epithelial cells. Am J Respir Cell Mol Biol 2000,
23:396-403.
31. Weber AJ, Soong G, Bryan R, Saba S, Prince A: Activation of NF-
kappaB in airway epithelial cells is dependent on CFTR traf-
ficking and Cl-channel function. Am J Physiol Lung Cell Mol Physiol
2001, 281:L71-L78.
32. Kuhns DB, Young HA, Gallin EK, Gallin JI: Ca2+-dependent pro-
duction and release of IL-8 in human neutrophils. J Immunol
1998, 161:4332-4339.
33. Marino F, Cosentino M, Fietta AM, Ferrari M, Cattaneo S, Frigo G, et
al.: Interleukin-8 production induced by the endozepine tria-
kontatetraneuropeptide in human neutrophils: role of cal-
cium and pharmacological investigation of signal
transduction pathways. Cell Signal 2003, 15:511-517.
34. Tabary O, Boncoeur E, de Martin R, Pepperkok R, Clement A, Schultz
C, et al.: Calcium-dependent regulation of NF-(kappa)B acti-
vation in cystic fibrosis airway epithelial cells. Cell Signal 2006,
18:652-660.
35. Swillens S, Dupont G, Combettes L, Champeil P: From calcium
blips to calcium puffs: theoretical analysis of the require-
ments for interchannel communication. Proc Natl Acad Sci USA
1999, 96:13750-13755.
36. Kume S, Muto A, Aruga J, Nakagawa T, Michikawa T, Furuichi T, et al.:
The Xenopus IP3 receptor: structure, function, and localiza-
tion in oocytes and eggs. Cell 1993, 73:555-570.
37. Vermassen E, Parys JB, Mauger JP: Subcellular distribution of the
inositol 1,4,5-trisphosphate receptors: functional relevance
and molecular determinants. Biol Cell 2004, 96:3-17.
38. Paradiso AM, Cheng EH, Boucher RC: Effects of bradykinin on
intracellular calcium regulation in human ciliated airway epi-
thelium. Am J Physiol 1991, 261:L63-L69.
39. Kotlikoff MI, Murray RK, Reynolds EE: Histamine-induced cal-
cium release and phorbol antagonism in cultured airway
smooth muscle cells. Am J Physiol 1987, 253:C561-C566.
40. Ribeiro CM, Paradiso AM, Schwab U, Perez-Vilar J, Jones L, O'neal W,
et al.: Chronic airway infection/inflammation induces a Ca2+i-
dependent hyperinflammatory response in human cystic
fibrosis airway epithelia. J Biol Chem 2005, 280:17798-17806.
41. Rodgers HC, Pang L, Holland E, Corbett L, Range S, Knox AJ: Brady-
kinin increases IL-8 generation in airway epithelial cells via
COX-2-derived prostanoids. Am J Physiol Lung Cell Mol Physiol
2002, 283:L612-L618.