Báo cáo y học: "Obesity affects the chondrocyte responsiveness to leptin in patients with osteoarthritis" doc
Bạn đang xem bản rút gọn của tài liệu. Xem và tải ngay bản đầy đủ của tài liệu tại đây (568.74 KB, 9 trang )
Pallu et al. Arthritis Research & Therapy 2010, 12:R112
/>Open Access
RESEARCH ARTICLE
© 2010 Pallu et al.; licensee BioMed Central Ltd. This is an open access article distributed under the terms of the Creative Commons
Attribution License ( which permits unrestricted use, distribution, and reproduction in
any medium, provided the original work is properly cited.
Research article
Obesity affects the chondrocyte responsiveness to
leptin in patients with osteoarthritis
Stéphane Pallu
†1
, Pierre-Jean Francin
†2
, Cécile Guillaume
2
, Pascale Gegout-Pottie
2
, Patrick Netter
2
, Didier Mainard
2
,
Bernard Terlain
2
and Nathalie Presle*
2
Abstract
Introduction: Increasing evidence support the regulatory role of leptin in osteoarthritis (OA). As high circulating
concentrations of leptin disrupt the physiological function of the adipokine in obese individuals, the current study has
been undertaken to determine whether the elevated levels of leptin found in the joint from obese OA patients also
induce changes in the chondrocyte response to leptin.
Methods: Chondrocytes isolated from OA patients with various body mass index (BMI) were treated with 20, 100 or
500 ng/ml of leptin. The expression of cartilage-specific components (aggrecan, type 2 collagen), as well as regulatory
(IGF-1, TGFβ, MMP-13, TIMP 2) or inflammatory (COX-2, iNOS, IL-1) factors was investigated by real-time PCR to evaluate
chondrocyte responsiveness to leptin. Furthermore, the effect of body mass index (BMI) on leptin signalling pathways
was analyzed with an enzyme-linked immunosorbent assay for STATs activation.
Results: Leptin at 20 ng/ml was unable to modulate gene expression in chondrocytes, except for MMP-13 in obese OA
patients. Higher leptin levels induced the expression of IGF-1, type 2 collagen, TIMP-2 and MMP-13. However, the
activity of the adipokine was shown to be critically dependent on both the concentration and the BMI of the patients
with a negative association between the activation of regulated genes and BMI for 100 ng/ml of adipokine, but a
positive association between chondrocyte responsiveness and BMI for the highest leptin dose. In addition, the gene
encoding MMP-13 was identified as a target of leptin for chondrocytes originated from obese patients while mRNA
level of TIMP-2 was increased in leptin-treated chondrocytes collected from normal or overweight patients. The
adipokine at 500 ng/ml triggered signal transduction through a STAT-dependent pathway while 100 ng/ml of leptin
failed to activate STAT 3 but induced STAT 1α phosphorylation in chondrocytes obtained from obese patients.
Conclusions: The current study clearly showed that characteristics of OA patients and more expecially obesity may
affect the responsiveness of cultured chondrocytes to leptin. In addition, the BMI-dependent effect of leptin for the
expression of TIMP-2 and MMP-13 may explain why obesity is associated with an increased risk for OA.
Introduction
Being obese is associated with elevated risks for an array
of chronic diseases including osteoarthritis (OA). The
effect of biomechanical loading on cartilage may explain
part of the increased risk for knee OA in overweight peo-
ple. However, the risk factor for the onset and progres-
sion of OA in non-weight-bearing joints such as hands
has also been shown to be associated with body mass
index (BMI) [1]. In fact, recent studies indicate that adi-
posity rather than simply excess body mass is detrimental
to the knee joint and suggest that metabolic factors asso-
ciated with adiposity may contribute to OA. The fat mass
is associated with the loss of knee cartilage volume and
the reduction in body fat is more closely related to symp-
tomatic relief in knee OA than the loss of body weight [2-
4]. In addition, Wang and colleagues demonstrated that
the risk of primary knee and hip replacement for OA
relates to both adipose mass and central adiposity [5].
Identifying the role of adipose-derived proteins in the
development and progression of joint disorders has been
the aim of increasing investigations, and recent studies
propose leptin as a key mediator linking obesity to OA
* Correspondence:
2
UMR CNRS-UHP 7561, Faculté de Médecine, Avenue de la forêt de Haye, BP
184, 54505 Vandoeuvre-les-Nancy, France
†
Contributed equally
Full list of author information is available at the end of the article
Pallu et al. Arthritis Research & Therapy 2010, 12:R112
/>Page 2 of 9
[2,6,7]. Among adipokines found in the synovial fluid
obtained from OA patients, leptin is the only one for
which joint levels exceed those determined in paired
serum [8,9]. The expression of leptin and its functional
receptor is strongly up-regulated in human OA cartilage
and is related to the grade of cartilage destruction [9,10].
Although leptin may be a local factor able to modulate
chondrocyte functions, its contribution in OA remains
unclear. The adipokine stimulates the expression of
growth factors and the synthesis of extracellular matrix
[10,11]. Beside this stimulatory effect on cartilage pro-
duction, leptin modulates the degradative functions of
the chondrocytes through up-regulation of matrix metal-
loproteases (MMP)-9 and -13 and interleukin (IL)-1
[9,12]. Moreover, leptin was shown to enhance the syn-
thesis of proinflammatory mediators in human OA carti-
lage [13] and to potentiate the IL-1-mediated production
of nitric oxide, which is known to contribute to cartilage
matrix loss [14]. Whatever these ambivalent effects, the
most important evidence for the role of leptin in the
development of OA is the lack of any increased spontane-
ous degenerative changes in obese mice with impaired
leptin signalling compared with lean wild-type mice,
indicating that leptin is required to increase the incidence
of OA due to extreme adiposity [7].
Although previous studies have addressed the potential
role of leptin in OA, the influence of BMI on chondrocyte
response to the adipokine has not been investigated.
Obese OA patients exhibit elevated leptin levels in syn-
ovial fluid and a high expression of leptin in cartilage
compared with lean patients, indicating that local hyper-
leptinemia may be found in the joint. Interestingly, obe-
sity is characterized by a systemic hyperleptinemia
whereas leptin should promote weight loss through its
effects on food intake and energy expenditure in the
hypothalamus. This defect in leptin action in obese indi-
viduals suggests that human obesity may be associated
with central resistance to leptin [15]. The present study
was therefore designed to determine whether such loss of
leptin activity also occurs in cartilage. For this purpose,
chondrocytes isolated from OA patients with various
BMIs ranging from 22 to 40 kg/m
2
were treated with vari-
ous concentrations of leptin (20, 100 and 500 ng/ml). RT-
PCR analysis for genes encoding cartilage components
(aggrecan and type 2 collagen) as well as factors involved
in matrix remodeling, that is insulin growth factor-1
(IGF-1), transforming growth factor-β (TGFβ), MMP-13
and tissue inhibitors of metalloproteinase (TIMPs), or in
inflammation, that is cyclooxygenase-2 (COX-2), induc-
ible nitric oxide synthase (iNOS) and IL-1, were then per-
formed to evaluate chondrocyte responsiveness to leptin.
Materials and methods
Isolation and treatment of human chondrocytes
Articular cartilage samples were obtained from femoral
condyles and tibial plateaus of patients undergoing total
knee replacement surgery (n = 25; mean age 68.9 ± 9.5
years, range 52 to 82 years; mean BMI 31 ± 5.3 kg/m
2
,
range 22.5 to 40.3 kg/m
2
). Knee OA was diagnosed from
clinical and radiologic evaluations based on the American
College of Rheumatology criteria [16]. Detailed clinical
data were obtained from patients regarding grade of
physical activity, BMI, presence of pain, and stiffness and
swelling of the joint. The study protocol conformed to the
ethical guidelines of the Declaration of Helsinki, and
written informed consent was obtained from each partic-
ipant.
Chondrocytes were isolated after a sequential digestion
of cartilage tissues with pronase (0.15%, w/v) (Roche
Applied Science, Mannheim, Germany) for three hours at
37°C and collagenase B (0.2%, w/v) (Roche Applied Sci-
ence, Mannheim, Germany) overnight at 37°C. After cen-
trifugation of the resulting cells and suspension in
Dulbecco's Modified Eagles Medium/Ham's F-12 (Invit-
rogen, Cergy-Pontoise, France) supplemented with 5% (v/
v) fetal calf serum, 100 U/ml penicillin-streptomycin, and
2 mM L-glutamine (Invitrogen, Cergy-Pontoise, France),
chondrocytes were expanded at 37°C in a monolayer in a
humidified atmosphere containing 5% carbon dioxide
until reaching confluence. Human chondrocytes were
seeded thereafter in six-well plates. After overnight star-
vation in serum-free medium and subsequent change of
serum-free culture medium two hours before leptin treat-
ment, chondrocytes were incubated in serum-deprived
medium with or without human recombinant leptin (20,
100 or 500 ng/ml) (R&D Systems, Abingdon, UK) for 24
hours.
RNA isolation and real-time reverse transcriptase-
polymerase chain reaction
Total RNA was extracted from chondrocytes using the
RNeasy Mini Kit (Qiagen, Courtaboeuf, France). The
integrity of the isolated RNA was assessed by ethidium
bromide staining on agarose gel and the concentration
was determined by measurement of the optical density at
260 nm on a NanoDrop ND-1000 Spectrophotometer
(Labtech, Palaiseau, France). RNA samples were then
reverse-transcribed for 1.5 hours at 37°C to complemen-
tary DNA using Moloney murine leukemia virus reverse
transcriptase (M-MLV-RT; 200 U; Gibco BRL, Cergy-
Pontoise, France), deoxynucleotide triphosphates (dNTP;
5 mM), DTT (0.1 M) and anchored 15 mer oligo-dT
primers (100 pmol; MWG biotech SA, Courtaboeuf,
France).
Pallu et al. Arthritis Research & Therapy 2010, 12:R112
/>Page 3 of 9
Gene expression was analyzed by quantitative real-time
PCR (Lightcycler, Roche, Mannheim, Germany) using the
SYBRgreen master mix system (Qiagen, Courtaboeuf,
France). The conditions for amplification were: initial
activation step at 95°C for 15 minutes, denaturation at
94°C for 45 seconds, hybridization of primers at defined
temperature Tm for 45 seconds and elongation at 72°C
for 1 minute. The gene-specific primer pairs optimized
for this method, the Tm as annealing temperature and the
corresponding product size are summarized in Table 1.
As a control of the amplification specificity, melting curve
analysis was performed for each PCR experiment to sepa-
rate the specific product from the non-specific products
(if any). Each run included positive and negative controls.
For standardization of gene expression levels, mRNA
ratios relative to RP29 as housekeeping gene were calcu-
lated, and real-time quantitative data were analyzed using
the ΔΔCt method.
Determination of STATs activation
After treatment of chondrocytes with leptin (100 or 500
ng/ml) for 10 minutes, the nuclear extracts were prepared
using the Nuclear Extract kit (Active motif, Rixensart,
Belgium). Protein concentration was measured by the
BCA protein assay. The activation of the signal trans-
ducer and activator of transcription (STAT) pathway by
leptin was then monitored using an ELISA-based kit spe-
cific for STAT 1α, STAT 3, STAT 5A et 5B (TransAM
STAT family kit, Active motif, Rixensart, Belgium).
Data analysis
Results were expressed as means ± standard error of the
mean of at least three measurements. Statistical analysis
Table 1: Thermal cycling conditions for real time PCR
Gene Sequences Temp (°C) Amplicon size (bp)
Aggrecan Fw TCG AGG ACA GCG AGG CC
Rv TCG AGG GTG TAG CGT GTA GAG A
61 85
Collagen type 2 Fw ATG ACA ATC TGG CTG CCA
Rv CTT CAG GGC AGT GTA CGT
58 200
IGF-1 Fw GTA TTG CGC ACC CCT CAA
Rv TTG TTT CCT GCA CTC CCT CT
57 126
TGFβ Fw TGC GGC AGC TGT ACA TTG A
Rv TGG TTG TAC AGG GCC AGG A
59 186
MMP-13 Fw TGG TGG TGA TGA AGA TGA TTT G
Rv TCT AAG CCG AAG AAA GAC TGC
57 125
TIMP-2 Fw CTT CTT TCC TCC AAC GTC
Rv AAA GCG GTC AGT GAG AAG GA
57 183
COX-2 Fw GCT GGA ACA TGG AAT TAC CCA
Rv CTT TCT GTA CTG CGG GTG GAA
58 98
iNOS Fw ACA AGC CTA CCC CTC CAG AT
Rv TCC CGT CAG TTG GTA GGT TC
59 157
IL-1 Fw GGA CAA GCT GAG GAA GAT GC
Rv TCG TTA TCC CAT GTG TCG AA
57 120
RP 29 Fw AAG ATG GGT CAC CAG CAG GTC TAC TG
Rv AGA CGC GGC AAG AGC GAG AA
59 153
bp, base pairs; COX-2, cyclooxygenase-2; IGF-1, insulin growth factor-1; MMP, matrix metalloproteinase; iNOS, inducible nitric oxide synthase;
Temp, temperature; TGF, transforming growth factor; TIMP, tissue inhibitor of metalloproteinase; IL-1, interleukin-1.
Pallu et al. Arthritis Research & Therapy 2010, 12:R112
/>Page 4 of 9
was conducted with SPSS software (SPSS Inc., Chicago,
IL, USA). Comparisons between treated and untreated
chondrocytes were analyzed using the non-parametric U-
Mann Whitney test. The Spearman's rho correlation
method was used to evaluate the relation between gene
expression and the BMI. A P value less than 0.05 was con-
sidered significant for differences and correlations.
Results
The effect of various leptin treatments was determined in
human OA chondrocytes categorized in two groups
according to the BMI value of the patients from whom
they originated. The treatment group details showing
information on sample size, sex distribution, age and BMI
are reported in Table 2.
Baseline gene expression in non-stimulated chondrocytes
Before examining leptin effects, we investigated the base-
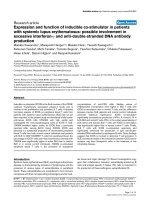
line gene expression pattern in both groups. The results
indicated that non-stimulated chondrocytes obtained
from obese patients overexpressed IGF-1, TGFβ, aggre-
can and TIMP-2 compared with cells provided by normal
or overweight patients (Figure 1). The expression of
MMP-13 was slightly but significantly increased in
patients with BMI of more than 30 kg/m
2
. By contrast, no
significant difference was observed for type 2 collagen or
COX-2, and we failed to detect mRNA for iNOS and IL-1
in untreated cells.
Effect of leptin on gene expression in OA chondrocyte
The recombinant adipokine induced a change in the
expression of genes encoding cartilage-specific elements
and regulating factors depending on the concentration
applied and the BMI of the patients.
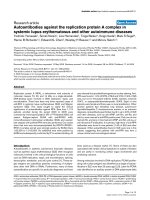
Leptin at 20 ng/ml was unable to significantly modulate
gene expression in chondrocytes, except for MMP-13 in
obese OA patients (Figure 2).
The RT-PCR analysis showed a dose-dependent effect
of leptin on the expression of type 2 collagen. mRNA was
strongly overexpressed in chondrocytes collected from
normal or overweight patients upon treatment with 100
ng/ml of leptin. However, this stimulatory effect did not
exist at 500 ng/ml. By contrast, the highest concentration
of leptin was required to up-regulate type 2 collagen in
chondrocytes isolated from obese patients (Figure 2).
Treatment with 100 ng/ml of leptin of chondrocytes
originated from patients with BMI of more than 30 kg/m
2
slightly but significantly increased the expression of
aggrecan (Figure 2). An elevated level of aggrecan mRNA
was also found at 500 ng/ml of leptin for both BMI
patient groups, but the difference with unstimulated cells
did not reach statistical significance.
The effect of leptin on the expression of growth factors
was different between IGF-1 and TGFβ. The expression
of TGFβ remained unchanged in both groups of patients
whatever the leptin concentration used. By contrast, lep-
tin induced the expression of IGF-1 with a pattern of
response similar to that found for type 2 collagen. The
adipokine at 100 ng/ml increased the mRNA level of IGF-
1 in chondrocytes obtained from normal or overweight
patients (Figure 2). However, this stimulatory effect was
not shown at higher concentration. Chondrocytes from
obese OA patients exhibited an opposite response to the
adipokine with a lack of significant effect on IGF-1
expression at 100 ng/ml but a strong up-regulation of
IGF-1 at 500 ng/ml of leptin (Figure 2).
The gene encoding MMP-13 was not identified as a sig-
nificant target of leptin for chondrocytes originated from
normal or overweight patients. By contrast, leptin dose-
dependently induced the expression of the degradative
enzyme in chondrocytes obtained from obese patients
(Figure 2).
The expression of TIMP-2 in chondrocytes from nor-
mal or overweight patients was highly up-regulated upon
treatment with 100 ng/ml of leptin, as a more than five-
fold increase over the control value was achieved with
this concentration of adipokine. However, the adipokine
did not show any effect when cells derived from patients
with BMI of more than 30 kg/m
2
were stimulated with
500 ng/ml of leptin. Similarly, leptin did not induce any
change in the mRNA level of TIMP-2 in cells isolated
from obese patients (Figure 2).
Further investigations on the effect of leptin on the
expression of inflammatory mediators indicated that the
adipokine was not able to modulate the mRNA level of
Table 2: Details of sample size, sex distribution, age and BMI for each leptin treatment group
Leptin 20 ng/ml Leptin 100 ng/ml Leptin 500 ng/ml
BMI <30 BMI >30 BMI <30 BMI >30 BMI <30 BMI >30
N 5 (3 F, 2 M) 5 (2 F, 3 M) 8 (5 F, 3 M) 11 (7 F, 4 M) 8 (5 F, 3 M) 9 (6 F, 3 M)
Age (years) 69.4 (4.5) 67.8 (4.5) 71.3 (4.1) 68 (2.4) 68.4 (3.5) 67.7 (2.6)
BMI (kg/m
2
) 26.04 (1.02) 33.38 (1.85) 26.78 (0.78) 34.45 (1.10) 26.24 (0.68) 35.44 (1.31)
Values are expressed as mean (standard error of the mean). BMI, body mass index; F, female; M, male.
Pallu et al. Arthritis Research & Therapy 2010, 12:R112
/>Page 5 of 9
iNOS and IL-1. COX-2 was slightly up-regulated by lep-
tin, but the difference with untreated cells reached statis-
tical significance only with chondrocytes obtained from
obese patients and stimulated with 100 ng/ml of leptin.
Role of BMI on leptin effects
The effect of leptin on gene expression was shown to be
dependent on the BMI of patients from whom the cells
were originating. The gene encoding TIMP-2 was
induced in chondrocytes obtained from normal or over-
weight patients while mRNA level of MMP-13 or COX-2
was increased in leptin-treated chondrocytes collected
from obese OA patients. In addition, the BMI changed
the leptin dose-response of chondrocytes. The respon-
siveness found with 100 ng/ml of leptin in chondrocytes
obtained from normal or overweight patients was not
present at the highest concentration of adipokine. By
contrast, leptin up-regulated gene expression in a dose-
dependent manner in chondrocytes collected from obese
OA patients as cells required an elevated level of leptin to
be responsive (Figure 2). Based on this BMI-dependent
leptin dose-response of chondrocytes, we demonstrated
that the stimulatory effect of leptin at 100 ng/ml on the
expression of IGF-1, collagen type 2 and TIMP-2 was
negatively related to the BMI of the patients while a posi-
tive association between chondrocyte responsiveness and
BMI was found at 500 ng/ml of leptin for IGF-1, collagen
type 2 and MMP-13 (Figure 3).
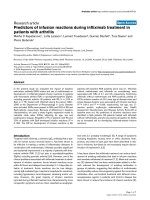
Effect of leptin on the STAT pathway
The activation of STAT has been investigated to deter-
mine whether BMI may affect the leptin signalling path-
way. The highest adipokine concentration induced an
early activation of STAT 1α and STAT 3 (Figure 4). By
contrast, the phosphorylation of STAT 5A and 5B in lep-
tin-stimulated chondrocytes remained unchanged com-
pared with untreated cells (data not shown). Leptin at 100
ng/ml was unable to activate the STAT pathway, except
for STAT 1α in chondrocytes collected from OA patients
with BMI of more than 30 kg/m
2
. The level of STAT acti-
vation increased with the BMI, but the difference
between both groups of patients did not reach statistical
significance.
Discussion
As a defect in leptin action on body weight homeostasis
has been reported for obese individuals despite high
serum leptin concentrations, the current study was
undertaken to determine whether chondrocytes from
obese OA patients that are exposed to elevated leptin lev-
els, exhibit an altered response to leptin.
Before examining the effect of BMI on chondrocyte
responsiveness to leptin, we compared the gene expres-
sion pattern between obese and non obese OA patients.
The RT-PCR analysis showed major changes between
both groups with an elevated mRNA level of growth fac-
tors, aggrecan and TIMP-2 in chondrocytes from obese
patients suggesting that the chondrocyte metabolic activ-
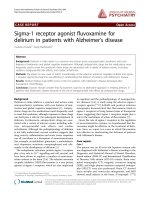
Figure 1 Effect of BMI on the constitutive expression of TGFβ, aggrecan, MMP-13, type 2 collagen, IGF-1, TIMP-2 and COX-2 in chondro-
cytes obtained from OA patients. mRNA levels were determined 24 hours after culture medium change by quantitative real-time PCR. For every
patient, experiments was performed in triplicate. Results were expressed as mean ± standard error of the mean of variation found in obese osteoar-
thritis (OA) patients (body mass index (BMI) >30 kg/m
2
, n = 13) over values obtained in normal or overweight OA patients (BMI <30 kg/m
2
, n = 12). *
P < 0.05 between obese and normal or overweight patients. COX-2, cyclooxygenase-2; IGF-1, insulin growth factor-1; MMP, matrix metalloproteinase;
TGFβ, transforming growth factor-β; TIMP, tissue inhibitor of metalloproteinase.
0
1
2
3
4
5
6
7
8
9
10
TGFȕ Aggrecan MMP-13 Collagen 2 IGF-1 TIMP-2 COX-2
Gene expression (fold)
*
*
*
*
*
Pallu et al. Arthritis Research & Therapy 2010, 12:R112
/>Page 6 of 9
ity is increased with obesity. Such overexpression of
TGFβ, IGF-1 and TIMP-2 has been previously reported
in subcutaneous adipose tissue from obese individuals
[17,18] indicating that chondrocytes may also exhibit an
obesity-related gene expression pattern. These findings
suggest also that a pathological status may result in a sim-
ilar pattern of expression of some factors in both chon-
drocytes and adipocytes. As obesity and OA are both
associated with inflammation, the up-regulation of
growth factors and MMP inhibitors may be an attempt at
an adaptive response to an inflammatory environment.
However, we failed to detect any difference in the expres-
sion of proinflammatory mediators between non-obese
and obese OA patients, suggesting that the chronic low
grade of inflammation associated with obesity rather than
the OA-related joint inflammation is involved in the
overexpression of TGFβ, IGF-1 and TIMP-2 in both
chondrocytes and adipocytes.
The downstream targets of leptin identified in the cur-
rent study are in agreement with those previously pub-
lished because IGF-1, type 2 collagen and MMP-13 were
overexpressed upon leptin stimulation [9-12]. However,
conflicting results were found for the effect of leptin on
the expression of inflammatory mediators. Although
Vuolteenaho and colleagues showed that leptin enhanced
the expression of iNOS in human OA cartilage [13],
iNOS mRNA level remained unchanged in leptin-treated
cells. The use of cartilage explants instead of isolated
chondrocytes may explain the discrepancies because
other authors were unable to find any effect of leptin on
the expression of iNOS in cultured human primary chon-
drocytes [9,14]. Similarly, we failed to detect any change
in the expression of IL-1 whereas Simopoulou and col-
leagues reported a stimulatory effect of leptin on the pro-
duction of the cytokine [9]. In fact, human chondrocytes
required long-term cultures to produce IL-1 suggesting
an indirect leptin-mediated pathway.
One of the most relevant findings arising from this
study is the BMI-dependent effect of leptin on the expres-
sion of the genes encoding TIMP-2 and MMP-13 in
chondrocytes. Our results provided new insights on the
role of leptin in matrix remodeling by regulating the bal-
ance between MMPs and TIMPs, which are the physio-
logic protein inhibitors of the degradative enzymes.
Although TIMP-1 is highly expressed in cartilage and
reduced in OA, we failed to detect any effect of leptin on
its expression (data not shown). By contrast, mRNA lev-
els for TIMP-2 was markedly increased in leptin-treated
chondrocytes compared with control cells. However, this
up-regulation of TIMP-2 was found in normal or over-
weight patients only, and decreased when the BMI of the
patients increased. Besides, MMP-13 was overexpressed
in leptin-stimulated chondrocytes obtained from obese
OA patients, and this was shown from the lowest concen-
tration of leptin. These BMI-dependent effects of leptin
may change the degenerative process during OA. The
leptin-induced TIMP-2 expression may delay cartilage
destruction in non-obese OA patients while the adi-
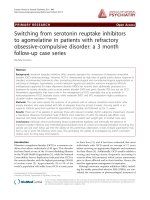
Figure 2 Effect of leptin on the expression of TGFβ, IGF-1, type 2
collagen, aggrecan, TIMP-2, COX-2 and MMP-13 in chondrocytes
obtained from normal or overweight and obese OA patients. Nor-
mal or overweight osteoarthritis (OA) patients: body mass index (BMI)
<30 kg/m
2
; n = 5 for 20 ng/ml and n = 8 for 100 and 500 ng/ml. Obese
OA patients: BMI >30 kg/m
2
; n = 5 for 20 ng/ml, n = 11 for 100 ng/ml
and n = 9 for 500 ng/ml. Quantitative real-time PCR analysis were per-
formed 24 hours after exposure of chondrocytes to 20, 100 or 500 ng/
ml of leptin. For every patient, experiments were carried out in tripli-
cate and results were expressed as means ± standard error of the mean
over control values. * P < 0.05 between leptin-treated and control
chondrocytes. COX-2, cyclooxygenase-2; IGF-1, insulin growth factor-
1; MMP, matrix metalloproteinase; TGFβ, transforming growth factor-β;
TIMP, tissue inhibitor of metalloproteinase.
0
0.5
1
1.5
2
2.5
20ng/ml 100ng/ml 500ng/ml
TGFȕ mRNA (fold)
BMI > 30 kg/m
2
BMI < 30 kg/m
2
0
0.5
1
1.5
2
2.5
3
3.5
4
4.5
20ng/ml 100ng/ml
500ng/ml
IGF-1 mRNA (fold)
*
0
0.5
1
1.5
2
2.5
3
3.5
4
20ng/ml 100ng/ml 500ng/ml
Aggrecan mRNA (fold)
*
0
1
2
3
4
5
6
20ng/ml 100ng/ml
500ng/ml
Collagen 2 mRNA (fold)
*
*
0
1
2
3
4
5
6
7
8
9
20ng/ml 100ng/ml 500ng/ml
TIMP-2 mRNA (fold)
*
0
0.5
1
1.5
2
2.5
3
3.5
4
4.5
5
20ng/ml 100ng/ml
500ng/ml
MMP-13 mRNA (fold)
*
*
*
*
0
0.5
1
1.5
2
2.5
3
20ng/ml 100ng/ml
500ng/ml
COX-2 mRNA (fold)
*
Pallu et al. Arthritis Research & Therapy 2010, 12:R112
/>Page 7 of 9
pokine may enhance cartilage damage in obese OA
patients. It is worth noting that the BMI-dependent effect
of leptin found for genes involved in matrix remodeling
was not showed for COX-2, iNOS or IL-1 suggesting that
the adipokine did not modulate the production of proin-
flammatory mediators in cartilage from obese patients.
The other interesting finding of the study is the influ-
ence of leptin concentration. Among the three concentra-
tions used in the current study, two doses represented the
in vivo situation given that the synovial fluid levels of lep-
tin in patients with OA range from 1 to 100 ng/ml [8]. As
the chondrocyte sensitivity to exogenous stimulating fac-
tor may be reduced when cells are isolated from the
extracellular matrix, a higher leptin dosage was also
tested [19]. Most of the anabolic and catabolic genes were
insensitive to the lowest dose of leptin regardless of BMI,
MMP-13 being the single target of leptin at 20 ng/ml in
obese patients. Beside, the relations between cell respon-
siveness and BMI indicated that chondrocytes collected
from patients with low BMI displayed most responsive-
ness with 100 ng/ml of leptin. This dosage also induced
the expression of genes encoding aggrecan, COX-2 and
MMP-13 in obese patients. However, we were not able to
find any significant correlation between cell responsive-
ness and BMI with these slight stimulatory effects of lep-
tin at 100 ng/ml. The lack of a marked effect of leptin at
20 ng/ml also explains the lack of any association
between chondrocyte response to the adipokine and
BMI. The most striking effects of leptin in obese patients,
that is the up-regulation of IGF-1, collagen type 2 and
MMP-13, were found with the highest concentration of
leptin. Chondrocytes from obese patients may already be
so strongly exposed to elevated leptin levels within the
joint that they are refractory to further stimulation. The
attenuation of leptin sensitivity may result either from a
downregulation of the leptin receptor or from impair-
ments of the signal transduction process. In agreement
with the data obtained by Simopoulou and colleagues [9],
we failed to detect any change in the expression of the
receptor neither between normal or overweight and
obese patients, nor upon stimulation of OA chondrocytes
with 100 or 500 ng/ml of leptin (data not shown). The
activation of the Janus kinase/STAT pathway has been
investigated to determine whether the leptin-induced sig-
Figure 3 Relations between chondrocyte responsiveness to leptin and BMI of OA patients. Chondrocytes were exposed to leptin at (a) 100 ng/
ml or (b) 500 ng/ml and mRNA levels for type 2 collagen, insulin growth factor-1 (IGF-1), tissue inhibitor of metalloproteinase (TIMP)-2 and matrix met-
alloproteinase (MMP)-13 were determined by quantitative real-time PCR. For every patient, experiment was carried out in triplicate, and results were
expressed as means over control values. Correlations were calculated by Spearman's correlation analysis (r, correlation coefficient with p value of cor-
relation). P < 0.05 was considered significant.
0
2
4
6
8
10
12
14
22 27 32 37 42
Collagen 2 mRNA (fold)
BMI (kg/m
2
)
0
2
4
6
8
10
12
14
16
18
20
22 27 32 37 42
BMI (kg/m
2
)
TIMP-2 mRNA (fold)
0
2
4
6
8
10
12
14
22 27 32 37 42
BMI (kg/m
2
)
IGF-1 m RNA (fold)
0
1
2
3
4
5
6
7
22 27 32 37 42
IGF-1 m RNA (fold)
BMI (kg/m
2
)
0
2
4
6
8
10
12
22 27 32 37 42
Collagen 2 mRNA (fold)
BMI (kg/m
2
)
0
1
2
3
4
5
6
7
8
9
10
22 27 32 37 42
MMP-13 mRNA (fold)
BMI (kg/m
2
)
(a)
(b)
r = -0.504
p = 0.0327
r = -0.562
p = 0.0171
r = -0.499
p = 0.0397
r = 0.621
p = 0.0154
r = 0.526
p = 0.0355
r = 0.708
p = 0.0046
Pallu et al. Arthritis Research & Therapy 2010, 12:R112
/>Page 8 of 9
nal transduction process was not impaired [20]. In the
current study, the elevated concentration of leptin actu-
ally induced the phosphorylation of STAT 1α and -3 in
chondrocytes. This STAT activation resulted in the
expression of target genes in chondrocytes issued from
obese patients but was unable to drive gene expression in
cells collected from normal or overweight patients proba-
bly because of a negative feedback inhibition of leptin sig-
naling. By contrast, the adipokine at 100 ng/ml mediated
its effects through a STAT-independent pathway because
this concentration of leptin failed to activate STAT 3.
Other signaling pathways, such as ERK and
phosphatidylinositol3-kinase, may be involved. Leptin
was shown to regulate the differentiation of the ATDC5
chondrogenic cell line through activation of ERK1/2 [21],
and to activate the IRS-1/PI3K/Akt pathway to induce
migration of human chondrosarcoma cells [22]. The
STAT-independent signal transduction process was,
however, disrupted when chondrocytes from obese OA
patients were stimulated with 100 ng/ml of leptin. As
STAT 1 has been found to act as a negative transcrip-
tional regulator [23,24], leptin-induced STAT 1 phospho-
rylation in chondrocytes from obese patients may
interfere with the transcriptional machinery and may lead
to the loss of cell sensitivity to leptin. The responsiveness
to the adipokine was then restored in chondrocytes from
obese patients after activation of STAT 3 by high adi-
pokine level. The relations found in the current study
between BMI and the leptin-induced gene expression,
which are negative for 100 ng/ml of leptin and positive for
the highest leptin level, further support the finding that
leptin may have the ability to differentially regulate the
expression of target genes depending on both the BMI
and the dose.
Conclusions
The current study indicated that MMP-13 was the single
target gene induced by the 20 ng/ml leptin treatment.
More importantly, chondrocytes from obese OA patients
exhibit a response pattern to leptin different from those
collected from normal or overweight patients. Conse-
quently, leptin may protect cartilage from the degenera-
tive process in patients with BMI of more than 30 kg/m
2
through overexpression of genes encoding IGF-1, type 2
collagen and TIMP-2. By contrast, leptin may have a
dualistic effect in obese patients as it up-regulated not
only IGF-1 and type 2 collagen but also MMP-13. This
BMI-dependent effect of leptin may explain why obesity
is a risk factor for OA and further supports the recent
data found by Griffin and colleagues, which showed that
the incidence of knee OA is not increased in extremely
obese leptin-impaired signaling [7]. The current findings
provide therefore new insights to better understand the
relation between obesity and OA, and to use a preventive
approach with dietetic guidelines to reduce the incidence
of OA. They are also a new starting point to identify the
molecular mechanism for the BMI-dependent regulation
of gene expression by leptin.
Abbreviations
BMI: body mass index; COX-2: cyclooxygenase-2; ELISA: enzyme-linked immu-
nosorbent assay; IGF-1: insulin growth factor-1; IL-1: interleukin-1; MMP: matrix
metalloproteinase; iNOS: inducible nitric oxide synthase; OA: osteoarthritis; RT-
PCR: reverse-transcription polymerase chain reaction; STAT: signal transducer
and activator of transcription; TGFβ: transforming growth factor-β; TIMP: tissue
inhibitor of metalloproteinase.
Competing interests
The authors declare that they have no competing interests.
Authors' contributions
SP carried out the experiments and the RT-PCR analysis, performed the statisti-
cal analysis, participated in the interpretation of the data and drafted the man-
uscript. PJF was involved in collecting and preparing samples, performed the
experiments and participated in the interpretation of the data. CG was
involved in collecting and preparing samples, and carried out RT-PCR experi-
ments. PP participated in the design of the study and helped to draft the man-
uscript. PN helped to draft the manuscript. DM recruited the patients and
provided the cartilage specimens and helped to draft the manuscript. BT was
involved in interpretating the data and revising the manuscript critically for
important intellectual content. NP participated in the coordination of the
study and in the interpretation of the data, and drafted the manuscript. All
authors read and approved the final version to be published.
Acknowledgements
This work was supported by grants from INSERM (PROA 2006), from the Con-
trat de Programme de Recherche Clinique, CHU de Nancy, France, from the
Communaute Urbaine du Grand Nancy (CUGN) and from the Conseil General
(CG54).
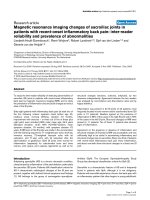
Figure 4 Effect of leptin on the activation of the STAT pathway in
chondrocytes obtained from normal or overweight (BMI <30 kg/
m
2
) and obese (BMI >30 kg/m
2
) OA patients. The phosphorylation
of STAT 1α, -3, -5A and -5B was determined with nuclear proteins ob-
tained from chondrocytes exposed to leptin at 100 ng/ml or 500 ng/
ml for 10 minutes. For every patient, experiments were carried out in
duplicate and results were expressed as means ± standard error of the
mean over control values. * P < 0.05 between leptin-treated and con-
trol chondrocytes. BMI, body mass index; OA, osteoarthritis; STAT, sig-
nal transducer and activator of transcription.
0
2
4
6
8
10
12
STAT 1 STAT 3
STATs activation
(fold)
BMI < 30 kg/m
2
BMI > 30 kg/m
2
100 ng/ml 100 ng/ml500 ng/ml 500 ng/ml
*
*
*
*
*
Pallu et al. Arthritis Research & Therapy 2010, 12:R112
/>Page 9 of 9
Author Details
1
UMR S658 INSERM, Hôpital Porte Madeleine, 1 Rue Porte Madeleine, BP 2439,
45032 Orléans, France and
2
UMR CNRS-UHP 7561, Faculté de Médecine,
Avenue de la forêt de Haye, BP 184, 54505 Vandoeuvre-les-Nancy, France
References
1. Oliveria SA, Felson DT, Cirillo PA, Reed JI, Walker AM: Body weight, body
mass index, and incident symptomatic osteoarthritis of the hand, hip,
and knee. Epidemiology 1999, 10:161-166.
2. Ding C, Parameswaran V, Cicuttini F, Burgess J, Zhai G, Quinn S, Jones G:
Association between leptin, body composition, sex and knee cartilage
morphology in older adults: the Tasmanian older adult cohort
(TASOAC) study. Ann Rheum Dis 2008, 67:1256-1261.
3. Teichtahl AJ, Wluka AE, Wang Y, Hanna F, English DR, Giles GG, Cicuttini
FM: Obesity and adiposity are associated with the rate of patella
cartilage volume loss over two years in adults without knee
osteoarthritis. Ann Rheum Dis 2009, 68:909-913.
4. Toda Y, Toda T, Takemura S, Wada T, Morimoto T, Ogawa R: Change in
body fat, but not body weight or metabolic correlates of obesity, is
related to symptomatic relief of obese patients with knee
osteoarthritis after a weight control program. J Rheumatol 1998,
25:2181-2186.
5. Wang Y, Simpson JA, Wluka AE, Teichtahl AJ, English DR, Giles GG, Graves
S, Cicuttini FM: Relationship between body adiposity measures and risk
of primary knee and hip replacement for osteoarthritis: a prospective
cohort study. Arthritis Res Ther 2009, 11:R31.
6. Pottie P, Presle N, Terlain B, Netter P, Mainard D, Berenbaum F: Obesity
and osteoarthritis: more complex than predicted. Ann Rheum Dis 2006,
65:1403-1405.
7. Griffin TM, Huebner JL, Kraus VB, Guilak F: Extreme obesity due to
impaired leptin signaling in mice does not cause knee osteoarthritis.
Arthritis Rheum 2009, 60:2935-2944.
8. Presle N, Pottie P, Dumond H, Lapicque F, Pallu S, Mainard D, Netter P,
Terlain B: Differential distribution of adipokines between serum and
synovial fluid in patients with osteoarthritis. Contribution of joint
tissues to their articular production. Osteoarthritis Cartilage 2006,
14:690-695.
9. Simopoulou T, Malizos KN, Iliopoulos D, Stefanou N, Papatheodorou L,
Ionnou M, Tsezou A: Differential expression of leptin and leptin's
receptor isoform (Ob-Rb) mRNA between advanced and minimally
affected osteoarthritic cartilage; effect on cartilage metabolism.
Osteoarthritis Cartilage 2007, 15:
872-883.
10. Dumond H, Presle N, Terlain B, Mainard D, Loeuille D, Netter P, Pottie P:
Evidence for a key role of leptin in osteoarthritis. Arthritis Rheum 2003,
48:3118-3129.
11. Figenschau Y, Knutsen G, Shahazeydi S, Johansen O, Sveinbjörnsson B:
Human articular chondrocytes express functional leptin receptors.
Biochem Biophys Res Commun 2001, 287:190-197.
12. Iliopoulos D, Malizos KN, Tsezou A: Epigenetic regulation of leptin affects
MMP-13 expression in osteoarthritic chondrocytes: possible molecular
target for osteoarthritis therapeutic intervention. Ann rheum Dis 2007,
66:1616-1621.
13. Vuolteenaho K, Koskinen A, Kukkonen M, Nieminen R, Päivärinta U,
Moilanen T, Moilanen E: Leptin enhances synthesis of proinflammatory
mediators in human osteoarthritic cartilage-mediator role of NO in
leptin-induced PGE2, IL-6, and IL-8 production. Mediators Inflamm 2009,
2009:345838.
14. Otero M, Lago R, Lago F, Gomez-Reino JJ, Gualillo O: Signalling pathway
in nitric oxide synthase type II activation in chondrocytes: synergistic
effect of leptin with interleukin-1. Arthritis Res Ther 2005, 7:R581-R591.
15. Myers MG, Cowley MA, Münzberg H: Mechanisms of leptin action and
leptin resistance. Annu Rev Physiol 2008, 70:537-556.
16. Altman R, Asch E, Bloch D, Bole G, Borenstein D, Brandt K, Christy W, Cooke
TD, Greenwald R, Hochberg M: Development of criteria for the
classification and reporting of osteoarthritis. Classification of
osteoarthritis of the knee. Diagnostic and therapeutic criteria
committee of the American Rheumatism Association. Arthritis Rheum
1986, 29:1039-1049.
17. Fain JN, Tichansky DS, Madan AK: Transforming growth factor beta 1
release by human adipose tissue is enhanced in obesity. Metabolism
2005, 54:1546-1551.
18. Skopkova M, Penesova A, Sell H, Radikova Z, Vlcek M, Imrich R, Koska J,
Ukropec J, Eckel J, Klimes I, Gasperikova D: Protein array reveals
differentially expressed proteins in subcutaneous adipose tissue in
obesity. Obesity 2007, 15:2396-2406.
19. Cipolletta C, Jouzeau JYJ, Gegout-Pottie P, Presle N, Bordji K, Netter P,
Terlain B: Modulation of IL-1-induced cartilage injury by NO synthase
inhibitors: a comparative study with rat chondrocytes and cartilage
entities. Br J Pharmacol 1998,
124:1719-1727.
20. Frühbeck G: Intracellular signalling pathways activated by leptin.
Biochem J 2006, 393:7-20.
21. Ben-Eliezer M, Phillip M, Gat-Yablonski G: Leptin regulates chondrogenic
differentiation in ATDC5 cell-line through JAK/STAT and MAPK
pathways. Endocrine 2007, 32:235-244.
22. Yang SN, Chen HT, Tsou HK, Huang CY, Huang WH, Su CM, Fong YC, Tseng
WP, Tang CH: Leptin enhances cell migration in human
chondrosarcoma cells through ObRI leptin receptor. Carcinogenesis
2009, 30:566-574.
23. Hogan JC, Stephens JM: The identification and characterization of a
STAT 1 binding site in the PPARγ2 promoter. Biochem Biophys Res
Commun 2001, 287:484-492.
24. Osaki M, Tan L, Choy BK, Yoshida Y, Cheah KSE, Auron PE, Goldring MB: The
TATA-containing core promoter of the type II collagen gene (COL2A1) is
the target of interferon-γ-mediated inhibition in human chondrocytes:
requirement for Stat1α, Jak1 and Jak2. Biochem J 2003, 369:103-115.
doi: 10.1186/ar3048
Cite this article as: Pallu et al., Obesity affects the chondrocyte responsive-
ness to leptin in patients with osteoarthritis Arthritis Research & Therapy 2010,
12:R112
Received: 22 January 2010 Revised: 19 April 2010
Accepted: 9 June 2010 Published: 9 June 2010
This article is available from: 2010 Pallu et al.; licensee BioMed Central Ltd. This is an open access article distributed under the terms of the Creative Commons Attribution License ( which permits unrestricted use, distribution, and reproduction in any medium, provided the original work is properly cited.Arthritis R esearch & Therapy 2010, 12:R112