Báo cáo khoa học: "Economic Aspects of Disease Monitoring with Special Reference to Bovine Paratuberculosis" pdf
Bạn đang xem bản rút gọn của tài liệu. Xem và tải ngay bản đầy đủ của tài liệu tại đây (222.4 KB, 9 trang )
Acta vet. scand. 2001, Suppl. 94, 17-25.
Acta vet. scand. Suppl. 94 - 2001
Economic Aspects of Disease Monitoring with Special
Reference to Bovine Paratuberculosis
By Larry G. Paisley
National Veterinary Institute, Norway. Present address: Danish Veterinary Laboratory, Bülowsvej 27, DK-1790
Copenhagen V, Denmark. Email
Introduction
For many years, the Norwegian cattle popula-
tion was apparently free of paratuberculosis
(PTB). PTB was not diagnosed in Norway dur-
ing the period 1979 through 1996. Because of
import restrictions, no cattle were imported be-
tween 1987 and 1990. From 1991 through
1997, approximately 1200 predominately beef
cattle were imported. In order to prevent the in-
troduction of PTB, all imported cattle were sub-
jected to a 6-month quarantine and required to
be negative for PTB on complement-fixation
tests and fecal cultures. In 1997, sera from 708
of the surviving imported cattle were tested
with a commercial enzyme-linked immunosor-
bant assay (ELISA) (IDEXX Laboratories, Inc.
Westbrook, ME) for antibodies against PTB
with 22 sero-positive results. All reacting ani-
mals were slaughtered and 6 were confirmed to
be infected by culturing Mycobacterium
paratuberculosis from organs or feces. Subse-
quently, the herds with confirmed PTB infec-
tions were slaughtered.
At the request of the Norwegian Animal Health
Authorities, a series of Monte Carlo simulation
models were developed to evaluate the pro-
posed methods and probable outcomes for de-
tecting and eradicating PTB from the imported
cattle and any native cattle that might have been
infected by the imports. A further objective was
to evaluate the feasibility of a national survey to
estimate the herd prevalence of PTB in the
dairy-cattle population.
Monte Carlo simulation models were used to evaluate the feasibility and potential re-
sults of a proposed national survey of the prevalence of bovine paratuberculosis (PTB)
in dairy herds in Norway. The expected herd prevalence was assumed to be 0.2% in the
simulations. Infected herds were classified as detected if 1 animal was sero-positive.
With a sample size of 6000 herds at least 1 truly infected herd was detected in 99% of
the iterations. The low sensitivity of the ELISA test, the assumed low herd prevalence,
the typical low within-herd prevalence of PTB and the small herd sizes in Norway all
present problems in detection of the disease. The results showed that the ratio between
false-positive herds and true positive herds detected had a median of 70:1. At the as-
sumed herd prevalence of 0.2% and a cost/test of 70 NOK the median cost of detecting
1 infected herd was approximately 900,000 NOK. If 2 positive reactors were needed to
classify a herd “infected” the median cost of detecting 1 infected herd was 5,055,000
NOK. Our results suggest that a randomized national prevalence survey would not be
feasible, due to the low probability of detecting infected herds and because of the high
number of false-positive reactions that would be expected.
Mycobacterium paratuberculosis, Bovine paratuberculosis, ELISA, Monte Carlo
simulation, surveillance
This report will describe the models and simu-
lated results for the proposed national dairy sur-
vey.
Material and Methods
Herds surveyed
Because there was political pressure to do so
and to maintain its PTB-free status, a national
survey for PTB in Norway in the dairy cow
population had been proposed. Thus, the herds
chosen for the simulation were dairy herds. A
search of the national data base containing
records of all dairy herds that receive state sub-
sidies resulted in 24,218 dairy herds. Herds
would be randomly selected from this popula-
tion for inclusion in the survey.
Herd size
Data from the national register of dairy herds
that received subsidies was used to construct a
frequency distribution of the herd sizes of the
dairy population. Only cows 2 or more years of
age were included. A cumulative probability
distribution function for the sizes the herds was
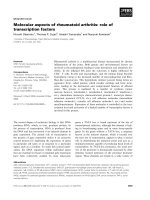
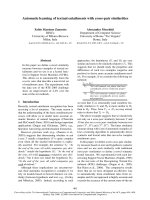
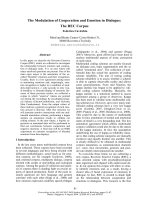
constructed (Vose 1996) (Figure 1). The distri-
bution had a range between 1 and 136 cows.
The distribution contained 21 classes. Twenty
of the classes were of equal size with a differ-
ence of 2 between the fewest and most animals
in the class. The within-class herd sizes in the
these classes were modeled as discrete proba-
bility distributions with each herd size within
each class having an equal probability
(33.34%) of being sampled. These 20 classes
(herd sizes 1-60 cows) represented more
99.99% of the herds. The last class consisted of
a discrete distribution of 19 herds containing
61-136 animals each. In each iteration of the
model, herd sizes (HS) based on these distribu-
tions were generated by Latin Hypercube sam-
pling from the herd-size distributions. If more
than one infected herd was selected in the
model, the size for each herd was generated in-
dependently. The individual herd size was used
to calculate the number of infected animals in
tested herds. All animals greater than 2 years of
age in the herds would be tested.
18
Acta vet. scand. Suppl. 94 - 2001
Figure 1. The figure shows the distribution of the number of cows greater than 2 years of age in Norwegian
dairy herds.
Number of herds tested (NHT)
The number of herds that were tested in the
model was 6000. This number was chosen after
trial runs with fewer herds showed that an in-
fected herd would be detected in less than 99%
of the iterations.
Herd-level prevalence
A fixed herd-level prevalence (HP) of 0.2% was
used in all simulations. This prevalence was
chosen because if a country can document that
the prevalence of a disease <0.2% with a confi-
dence level of 99%, it can be considered free of
that disease (OIE, 1998). If the Norwegian
dairy cattle population is not free of PTB, the
prevalence must be very low because no clini-
cal or laboratory diagnoses have been reported
in two decades.
Number of infected herds in the population
A binomial distribution will calculate the num-
ber of infected herds in n herds based on the
probability p that any herd is infected (Vose
1996). The number of infected herds in the pop-
ulation (IH) was calculated with a binomial (N,
HP) probability distribution function, where N
was the 24,218 herds in the dairy population
and HP was the herd-level prevalence (0.2%).
Within-herd prevalence
The BetaPERT distribution is a re-scaled ver-
sion of the Beta distribution that allows the pa-
rameters to be estimated from minimum, maxi-
mum and most likely values. It is considered the
most appropriate distribution for modeling a
continuous variable based on expert opinion
(Vose, 1996). The within-herd prevalence
(WHP) was modeled as a BetaPERT distribu-
tion function with a minimum of 1%, a maxi-
mum of 50% and a most likely prevalence of
10%. This distribution was chosen based on the
reported within-herd prevalence in several
studies (Collins & Morgan 1991, Collins &
Morgan 1992, Jordan 1996, NAHMS 1996). By
default, all infected herds had at least 1 infected
animal.
ELISA characteristics
Jordan (1996) emphasized that published esti-
mates of test sensitivity and specificity should
be regarded as approximate because they are
derived from cattle that may differ from the
population of interest. The sensitivity of the
ELISA is affected by the stage of the disease
(being highest in animals showing clinical
signs and shedding the organism). Sweeney et
al. (1995) reported a range in sensitivity (SE) of
15% to 87% with an average of 45%. In this
study, the sensitivity of the ELISA was mod-
eled with a BetaPERT distribution with a mini-
mum of 15%, a most likely value of 45%, and a
maximum of 87%. The specificity (SP) of the
ELISA is considered high in comparison to
some other diagnostic tests, but it might be of
concern if large scale testing is contemplated
(Jordan 1996). The specificity was modeled
with a uniform 99.0% to 99.9% distribution.
Number of infected herds tested
The number of infected herds tested (IHT) was
calculated with a hypergeometric (NHT, IH, N)
distribution function where the number of herds
tested (NHT) was 6000. IH was the number of
infected herds in the population and N was
24,218 (Vose 1996).
Number of infected herds detected
The distribution of the number of infected
herds detected (NID) was calculated as follows.
The size of each infected herd tested was gen-
erated, individually, by Latin Hypercube sam-
pling from the herd size distribution. The num-
ber of infected animals in each infected herd
tested (NIT) was individually calculated with a
binomial (HS, WHP). The number of infected
animals in each herd that were detected was
19
Acta vet. scand. Suppl. 94 - 2001
generated with a binomial (NIT, SE) distribu-
tion function where NIT was the number of in-
fected animals tested and SE was the ELISA
sensitivity. By default, all infected herds tested
had at least 1 infected animal tested. If the num-
ber of infected animals detected was greater
than 0 then a 1 was generated. The total number
of times 1 was generated in each iteration was
the total number of infected herds detected. The
probability of detecting an infected herd was
equal to the percentage of iterations when 1 or
more infected herds were detected. Infected
herds were classified as detected if 1 or more in-
fected animals were detected by the test in one
simulation or if 2 or more infected animals were
detected by the test in another simulation. The
sensitivity of the ELISA test on a herd basis
(HSE) was estimated by dividing the number of
infected herds detected in each iteration by the
number of infected herds tested in that iteration.
Number of false positive reactions
The distribution of the number of false positive
reactions was simulated separately. The number
of false positive reactions on a herd basis was
calculated with a binomial (HS, 1-SP) distribu-
tion function where HS was the number of ani-
mals tested. The herd size was generated by
Latin Hypercube sampling from the herd size
distribution and SP was the ELISA specificity
for that iteration. If the number of positive re-
actions generated was greater than 0 the herd
was classified as a false positive herd and a 1
was generated. The percentage of 10,000 itera-
tions when a 1 was generated was the herd
false-positive percentage (HFPP). The herd
level specificity (HSP) was calculated as 1-
HFPP.
Predictive value of the ELISA results
The predictive value of a positive test (PV+) is
defined as the proportion of diseased animals
among those that test positive (Martin et al,
1987). In this model the distribution of the pre-
dictive value of a positive herd test (HPV+) was
calculated with the formula:
HPV+ = HP*HSE/ HP*HSE +1-HP*1-HSP
where HP was the herd-level prevalence
20
Acta vet. scand. Suppl. 94 - 2001
Table 1. Description and distribution of input variables for the Paratuberculosis (PTB) survey models.
Variable Description Distribution
N Number of herds Fixed; 24,218
HP Prevalence of PTB Fixed; 0.2%
IH Number of infected herds Binomial (N,HP)
NHT Number of herds tested Fixed; 6000
IHT Infected herds tested Hypergeometric (NHT,IH,N)
HS Herd size Cumulative (1,136)
WHP Within-herd prevalence BetaPERT (0.01,0.10, 0.50)
NIT Number of infected cows tested Binomial (HS,WHP); Minimum =1
SE Test sensitivity BetaPERT (0.15, 0.45, 0.87)
NID Number of infected detected Binomial(NIT, SE)
HSE Herd test sensitivity NID/NIT
SP Test specificity Uniform (0.99, 0.999)
HSP Herd test specificity 1-herd false positive percentage
NIHT Non-infected herds tested NHT-IHT
NICT Non-infected cows tested NIHT * 12
FP Number of false positive herd tests Binomial (NIHT,1-HSP)
FP:TP False positive: true positive ratio ∑NID/FP
(0.2%), HSE was the distribution of the herd-
level sensitivity and HSP was the distribution of
herd-level specificity.
The predictive value of a negative test (PV-) is
the proportion of non-diseased animals among
those that test negative. The distribution of the
predictive value of a negative herd test (HPV-)
was calculated with the formula:
HPV- = 1-HP*HSP/1-HP*HSP + HP*1-HSE
where HP was the herd-level prevalence
(0.2%), HSP was the distribution of herd-level
specificity and HSE was the distribution of
herd-level sensitivity.
The cost of testing
The cost of testing each sample was set at 70
NOK (1$=7.9 NOK). The initial cost (IC) of
testing was estimated by:
IC=6000*12*70
where 6000 was the number of herds tested, 12
was the median herd size and 70 NOK was the
cost of each ELISA test. It was assumed that all
test positive herds would be re-tested so there
would be an additional cost (AC) that was cal-
culated by:
AC=TPH*12*70
where TPH was the number of test positive
herds, 12 was the median herd size and 70 was
the cost of each ELISA test.
The total cost of testing (TC) was IC+ AC. The
distribution of the cost per true positive herd
detected (CTP) was calculated by:
CTP=TC / number of infected herds detected.
If no infected herds were detected then
CTP=TC.
The simulations
To simulate the sampling and testing for PTB,
@Risk software (Version 3.5e, Palisade Corpo-
ration, Newfield, NY, USA); a risk-analysis
add-in to the Excel spreadsheet of the Mi-
crosoft Corporation, Redmond, WA, USA) was
used. Preliminary runs of the simulation
showed that the outputs changed by <0.5% af-
ter approximately 7500 iterations. However,
greater precision the simulations were run with
21
Acta vet. scand. Suppl. 94 - 2001
Table 2. Outputs of the simulations (10,000 iterations) of the Paratuberculosis survey model with 6000 of
24,218 dairy herds tested.
Percentiles
Variable Minimum 5th 50th 95th Maximum
Number of infected herds in population 20 37 48 60 75
Number of infected herds tested 2 7 12 18 26
Number of animals tested/ herd 1 5 12 24 135
Number of infected animals/herd tested 1 1 1 2 10
Number of infected animals/herd detected 0 0 1 1 8
Number of infected herds detected 0 2 6 11 21
Herd sensitivity (1 positive) 0% 18% 50.5% 83% 100%
Herd specificity (1 positive) 91.8% 92.4% 93.0% 93.5% 94.2%
Number of non-infected herds tested 5974 5982 5988 5993 5998
Number of non-infected animals tested 71688 71784 71856 71916 71976
Number of false positive herds 339 381 413 445 486
False positive:true positive ratio 18 36 70 215 486
Predictive value of positive herd test 0.03% 0.14% 0.51% 4.04% 99.5%
Predictive value of negative herd test 99.2% 99.7% 99.8% 99.9% 99.99%
Cost / infected herd detected (NOK) 256,240 488,822 899,791 2,710,965 5,448,500
10,000 iterations. The sampling method was
Latin Hypercube and Monte Carlo recalcula-
tions were used. A list of variables, the distri-
butions and fixed values used in the model are
in Table 1.
Results
Table 2 shows the results when 6000 herds were
tested. The results were generated as probabil-
ity distributions. With an estimated herd preva-
lence of 0.2%, one would expect to have a min-
imum of 20, a median of 48 and a maximum of
75 infected herds in the tested model popula-
tion. The median number of infected herds
tested was 12. When testing 12 infected herds,
one would expect to detect infection in approx-
imately 6. There was a 99.2% probability that at
least 1 infected herd would be detected. Ap-
proximately, 72,000 non-infected animals
would be tested resulting in a median number of
413 false-positive herd reactions. A median of
70 false-positive reactions for every truly in-
fected herd detected would be expected. The
median predictive value of a positive herd test
was 0.51% while the median predictive value of
a negative herd test was 99.8%. The median
cost per infected herd detected was more than
5,05 million NOK.
Discussion
After many years during which the Norwegian
cattle population was apparently free of PTB, in
1997 22 of 708 imported animals were sero-
positive when tested with an ELISA. All sero-
positive animals were slaughtered and 6 ani-
mals in 3 herds were confirmed to be infected
by culturing organ and/or fecal samples. All
confirmed infected animals were imports ex-
cept 1 offspring of an imported cow. Sero-posi-
tive animals were also found in herds with di-
rect or indirect contact with the infected herds
(Djønne et al. 1999). The only evidence of PTB
in Norway was confined to beef cattle. How-
ever, there had never been a survey determine
the prevalence of PTB in the dairy population.
Because the severe movement and trade restric-
tions only affected the beef cattle industry, there
was political pressure to determine whether the
disease also was present in the native dairy pop-
ulation. Therefore a national survey to confirm
the absence of or herd prevalence of PTB in the
dairy population was proposed.
Monte Carlo simulation modeling was used to
assess the feasibility of the proposed survey.
Simulation modeling is an effective tool for
evaluating potential programs before commit-
ting resources that may be better used else-
where or in a more effective way.
Herd level and within-herd prevalence greatly
influence the outcome of serological surveys.
Considering the absence of clinical or labora-
tory diagnoses, other than in the imported cat-
tle, the prevalence of PTB infected dairy herds
in Norway must be very low if not 0%. A herd
prevalence of 0.2% was used in the model be-
cause to declare a country free of a disease, a
survey that will detect 1 or more infected herds
at that prevalence with 99% confidence must be
done (OIE, 1998). For this reason, the number
of herds tested must be in excess of 4,500 to en-
sure that infected herds are included in the sam-
ple (Cameron 1998). All animals over 2 years
of age in a herd would be tested. However, be-
cause of the small herd sizes (model me-
dian=12 cows), the ELISA characteristics and
low within-herd prevalence, it is impossible to
classify an individual herd as uninfected with
an acceptable level of confidence (Cameron
1998, Cameron and Baldock 1997). In the pre-
sent simulations, in 50% of the iterations the
median number of infected animals tested was
1, and 95% of the time the number of infected
animals tested was less than or equal to 2. The
median number of infected animals detected
was 1. From this, one can see that the herd level
sensitivity (Martin et al. 1992, Carpenter and
22
Acta vet. scand. Suppl. 94 - 2001
Gardner 1996) would not be much different
from the individual test sensitivity.
One could argue that detecting only about 50%
of the potentially infected herds tested is better
than detecting none. However, in Norway herds
that are diagnosed as PTB infected are placed
under severe restrictions regarding animal
movements, sales, shared pastures, etc. The po-
tential for false positive reactions due to less
than 100% specificity of the ELISA could po-
tentially cause extreme hardship to many dairy
farmers. In the simulations the specificity of the
ELISA was assumed to follow a uniform distri-
bution with a minimum of 99.0% and a maxi-
mum of 99.9%. The mean of this distribution is
99.5%. This might have been an optimistic es-
timate, because Jordan (1996) used an array of
95%, 96%, 97%, 98% and 99% to model the
ELISA specificity under Australian conditions.
If the true herd prevalence of PTB in Norway is
about 0.2% and if 6000 herds were tested ap-
proximately 5950 of the tested herds would be
uninfected. The median herd size in these sim-
ulations was 12 animals. Thus, about 71,000
uninfected animals would be tested resulting in
a median of 413 false-positive reactions. There
would be between 381 and 445 false-positive
reactions 95% of the time. The possibility that
clustering of false positive reactors might occur
was not addressed in this model. The herds with
positive reactors (infected or not) would be
placed under movement and trade restrictions
until the diagnosis could be confirmed or re-
jected. Confirmation would have to be by some
other method (for example, another ELISA, fe-
cal culture, culture of necropsy tissues, or other
immunological test) (Spangler et al. 1992a,
Spangler et al. 1992b, Sweeney et al. 1995,
Collins 1996). All of these methods have prob-
lems with lack of sensitivity, specificity or both
and could also result in inconclusive results.
Thus, confirming a diagnosis can be very diffi-
cult and time consuming.
A common method to compensate for less than
100% specificity is to require more than 1 ani-
mal in a herd to test positive before a herd is
classified as infected (Donald 1993, Donald et
al. 1994, Jordan 1996, Jordan & McEwen
1998). Requiring more than 1 positive reaction
in order to classify a herd as infected in order to
reduce the number of false-positive reactors
(Donald et al. 1994, Jordan & McEwen 1998)
is not a feasible option for Norway. In these
simulations, 95% of the time there were fewer
than 2 infected animals per herd tested. In 95%
of the iterations the number of infected animals
per herd that were detected was 1. This would
result in a herd-level sensitivity of approxi-
mately 5%. However, the herd-level specificity
would be approximately 99.7%
Another way to decrease the expected number
of false positive reactors would be to decrease
the number of herds tested and thus the number
of uninfected animals tested. This would also
decrease the probability of detecting any truly
infected herd. A median of 12.6% of infected
herds was detected when 6000 herds were
tested, but only 1.8 % if 500 herds were tested.
The main reason that the probability of detect-
ing an infected herd is so low is that the median
percentage of the total number of infected herds
tested would be 4-25% depending on the sam-
ple sizes used.
The costs associated with the proposed survey
were also analyzed. At 70 NOK per test, the ini-
tial cost of testing would be approximately 5
million NOK. In addition, it was assumed that
any herds that were classified as sero-positive
would be re-tested. If a herd was classified as
infected if 1 or more sero-positive animals were
found, the median cost of detecting a truly in-
fected herd was approximately 900,000 NOK.
If it required 2 or more sero-positive animals to
classify a herd as infected, the median cost to
detect a truly infected herd was 5.06 million
NOK. The costs would be less if the herd preva-
23
Acta vet. scand. Suppl. 94 - 2001
lence were higher than the 0.2% used in the
simulations.
There are good reasons why Norway would like
to determine the prevalence of or absence of
PTB in the national cattle population. These in-
clude the desire to maintain the high health
standards in the national herd, the identification
of infected herds so that PTB eradication or
control could be accomplished, and concerns
about a possible relationship between My-
cobacterium paratuberculosis and Crohn’s dis-
ease in humans (Chiodini 1989). However, the
results of these simulations suggest that with
the available diagnostic methods a national sur-
vey to estimate the prevalence of PTB in the na-
tional dairy population is not feasible. The re-
sults confirm the conclusion of Jordan (1996)
that aggregate (herd) testing is best suited for
circumstances where the within herd preva-
lence is high, where herd size is not a constraint
in obtaining adequate sample size, and where
the diagnostic test has both high sensitivity and
specificity. None of these conditions applies to
the conditions for a national prevalence survey
for PTB in dairy cattle in Norway.
References
Office International des Epizootés (OIE): Bovine tu-
berculosis. In: International Animal Health Code
-1998 Edition. 29 Mar. 1999. <http://www.
oie.int/Norms/MCode/A_summry.htm>.
Cameron AR: Active surveillance for livestock dis-
eases - Practical techniques for developing coun-
tries. Australian Centre for International Agricul-
tural Research, 1998. 344 pp.
Cameron AR and Baldock FC: Proving freedom from
disease using imperfect tests: The FreeCalc sam-
ple size calculator and survey analysis program.
Epidémiol. Santé. Anim. 1997, 31-32,12.01.1-
12.01.3.
Carpenter TE and Gardner IA: Simulation modeling
to determine herd-level predictive values and
sensitivity based on individual-animal test sensi-
tivity and specificity. Prev. Vet. Med. 1996, 27,
57-66.
Chiodini RJ: Crohn’s disease and the mycobacte-
rioses: A review and comparison of the two dis-
ease entities. Clin. Microbiol. Rev. 1989, 2, 90-
117.
Collins MT and Morgan IR: Epidemiological model
of paratuberculosis in dairy cattle. Prev. Vet.
Med. 1991, 11, 131-146.
Collins MT and Morgan IR: Simulation model of
paratuberculosis control in a dairy herd. Prev.
Vet. Med. 1992, 14, 21-32.
Collins MT: Diagnosis of Paratuberculosis. In: Vet-
erinary Clinics of North America: Food Animal
Practice. 1996, 12, 357-371.
Djønne B, Holstad, G, Jarp J, Nyberg O, Schönheit J,
Tharaldsen J and Ødegaard Ø: Is paratuberculo-
sis in goats a source of infection to cattle? Some
preliminary results from a national surveillance
program in Norway. Sixth International Collo-
quium on Paratuberculosis. Melbourne, Aust.
1999, Poster presentation.
Donald AW, Gardner I A and Wiggins A D: Cut-off
points for aggregate testing in the presence of dis-
ease clustering and correlation of test errors.
Prev. Vet. Med. 1994, 19, 167-187.
Donald A: Prevalence estimation using diagnostic
tests when there are multiple, correlated disease
states in the same animal or farm. Prev. Vet. Med,
1993, 15, 125-145.
Jordan D: Aggregate testing for the evaluation of
Johne’s disease herd status. Aust. Vet. J. 1996, 73,
16-19.
Jordan D and McEwen SA: Herd-level test perfor-
mance based on uncertain estimates of individual
test performance, individual true prevalence and
herd true prevalence. Prev. Vet. Med. 1998, 36,
187-209.
Martin SW, Meek A H and Willeberg P: Veterinary
Epidemiology: Principles and Methods. Iowa
State University Press, Ames, Iowa, USA, 1987,
343pp.
Martin SW, Shoukri M and Thorburn MA: Evaluating
the health status of herds based on tests applied to
individuals. Prev.Vet. Med. 1992, 1, 33-43.
NAHMS: Johne’s Disease on U.S. Dairy Operations.
USDA:APHIS:VS, CEAH, National Animal
Health Monitoring System. Fort Collins, CO.
1997, # N245.1097.
Spangler E, Bech-Nielsen S and Heider LE: Diag-
nostic performance of two serological tests and
fecal culture for subclinical paratuberculosis, and
associations with production. Prev. Vet. Med.
1992, 13, 185-195.
Spangler E, Bech-Nielsen S , Heider L E and Dorn C
24
Acta vet. scand. Suppl. 94 - 2001
R: Interpretation of an enzyme-linked im-
munosorbent test using different cut-offs be-
tween positive and negative samples for diagno-
sis of paratuberculosis. Prev. Vet. Med. 1992, 13,
197-204.
Sweeney RW, Whitlock RH, Buckley CL and Spencer
PA : Evaluation of a commercial enzyme-linked
immunosorbant assay for the diagnosis of paratu-
berculosis in dairy cattle. J. Vet. Diag. Invest.
1995, 7, 488-493.
Vose D: Quantitative risk analysis: a guide to Monte
Carlo simulation modelling. John Wiley and
Sons, Chichester, UK, 1996, 328 pp.
Sammendrag
Monte Carlo simuleringsmodeller ble benyttet for å
evaluere verdien og forventede resultater av et fore-
slått nasjonalt overvåkingsprogram for para-
tuberkulose (PTB) i norske melkeku-besetninger. En
antatt besetningsprevalens på 0.2% ble benyttet i si-
muleringene. Med 6000 besetninger testet, ble en
eller flere paratuberkulose-besetninger påvist i 99%
av iterasjonene. Den lave sensitiviteten av ELISA-
testen, den antatt lave besetningsprevalensen, den
vanligvis lave prevalensen av PTB innen besetninger
og den lave besetningsstørrelsen i Norge er alle
faktorer som gjør det vanskeligere å påvise sjuk-
dommen. Forholdet mellom falske positive beset-
ninger og sanne positive besetninger hadde en
median på 70:1. Med en antatt besetningsprevalens
på 0.2% og en kostnad pr. test på 70 NOK ble median
kostnad for å detektere en infisert besetning ca.
900.000 NOK. Dersom cut off for klassifisere en be-
setning som infisert ble øket til to positive reagenter,
var median kostnad for å påvise en infisert besetning
5.055.000 NOK. Undersøkelsen viser at et nasjonalt
overvåkingsprogram med tilfeldig uttak av beset-
ninger ikke vil være fornuftig, p.g.a. en lav sannsyn-
lighet for å påvise infiserte besetninger og et for-
ventet høyt antall av falske positive reagenter.
25
Acta vet. scand. Suppl. 94 - 2001