Báo cáo khoa học: " Geographical Information System (GIS) as a Tool in Surveillance and Monitoring of Animal Diseases" potx
Bạn đang xem bản rút gọn của tài liệu. Xem và tải ngay bản đầy đủ của tài liệu tại đây (966.36 KB, 7 trang )
Acta vet. scand. 2001, Suppl. 94, 79-85.
Acta vet. scand. Suppl. 94 - 2001
Geographical Information System (GIS) as a Tool in
Surveillance and Monitoring of Animal Diseases
By Madelaine Norstrøm
Ullevålsvn. 68, P.B 8156 Dep., N-0033 Oslo, Norge.
Introduction
A Geographical Information System (GIS) can
be used as a tool for any discipline which han-
dles with data that can be connected with geo-
graphical locations, such as countries, regions,
communities, or co-ordinates. The systems
have been developing rapidly in the past and to-
day there are a number of different software
which are more user-friendly than in the past.
GIS is about to become tools for everyone.
The need for using this system also in the field
of veterinary medicine has been emerging dur-
ing the last decade. In 1991 Sanson et al. de-
scribed the systems and possible applications in
the field of veterinary medicine. Still, the most
used application of GIS is to produce descrip-
tive maps. However, the potential of GIS is
much larger. Reviews in the field of environ-
ment and human health (Briggs & Elliot 1995),
and in the field of animal health (Sharma 1994)
have been undertaken. GIS has been included in
decision support systems for control of infec-
tious diseases in animals (Sanson 1994, Laube
1997).
This paper will attempt to present the technol-
ogy and possibilities of GIS with regard to
surveillance and monitoring of animal diseases,
and will discuss some applications of GIS in the
field of veterinary epidemiology in Norway.
Geographical information system
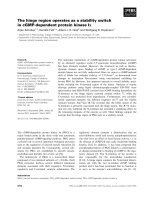
GIS is a computer-based system for analysing
and displaying digital geo-referenced data sets
(Fig.1).
The data can be stored in two formats; vector-
based and grid-based.
The maps of the vector-based format display
In the veterinary epidemiology, the advantage of mapping the locations of farms and
other facilities with animals is obvious. In an outbreak of a disease it could make the
management of the situation easier, and it could also provide a tool to evaluate different
strategies to prevent the spread of infectious diseases. This paper aims to describe and
give an overview of the possibilities and potential uses of a Geographical Information
System (GIS) in the field of surveillance and monitoring of animal diseases. The fol-
lowing areas in which GIS and special GIS-functions could be incorporated are pre-
sented: recording and reporting information, epidemic emergency, cluster analysis,
modelling disease spread, and planning control strategies. Different sources of data; ge-
ographical data, farm locations and disease information, used in the development of the
GIS at the National Veterinary Institute in Norway are thoroughly described in the pa-
per. Further, it presents a few examples where the GIS has been applied to studies of epi-
demiology and surveillance of animal diseases in Norway, which shows the significant
value of GIS in these areas. At the same time, the incorporation of GIS in this field
shows the scarcity of the data available, which should encourage improvement in the
data recording and the quality of the registries.
Geographical Information Systems, Surveillance, Epidemiology.
models of the real world using points, lines and
polygons. Vector digitising captures a point as a
x, y co-ordinate, while a line is captured as an
ordered string of such co-ordinates. A polygon
is a closed line. The grid-based format of data
is captured as information of each quadratic
cell in a screen and could be looked at as a
photo of the area. GIS displays the geo-refer-
enced data as theme layers which can be dis-
played one at a time or on top of each other, like
overheads on a projector. These are stored in a
geo-relational database. Each feature has at-
tribute data linked to it which is stored in a
table. Attributes can be any item of a feature
which relate to the map, without being a part of
it. The attribute data of the object with a geo-
graphical connection is stored in tables which
can be joined with the geographical data
through a common identifier (ID). An ID rele-
vant to animal disease data could be a farm or
region. Numbers are to prefer as ID as charac-
ter variables often can be misspelled. The farms
can be visualised using points, and regions such
as veterinary districts, municipalities or coun-
ties are stored as polygons.
Description of GIS-functions useful in the
veterinary surveillance
Recording and reporting disease information
GIS can be used to produce maps of disease in-
cidence, prevalence, mortality, morbidity on
farm, region, or national levels. The informa-
tion is more easily understood when visualised
on a map. Because information on diseases of-
ten tends to be aggregated (from information on
each individual herd to municipality or county
level) the information loses some of its value. If
the information is mapped at the farm level,
only small parts of a region can be visualised at
the same time.
Another way to describe the incidences of dis-
eases in a defined area can be to create density
80
Acta vet. scand. Suppl. 94 - 2001
Fig. 1. The structure of a Geographical Information System.
maps by using the density function. The density
function creates a grid with a defined cell size
and gives each cell in the area a density value of
the infected farms. To adjust for the underlying
population, a density map of the whole popula-
tion at risk is created with the same cell size.
The density maps are then divided to provide a
map that shows the incidence of the particular
disease in each area unit at the time unit chosen.
This function can further provide maps which
show the spread of the disease by displaying the
maps as a movie. The GIS can also be incorpo-
rated in a real time outbreak notification, as
done in an eradication program of the Au-
jeszky’s disease in North Carolina (McGinn et
al. 1997). Maps displaying the updated situa-
tion in a region, together with farm information
are important tools for field personnel and can
also be incorporated in reports to producers, ad-
ministrators and the media.
Epidemic emergency
In case of an outbreak of an infectious disease,
GIS can provide an excellent tool for identify-
ing the location of the case farm and all farms
at risk within a specified area of the outbreak.
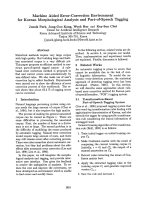
Buffer zones can be drawn around those farms
as shown in Fig. 2. and with a link to tables of
the addresses of the farms at risk, the farms can
be informed within a short time after a notified
outbreak. Buffer zones can also be generated
around other risk areas or point sources, such as
roads where infected cattle have been driven or
around market places. Further, the maps can as-
sist the field veterinarians to plan their work in
the current situation, and for the veterinary au-
thorities in how to handle a potential outbreak.
Analysis of clustering of diseases
To analyse whether a disease is clustered in
space, time or in time and space other programs
81
Acta vet. scand. Suppl. 94 - 2001
Fig. 2. A map showing an example of how buffer zones with the distance of 5, 10, and 20 kilometres were cre-
ated around a fish farm with a positive isolation of Viral haemorrhagic septicaemia virus in rainbow trout (1998)
to identify nearby locations of different fish farms and slaughterhouses for fish.
Farm - detected VHS
Ongrowing farm in sea
Hatchery
Broodstock in sea
Slaughter house
Inactive farm
still have to be used because this is not yet a
standard tool in the available GIS-packages.
The visualisation of the disease rates on digital
maps can be misleading because the eye tends
to interpret point patterns as clusters more often
than what is real. Therefore, a cluster analysis
should be carried out for an objective evalua-
tion of the reported disease cases. The results of
some of the cluster analyses can, thereafter, be
imported into a GIS to visualise the location of
clusters or cluster areas.
Model disease spread
Simulation models using programmes pack-
ages as @Risk (Palisade Corporation, New-
field, NY, USA) can be integrated within a GIS.
Such simulation models can incorporate farm
information such as herd size, production type
as well as spatial factors like distance to the
source of outbreak, population density and cli-
mate conditions, vegetation and landscape, all
of which have been defined as risk factors for
the spread of the modelled disease. Sanson,
(1994) has developed a model of a potential
outbreak of foot and mouth disease in New
Zealand.
Planning disease control strategies
The neighbourhood analysis function can be
used to identify all adjacent farms to an in-
fected farm. It is a function that identifies all ad-
jacent features with a certain criteria to a par-
ticular feature. Contact patterns such as
common use of grasslands or sources of pur-
chasing etc. could be visualised with a so-called
spider diagram. This could provide insight into
the possibility of transmission of infectious dis-
eases between herds. In the planning of eradi-
cation of diseases, GIS has the possibility to
perform overlay analysis to find high or low risk
areas for diseases which depend on geographi-
cal features or conditions related to the geogra-
phy. Studies of trypanosomiasis (Rogers 1991)
and theileriosis (Perry et al. 1991, Lessard et al.
1990), are just some examples of how to use
GIS to plan eradication of diseases depending
on habitats of vectors or wild animal popula-
tion. GIS could also be used to find areas with a
low density of other farms (Marsh et al. 1991,
Staubach et al. 1997, Mc Ginn et al. 1997) or
risk areas of diseases as shown by Staubach et
al. (1998) in case of Echinococcus multilocu-
laris in foxes.
Description of the sources of the data
used in the GIS in the field of veterinary
epidemiology in Norway
Digital maps of Norway are provided and can
be purchased from the National Map Depart-
ment of Norway. The geographic data consist-
ing of themes of each geographical feature are
complete for the whole country in the scales
1:1Mill. and 1:250 000. There are maps in the
scale 1:50 000 for some parts of Norway.
The administrative boundaries of Norway can
be divided into regions such as counties, mu-
nicipalities, and in the veterinary field, veteri-
nary districts which mostly consist of one ore
more municipalities. The themes of veterinary
districts were manually created and derived
from the themes of the municipalities with the
use of ArcView 3.1 (ESRI., Redlands, CA,
USA).
The farm locations were provided by the Agri-
culture Property Registry, which is the official
database of all information regarding agricul-
ture in Norway. This registry includes all agri-
cultural properties in the country, including
properties with as well as without animal pro-
duction. Animal producers can be found in the
Registry of Production Subsidies (RPS), which
records all farms which apply for financial sup-
port for their production. This registry is up-
dated twice a year. This registry contains the
production number, name, address of the appli-
cant and number of animals in each production
82
Acta vet. scand. Suppl. 94 - 2001
category at the day of application. The infor-
mation of the locations of the farms with ani-
mal production as well as their production type
and herd sizes are collected from these two reg-
istries. The disease recording system of the Na-
tional Veterinary Institute includes the results
from all tests of samples tested according to
surveillance programs as well as diagnostic
purposes of disease investigation. Today, all in-
formation about disease status in the counties,
municipalities or on each farm can be collected
from this database and imported into ArcView
3.1 as text files for joining with a geo-refer-
enced theme such as farm, municipality, veteri-
nary district or region. The GIS can thereby
show the summarised information at a specific
time or over any desired time period. Alterna-
tively, the information in the database can be
accessed through the ODBC interface.
A goal of the introduction of GIS is to have
maps continuously displaying the situation for
each of the diseases included in the Norwegian
Surveillance Program.
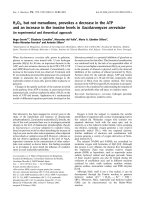
By the use of the registries described, it has
been possible to obtain maps with all registered
cattle, swine, sheep, goat and poultry farms in
Norway. Density maps of the farms of each pro-
duction category as well as density maps of the
population of each species have also been pro-
duced. An example of the maps created for the
cattle population in 1998 is shown in Fig. 3. The
map to the left shows the number of cattle herds
within each municipality and the map to the
right shows average number of herds per square
kilometres within each municipality. In the fol-
lowing examples of specific projects where GIS
has been applied in the field of veterinary epi-
demiology in Norway. are presented.
Mycoplasma eradication in the swine
population
One of the goals of The Norwegian Pig Health
Service is to eradicate Mycoplasma hyopneu-
moniae from the Norwegian swine population.
There are several projects going on and the role
of the geographical information system in these
83
Acta vet. scand. Suppl. 94 - 2001
Fig. 3. The map of Norway with the distribution of cattle herds shown as number of herds in each municipal-
ity in A) and as number of herds per square kilometre within each municipality in B).
projects will be to describe and follow the situ-
ation over time. The system also provides a tool
to plan the eradication of the disease. The swine
population in Norway is built up in a breeding
pyramid , where the elite herds are at the top,
followed by multipliers, conventional herds,
and at the bottom of the pyramid; the slaughter
pig herds. The strategy of the eradication pro-
gram is to try to eradicate one level at a time
with the starting point at the top. With a GIS the
spatial aspects can be included in the eradica-
tion program. To avoid re-infection from
nearby herds of another level, the program can
identify those herds and help in the planning of
further eradication of the disease.
Paratuberculosis
In Norway, Paratuberculosis (PTB) has been
considered to be a significant problem in the
goat population, whereas PTB in cattle hadn’t
been diagnosed since 1979. Nevertheless, the
fact that Norway claimed to have a PTB free
status in the cattle population forced the au-
thorities to start with an active surveillance pro-
gram to test the cattle population systemati-
cally. The surveillance has focused on several
risk groups, starting with the imported cattle,
thereafter cattle in goat herds with PTB, older
cattle, cattle in goat herds and finally a random
sample dairy and beef cattle. The GIS has been
used to identify the location of all goat herds,
goat herds positive for PTB goat herds with cat-
tle. During the test period the GIS has been
used to identify the location of sero-positive
and bacteriological positive cattle herds and to
look for spatial relationship between positive
cattle herds and positive goat herds.
An outbreak investigation of bovine
respiratory syncytial virus in cattle
In a study of the transmission of epidemic res-
piratory disease between cattle herds, data from
an outbreak of acute respiratory disease associ-
ated with BRSV (Norström et al. submitted)
have been used to map the disease occurrence
weekly as well as to provide incidence maps,
and most likely clusters. The distances between
all herds have been calculated by the use of
ArcView 3.1 and will be used in a further study
of risk factors, involving spatial factors. It is
also planned to create a transmission model of
acute respiratory disease and apply it in a GIS.
Discussion and conclusions
A GIS provides significant added value to cur-
rent routine data that is usually taken into low
consideration for either epidemiological or
management purposes in veterinary medicine.
A GIS considerably increases the efficacy of
communication. Management and veterinary
service tasks and resources during emergency
can be improved with the use of GIS. Descrip-
tion of geographical disease dynamics over
time, of risk factors due to spatial relationships
as well as the drawing of risk and damage maps
become feasible.
The deficiencies in a surveillance system also
become more obvious and as a by-product of
introduction of GIS, the system of collecting,
storing and managing data can be improved.
Last but not least, keep in mind: The maps will
never be better than the original input data!
References
Briggs DJ and Elliott P: The use of geographical in-
formation systems in studies on environment and
health. World Health Statistics quarterly 1995,
48(2): 85-94.
Laube P, Stärk KDC and Keller H: A GIS-based com-
puter program for the region-wide eradication of
Enzootic Pneumonia (EP). Proceedings of the 8th
International symposium on veterinary epidemi-
ology and economics in Paris in 1997, published
in Epidemiologie et sante animale.1997,: 31-32,
12.13.1-12.13.2.
Lessard P, L'Eplattenier RL, Norval RAI, Kundert K,
Dolan TT, Croze H, Walker B, Irvin AD and Perry
BD: Geographical information systems for
84
Acta vet. scand. Suppl. 94 - 2001
studying the epidemiology of cattle diseases
caused by Theileria parva. Vet. Rec.1990, 126,
255-262.
Marsh WE, Damrongwatanapokin T, Larntz K and
Morrison RB: The use of geographic information
system in an epidemiological study of pseudora-
bies (Aujeszky's disease) in Minnesota swine
herds. Prev. Vet. Med. 11: 249-254 1991.
McGinn TJ, Cowen P and Wray DW: Intergrating a
geographic information system with animal
health management. Proceedings of the 8th Inter-
national symposium on veterinary epidemiology
and economics in Paris in 1997, published in Epi-
demiologie et sante animale. 1997, 31-32: 12.
C.36.
Rogers DJ: Satellite imagery tsetse and trypanoso-
miasis in Africa Prev. Vet. Med. 1991, 11, 201-
220.
Perry BD, Kruska R, Lessard P, Norval RAI and Kun-
dert K: Estimating the distribution and abun-
dance of Rhipicephalus appendiculatus in Africa.
Prev. Vet. Med. 1991, 11, 261-268.
Sanson RL, Ster MW and Morris RS: Interspread-A
spatial stochastic simulation model of epidemic
foot-and-mouth disease. The Kenyan Veterinar-
ian 1994, 18(2): 493-495.
Sharma P: Use of geographic information systems in
animal health information programs. ACIAR
Proceedings in 1994 51, 119-125.
Staubach C, Teuffert J and ThulkeH-H: Risk analysis
and local spread mechanisms of classical swine
Proceedings of the 8th International symposium
on veterinary epidemiology and economics in
Paris in 1997, published in Epidemiologie et
sante animale. 1997, 31-32, 6.12.1-6.12.3.
Staubach C, Tackmann K, Löschner U, Mix H, Busse
W, Thulke H-H, Territo BM and Conraths FJ:
Geographic information system-aided analysis of
factors potentially influencing the spatial distri-
bution of Echinococcus multilocularis infections
of foxes. Trushfield MV and Goodall EA, Pro-
ceedings of a meeting held at the West County
Hotel Ennis CoClare on the 25th 26th and 27th of
March 1998: 40-47 1998.
Sammanfattning
Kartor som visar den geografiska belägenheten av
olika djurbesättningar och andra anläggningar med
djur är ett gott hjälpmedel inom veterinär epidemi-
ologin. Vid ett utbrott av en smittsam djursjukdom
kan det underlätta hanteringen av situationen och
också vara ett hjälpmedel för att evaluera olika
bekämpningsåtgärder. Denna artikeln har som syfte
att beskriva möjliga arbetsområden av geografiska
informationssystem (GIS) för övervakning av djur-
sjukdommar. Följande områden inom vilka GIS och
speciella GIS funktioner kan användas är presenter-
ade: data insamling och rapportering, epidemisk nöd-
situation, cluster analys, spridningsmodellering och
planering av bekämpningsåtgärder av djursjukdom-
mar. Data källor som; geografiska data, djurbesät-
tningars belägenhet och sjukdoms information har
använts i utvecklingen av GIS vid Veterinärinstituttet
i Norge och är beskrivna i artikeln. Vidare presen-
teras ett par exempel på hur GIS har använts i olika
epidemiologiska studier samt i övervaknings pro-
gram. Införandet av GIS visar fort bristerna i de data
som är tillgängliga vilket medverkar till förbättring
vid insamling av data och kvaliten på registren.
85
Acta vet. scand. Suppl. 94 - 2001