Báo cáo khoa học: "Mortality in over 350,000 Insured Swedish dogs from 1995-2000: I. Breed-, Gender-, Age- and Cause-specific Rates" pptx
Bạn đang xem bản rút gọn của tài liệu. Xem và tải ngay bản đầy đủ của tài liệu tại đây (161.44 KB, 16 trang )
Bonnett BN, Egenvall A, Hedhammar Å, Olson P: Mortality in over 350,000 In-
sured Swedish dogs from 1995-2000: I. Breed-, gender-, age- and cause-specific
rates. Acta vet. scand. 2005, 46, 105-120. – This study presents data on over 350,000
insured Swedish dogs up to 10 years of age contributing to over one million dog-years
at risk (DYAR) during 1995-2000. A total of 43,172 dogs died or were euthanised and
of these 72% had a claim with a diagnosis for the cause of death. The overall total mor-
tality was 393 deaths per 10,000 DYAR. Mortality rates are calculated for the 10 most
common breeds, 10 breeds with high mortality and a group including all other breeds,
crudely and for general causes of death. Proportional mortality is presented for several
classifications. Five general causes accounted for 62% of the deaths with a diagnosis
(i.e. tumour (18%), trauma (17%), locomotor (13%), heart (8%) and neurological (6%)).
Mortality rates for the five most common diagnoses within the general causes of death
are presented. These detailed statistics on mortality can be used in breed-specific strate-
gies as well as for general health promotion programs. Further details on survival and
relative risk by breed and age are presented in the companion paper (Egenvall et al.
2005).
database; incidence.
Acta vet. scand. 2005, 46, 105-120.
Acta vet. scand. vol. 46 no. 3, 2005
Mortality in over 350,000 Insured Swedish dogs
from 1995-2000: I. Breed-, Gender-, Age- and
Cause-specific Rates
By B. N. Bonnett
1
, A. Egenvall
2
, Å. Hedhammar
3
and P. Olson
4
1
Department of Population Medicine, Ontario Veterinary College, University of Guelph, Guelph, Ontario,
Canada N1G 2W1,
2
Department of Clinical Sciences, Faculty of Veterinary Medicine and Animal Science,
Swedish University of Agricultural Sciences, SE-750 07 Uppsala, Sweden,
3
Department of Small Animal Clin-
ical Sciences, Faculty of Veterinary Medicine and Animal Science, Swedish University of Agricultural Sciences,
SE-750 07 Uppsala, Sweden,
4
Agria Insurance, PO 70306, SE-107 23 Stockholm, Sweden.
Introduction
Population data on the rates and causes of death
in dogs provide useful information on several
levels. Breed-specific rates and estimates of the
proportion of deaths in a breed due to certain
causes can describe the current or ongoing
health problems in that breed. These may in-
form health promotion strategies and their
monitoring. The age pattern of death, especially
estimates of survival to certain ages, is infor-
mative for current and prospective owners of a
breed and for veterinarians and researchers.
Comparing similarities and differences in pat-
terns of mortality across breeds or genders may
suggest theories about disease causation and di-
rect research as to whether a certain cause of
death may be a function of, for example, geno-
type or phenotype, conformation, physiology,
temperament or usage. Undoubtedly dog-
breeding practices have had an impact on the
general health of the canine population as well
as on the occurrence of inherited diseases (Ott
1996). Quantifying the disease burden in a pop-
ulation, either within or across breeds, is neces-
sary to monitor changes in disease and death
rates over time that may relate to natural causes,
environmental changes or human interventions.
Monitoring disease in animal populations may
also inform efforts to identify, for example, en-
vironmental causes of deaths in humans.
In several studies tumours have been indicated
as the most common cause of death in dogs, fol-
lowed by various other diseases (Bronzon 1982,
Bernardi 1988, Bredal et al. 1994, Bonnett et
al. 1997). A recent study on a British insurance
database indicated that tumours are a frequent
cause of claims (Dobson et al. 2002). In some
studies it has been shown that different causes
of death are related to the age of the dog (An-
derson & Rosenblatt 1965, Bronzon 1982,
Bernardi 1988, Bredal et al. 1994, Deeb & Wolf
1994, Eichelberg & Seine 1996). For example,
Bredal et al. (1994) showed that the mean age
at death of Bernese mountain dogs that died
from trauma was almost four years. In the same
study, the mean age at death of those Bernese
mountain dogs that had died of cancer was al-
most seven years. In earlier work by these au-
thors trauma (especially road traffic accidents)
was a common cause of death in Swedish dogs
(Bonnett et al. 1997). The underlying risk fac-
tors and causes, and therefore prevention strate-
gies, for tumours and trauma are quite different.
The Agria (Agria Animal Insurance, PO 70306,
SE-107 23 Stockholm, Sweden) insurance
database has previously been used to study
morbidity and mortality in Swedish dogs (Bon-
nett et al. 1997, Egenvall et al. 2000a-c). The
age pattern, irrespective of cause of death,
based on death before 10 years of age, has also
been presented for a few selected breeds (Egen-
vall et al. 2000c). It has been shown that the de-
mographic validity (breed, age, gender) of the
database is excellent, while the diagnostic va-
lidity is adequate (Egenvall et al. 1998). As
there are now six years of data available for
analysis, the database provides further opportu-
nities to study causes of death in relation to
breed, gender and age for various diagnostic
categories of death.
The objective of this study is to describe the oc-
currence of general causes of death in Swedish
dogs insured during 1995 to 2000 by presenting
overall and cause-specific mortality rates and
proportional mortality by breed. The age pat-
tern of general causes of death within several
breeds/groups and the effect of gender will be
examined. Further details on individual breeds,
including survival analysis and relative risk will
be presented in the companion paper (Egenvall
et al. 2005).
Materials and methods
Insurance data
Dogs covered by life insurance from 1995 to
2000 in a Swedish insurance company (Agria)
were included in this study. Most dogs had been
enrolled in insurance as puppies, but dogs could
have entered the insurance program until they
were six years of age until year 1996 and after
that at any age. Eight percent of the dogs in the
database entered after three years of age. The
insurance process has previously been de-
scribed in detail (Bonnett et al. 1997, Egenvall
et al. 2000a). Dogs in this analysis were only
covered for life until 10 years of age.
Deaths of life-insured dogs could be registered
in several ways. Most often, the company re-
ceived a signed claim form from the attending
veterinarian when the dog died or was eu-
thanised. In other situations, when an animal
died and a veterinarian was not involved, for ex-
ample some traumatic deaths, the claim form
was filled out and signed by the owner and two
independent persons who certified their knowl-
edge of the cause of death or loss of the animal.
Both natural deaths and deaths from euthanasia
were included (not differentiated in the data-
base). Dogs that died but for which no claim
was submitted were generally recorded as 'dead
– not claimed'. As owners terminate their poli-
cies upon a dog's death, most or all of these
deaths are captured in the database, however
106 B. N. Bonnett et al.
Acta vet. scand. vol. 46 no. 3, 2005
there is no recorded diagnosis for the cause of
death.
Data from 1995 to 2000 on all dogs covered for
life insurance at Agria were downloaded to a
personal computer. Variables used were breed,
date of birth, date of death, gender (male /fe-
male, not neuter status), diagnostic code for
death, date when the dog entered or left the in-
surance program and information on the type of
insurance for which the dog was enrolled.
Many dogs originally insured before 1993 had
the year of birth accurately recorded (Egenvall
et al. 1998), but not the date and month. How-
ever, most of the dogs have had their date and
month of birth updated since then. The dogs
with unknown date of birth were said to have
been born the 2nd of July (the middle of the
year).
Breeds were based on classification codes from
the Swedish Kennel Club. Non-purebred dogs
were classified as mongrels. Some breeds were
combined as they were considered to share a
common gene pool. Specifically, dachshund in-
cluded all normal-sized dachshunds, except for
the longhaired, miniature dachshund consisted
of all miniature variants and St Bernard in-
cluded both long-haired and smooth-haired
dogs of that breed. Poodle included both toys
and miniatures.
Diagnoses
Since the first of January 1995 a hierarchical
registry (Swedish Animal Hospital Association
1993) has been used at the insurance company
to assign diagnostic codes to each claim. This
registry contains more than 8,000 alpha-numer-
ical codes. The registry is based on the 14 fol-
lowing different major organ systems: integu-
mentary, digestive, genital, respiratory, skele-
tal, auditory, joints, ocular, urinary, cardiovas-
cular, endocrine, nervous, muscular and un-
specified. System 'unspecified' contains signs
of disease that cannot be attributed to a specific
system as well as diseases that are considered to
involve the whole animal, such as infectious
diseases and all parasitic conditions. Ten major
process groups can be assigned within each
system: symptomatic, developmental, degener-
ative, circulatory, inflammatory, immunologic,
neoplastic, traumatic, toxic and idiopathic (de-
tails, see Egenvall et al. 2000b). Within all sys-
tems except endocrine, sub-divisions of the or-
gan system can be included. In the absence of a
specific diagnosis, a veterinarian can assign
"dead- no diagnosis" within system unspeci-
fied. In the database each claim can only have
one diagnostic code associated with it and that
is based on the diagnosis provided by the at-
tending veterinarian.
For this study, the registered causes of death
were partitioned into six general categories –
tumours, trauma, locomotor disorders, heart,
neurological and other problems. Tumours were
those diagnoses listed under process neoplastic.
The diagnostic category trauma included all di-
agnoses that were listed as traumatic processes;
locomotor disorders were all those in systems
skeletal, muscles and joints, except for the trau-
matic or neoplastic processes. Similarly, the di-
agnostic category heart consisted of all heart di-
agnoses, and neurological disorders included
all diagnoses said to emanate from the nervous
system, except for those said to be neoplastic or
traumatic in origin. Cases with the diagnosis
epileptiforme seizures were included under the
diagnostic category neurological (from system
unspecified). The specific diagnosis cruciate
rupture was included under the diagnostic cate-
gory locomotor and gastric dilatation/volvulus
was included under the diagnostic category
other (both from the traumatic process). All di-
agnoses that did not belong in any of the pre-
ceding categories were assigned to 'other'.
Analyses
The overall and breed-specific total mortality
Mortality in over 350.000 Swedish dogs I 107
Acta vet. scand. vol. 46 no. 3, 2005
were calculated as mortality rates (MR) with
exact denominators (the sum of each animal's
total time of observation) and all deaths in the
numerator. If a dog left the insurance during a
year for reasons other than death, it was re-
garded as censored as of that date (leaving the
database during the study period). The diagnos-
tic MR numerator included only dogs with a
settled claim that included a diagnostic code
(although this could be 'no diagnosis' as speci-
fied by the veterinarian). The time at risk was
either from the 1st of January 1995 or the date
of enrolment for dogs enrolled after that date
until the dog died or became censored (not later
than 31st of December year 2000). Mortality
rates were also calculated by diagnostic cate-
gory within breed and for the five most frequent
specific diagnoses within each diagnostic cate-
gory. Mortality rates were multiplied by 10,000
to be interpreted as the number of deaths per
10,000 dog-years at risk (DYAR). Standard er-
rors (SEs) for MRs have been constructed tak-
ing the root of the number of cases and dividing
by the DYAR (Breslow and Day 1987), then
multiplying by 10,000 (rates are presented as
per 10,000 DYAR). Confidence intervals (95%
CIs) have been constructed around the rates;
rate ± 1.96*SE.
Data have been presented for the 10 most com-
mon breeds as well as for the 10 breeds with the
highest diagnostic mortality. For a breed to be
included in the high risk group there had to be
at least 1,800 DYAR in the breed-specific de-
nominator. Data for all remaining breeds were
combined in one category (other breeds).
Total proportional mortality by breed was cal-
culated (number of deaths in a breed or breed
group / total deaths). Proportional mortality
was calculated by diagnostic categories for all
dogs and within breed (e.g. number of deaths in
a breed due to the diagnostic category / total
deaths for that breed). The proportional mortal-
ity within diagnostic category (the number of
deaths from that cause in a certain breed / total
deaths due to that cause) was presented for cer-
tain breeds and causes. For specific diagnoses
the proportional mortality was calculated (the
number of deaths due to a specific diagnosis
within a diagnostic category / total dead within
that diagnostic category). Most proportional
mortalities are rounded to the nearest whole
percent.
The age-specific and age- and diagnostic cate-
gory-specific MRs for total and diagnostic mor-
tality for the common, high risk and other breed
groups were constructed using the SMOOTH
macro (Allison 1995), which computes age-
specific hazards from the baseline survival
function computed by the SAS (SAS Institute
Inc., Cary, NC, 27513, USA) procedure
PHREG (Cox regression). The macro provides
a smoothed estimate of the hazard curve using
a kernel smoothing method. This involves arbi-
trarily setting the WIDTH parameter, which in-
fluences the degree of smoothing, to achieve a
reasonable curve; in this case one-tenth of the
range of event times was chosen. The rates were
plotted against age, and the graphs are pre-
sented using different scales to adjust for
marked differences in disease rates across
breed groups.
Cox regression was also used to analyse
whether the gender effect (male as baseline)
was significant with respect to total or diagnos-
tic mortality as well as for diagnostic categories
within breeds. The direction and magnitude of
the associations are presented using MR ratios
(MRR, equivalent to hazard ratios) from re-
gressions run separately on each breed with
gender as the only covariate. The proportional
hazards assumption was investigated by plot-
ting the natural logarithm of the cumulative
hazard, from Cox regression without covariates
as described above, against the log of DYAR.
This was done for total and diagnostic mortal-
ity, as well as the diagnostic categories by the
108 B. N. Bonnett et al.
Acta vet. scand. vol. 46 no. 3, 2005
"common/high-risk/other" groups. A value of
P≤0.05 was considered significant. Confidence
intervals (95%) are included for total and diag-
nostic mortalities.
Results
Altogether 353,125 dogs contributed to
1,098,358 DYAR. The dogs were from 332
breed designations. A total of 43,172 dogs died
or were euthanised, and of these 31,057 (72%)
had a claim with a diagnosis for the cause of
death. The overall total mortality was 393
deaths per 10,000 DYAR for life-insured dogs
up to 10 years of age and the diagnostic mortal-
ity was 283 deaths per 10,000 DYAR. The 10
most common and the 10 highest risk breeds
are listed in Table 1 that also shows the diag-
nostic and total MRs (all deaths), the actual
Mortality in over 350.000 Swedish dogs I 109
Acta vet. scand. vol. 46 no. 3, 2005
Table 1. The dog-years at risk (DYAR), the total proportional mortality, the diagnostic (deaths with a diagno-
sis) and total mortality rate (all deaths) with 95% confidence intervals (95% CI's) within breed for dogs life-in-
sured at Agria
1
from 1995-2000 by breed and breed group, as well as the percentage of total deaths with a reg-
istered diagnosis. The breeds are ranked by diagnostic mortality within breed group.
Tot. Of total
prop. Diagnostic Total deaths
Group Mort. mortality mortality with a
Breed DYAR %
2
per 10,000 DYAR (95% CI)
diagn. %
CKC spaniel
3a
26,732 3.4 469 (443-495) 541 (513-569) 87
German shepherd 80,049 11.7 450 (435-465) 634 (616-651) 71
Drever 29,337 3.8 411 (388-434) 552 (525-579) 74
Dachshund 47,248 3.8 268 (253-283) 346 (329-363) 77
Labrador retriever 56,367 3.4 212 (200-224) 263 (249-276) 81
Springer spaniel
3b
26,679 1.9 211 (193-228) 302 (281-323) 70
Mongrel 41,323 4.0 185 (172-195) 413 (393-432) 45
Golden retriever 68,643 3.9 184 (174-194) 243 (232-255) 76
Poodle (min/toy) 23,395 1.4 173 (156-190) 252 (232-273) 69
Min dachshund
3c
30,876 1.6 168 (154-183) 230 (213-247) 73
Total COMMON
4
430,649 38.8 279 (274-284) 389 (383-394) 72
Irish wolfhound 1,957 0.7 1,319 (1,158-1,480) 1,574 (1,398-1,750) 84
St Bernard 2,152 0.6 902 (775-1,028) 1,222 (1,074-1,370) 74
Great dane 3,195 0.8 892 (789-996) 1,114 (999-1,230) 80
Bernese mtn dog
3d
10,534 2.1 753 (700-805) 854 (799-910) 88
Newfoundland 6,828 1.5 728 (664-792) 917 (845-989) 79
Dobermann 6,237 1.3 723 (656-790) 932 (856-1,007) 78
Leonberger 5,823 1.2 708 (639-776) 860 (785-936) 82
Boxer 11,078 1.6 554 (510-598) 629 (582-676) 88
Greyhound 3,772 0.6 541 (147-615) 740 (653-826) 73
Pyrenees 2,038 0.4 530 (430-630) 761 (641-880) 70
Total HIGH-RISK
5
53,614 10.8 712 (689-734) 870 (845-895) 82
OTHER
6
614,095 50.4 248 (244-252) 355 (350-359) 70
TOTAL all breeds 1,098,358 100 283 (280-286) 393 (389-397) 72
1
- Agria Insurance, PO 70306, SE-107 23 Stockholm, Sweden
2
- Number of deaths in breed or group / total number of deaths
3
- Breed names:
3a
- Cavalier King Charles spaniel,
3b
- English springer spaniel,
3c
- miniature dachshund,
3d
- Bernese mountain dog
4
- 10 most common breeds in the database
5
- 10 breeds with highest diagnostic mortality, among breeds with at least 1,800 DYAR
6
- All breeds not included in common or high risk
DYAR and the proportion of all deaths by
breed. Breeds are presented in order of decreas-
ing diagnostic MR within the common and
high-risk groups. For example, for German
shepherd dogs the total mortality was 634
deaths per 10,000.
Within most breeds approximately 70% of dead
dogs had a diagnosis registered. For Cavalier
King Charles spaniels, Bernese mountain dogs
and boxers 85% or more had a recorded cause
of death. However, in mongrels only 45% had a
registered diagnosis.
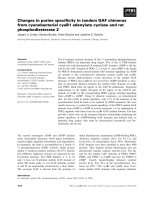
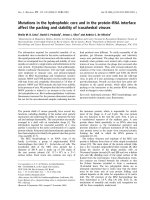
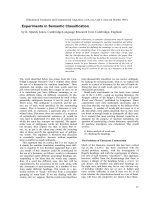
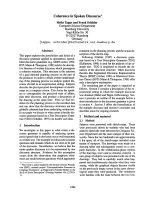
Figures 1a to 1c present the age pattern for total
and diagnostic mortality rates for common,
high-risk and other breeds respectively. The dif-
ference between total and diagnostic mortality
is relatively constant across ages. Figures 1a to
1c also show the age pattern for the diagnostic
category-specific MR. Details on the age pat-
tern for causes of death in specific breeds and
further analysis of relative risk across breeds is
presented in the companion paper (Egenvall et
al., 2005).
Table 2 presents the overall diagnostic cate-
gory-specific MR as well as the proportional
mortality within breed for the common, high-
risk and other breed groups, specific breeds and
all dogs. As an example, in Cavalier King
Charles spaniels there were 246 deaths per
10,000 DYAR in the diagnostic category heart
that account for 52% of all deaths in that breed.
In addition, heart deaths in the Cavalier King
Charles spaniel represent 28% of all deaths due
to a heart diagnosis in the insured population
(data not shown). In all breeds, between 50 and
69% of the disease burden occurred under the
five named diagnostic categories, the remainder
under other causes of disease (table 2).
Table 3 presents the MRRs from the Cox re-
gression for the effect of female compared to
male for total, diagnostic and category-specific
mortality. A MRR of <1 indicates that females
are less likely to die of a given cause, and the in-
110 B. N. Bonnett et al.
Acta vet. scand. vol. 46 no. 3, 2005
0 500 1000 1500 2000 2500 3000
Mortality per 10,000 DYAR
0 2 4 6 8 10
Age in y ears
total diagnostic
locomotor trauma
tumour heart
0 200 400 600 800
Mortality per 10,000 DYAR
0 2 4 6 8 10
Age in y ears
total diagnostic
locomotor trauma
tumour heart
Figures 1a-c. The total mortality, the diagnostic
mortality and the diagnostic category-specific mor-
talities by age for dogs in the 10 common breeds, 10
high-risk breeds and in other breeds.
1c. Other breeds (note scale):
0 200 400 600 800 1000
Mortality per 10,000 DYAR
0 2 4 6 8 10
Age in y ears
total diagnostic
locomotor trauma
tumour heart
1a. Common breeds (note scale):
1b. High-risk breeds (note scale):
verse of the MRR represents the likelihood of a
female not dying, compared to males or, alter-
natively, how much more likely males are to die
compared to females. Ratios presented in
brackets were not significant at P<0.05. Confi-
dence intervals (95%) are presented for the to-
tal and diagnostic mortalities. The proportional
hazards assumption was judged to be ade-
quately satisfied in most plots.
Tables 4 lists, for each diagnostic category, the
five most common specific diagnoses together
with the diagnosis-specific MR for the whole
population. The proportional mortality by spe-
cific diagnosis within category (proportion of
all deaths in that diagnostic category that were
due to the specific diagnosis) is presented over-
all for each specific diagnosis. 'Dead-no diag-
nosis' is the most common diagnosis in the cat-
egory other with an incidence rate of 19 per
10,000 DYAR for all dogs combined. This re-
Mortality in over 350.000 Swedish dogs I 111
Acta vet. scand. vol. 46 no. 3, 2005
Table 2. The breed- and diagnostic category-specific mortality (MR) per 10,000 dog-years at risk (DYAR) with
confidence intervals (95% CI) and the breed proportional mortality within diagnostic category (BP) for dogs life-
insured at Agria
1
from 1995-2000.
GROUP
Category
MR (95% CI)
2
BP%
3
Breed Tumour Trauma Locomotor Heart Neuro Other
CKC spaniel
4a
24 (18-30) 5 22 (16-28) 5 16 (11-21) 3 246 (227-265) 52 15 (11-20) 3 145 (131-160) 31
German shepherd 71 (65-77) 16 33 (29-37) 7 122 (114-129) 27 12 (10-14) 3 19 (16-22) 4 193 (183-202) 43
Drever 29 (23-35) 7 201 (185-217) 49 20 (15-26) 5 10 (6-13) 2 15 (10-19) 4 136 (122-149) 33
Dachshund 21 (17-26) 8 100 (91-109) 37 44 (38-50) 16 26 (21-30) 10 6 (4-8) 2 71 (63-78) 26
Labrador retriever 45 (39-50) 21 21 (17-25) 10 61 (55-67) 29 7 (5-9) 3 11 (9-14) 5 67 (60-74) 32
Springer spaniel
4b
44 (36-52) 21 22 (17-28) 11 12 (8-16) 6 10 (7-14) 5 19 (14-24) 9 103 (91-115) 49
Mongrel 34 (29-40) 19 46 (40-53) 25 12 (8-15) 6 6 (4-8) 3 14 (11-18) 8 73 (65-81) 39
Golden retriever 55 (50-61) 30 14 (11-16) 7 28 (24-32) 15 8 (6-10) 4 17 (14-20) 9 62 (57-68) 34
Poodle 18 (12-23) 10 38 (30-46) 22 12 (8-17) 7 6 (3-9) 3 13 (8-17) 7 86 (74-98) 50
Min dachshund
4c
6 (3-9) 4 82 (72-92) 49 33 (27-39) 14 3 (1-5) 2 5 (2-7) 3 40 (33-47) 23
COMMON
5
41 (39-43) 15 51(49-53) 18 47 (45-49) 17 25 (23-26) 9 14 (13-15) 5 102 (99-105) 36
Irish wolfhound 296 (220-373) 22 56 (23-89) 4 148 (94-202) 11 327 (247-407) 25 31 (6-55) 2 460 (365-555) 35
St Bernard 172 (117-227) 19 28 (6-50) 3 126 (78-173) 14 158 (105-211) 18 88 (49-128) 10 330 (253-407) 37
Great dane 119 (81-157) 13 56 (30-82) 6 119 (81-157) 13 178 (132-225) 20 53 (28-79) 6 366 (300-433) 41
Bernese mtn dog
4d
306 (272-339) 41 41 (29-53) 5 154 (130-177) 20 15 (8-23) 2 22 (13-31) 3 215 (187-244) 29
Newfoundland 105 (81-130) 14 37 (22-51) 5 174 (143-206) 24 149 (120-178) 21 16 (7-26) 2 246 (209-283) 34
Dobermann 168 (136-201) 23 69 (48-90) 10 115 (89-142) 16 82 (59-104) 11 19 (8-30) 3 269 (229-310) 37
Leonberger 197 (161-234) 28 22 (10-34) 3 88 (64-112) 12 101 (75-127) 14 12 (3-21) 2 287 (243-330) 41
Boxer 203 (177-230) 37 18 (10-26) 3 55 (41-69) 10 41 (29-52) 7 63 (48-78) 11 174 (150-199) 31
Greyhound 58 (34-83) 11 135 (98-172) 25 101 (69-133) 19 34 (16-53) 6 21 (7-36) 4 191 (147-235) 35
Pyrenees 108 (63-153) 20 29 (6-53) 6 128 (79-177) 24 29 (6-53) 6 49 (19-79) 9 186 (127-246) 35
HIGH-RISK
6
190 (178-201) 27 44 (38-50) 6 116 (107-125) 16 83 (76-91) 12 34 (29-39)5 245 (231-258) 34
OTHER
7
44 (42-46) 18 46 (45-48)19 24 (23-25) 10 14 (13-15) 6 18 (17-19)7 102 (99-104) 41
Total all breeds 50 (49-51) 18 48 (47-49) 17 38 (37-39) 13 22 (21-22) 8 17 (16-18) 6 109 (107-110) 38
1
- Agria Insurance, PO 70306, SE-107 23 Stockholm, Sweden
2
- MR = number of deaths due to diagnostic category in a breed / DYAR for that breed
3
- BP = number of deaths due to diagnostic category in a breed / total deaths in that breed
4
- Breed names: 4a- Cavalier King Charles spaniel,
4b
- English springer spaniel,
4c
- Miniature dachshund,
4d
- Bernese mountain dog
5
- 10 most common breeds
6
- 10 breeds with highest diagnostic mortality, among breeds with at least 1,800 DYAR
7
- All breeds not included in common or high risk
presents 6.8% of all deaths for which a cause
was registered (data not shown). Note also that
the second and third of the tumour diagnoses
are "lymphosarcoma, blood and bloodproduc-
ing organs" and "lymphosarcoma, whole ani-
mal" (two diagnoses used interchangeably to a
large degree in practice).
The percent of total mortality in each diagnos-
tic category that is explained by the five diag-
noses is also shown in Table 4. The five specific
diagnoses represented between 33 and 82% of
all deaths in each diagnostic category. Several
of the coded diagnoses are, however, rather
non-specific, e.g. heart problem.
Discussion
The insured population
The large database used in this study has sev-
eral advantages, but of course extrapolation of
the information must proceed with some cau-
112 B. N. Bonnett et al.
Acta vet. scand. vol. 46 no. 3, 2005
Table 3. Mortality rate ratios (MRR) for the effect of female compared to male gender, for the total mortality,
diagnostic mortality, as well as the diagnostic category-specific survival derived from breed-specific Cox re-
gressions. Estimated ratios are given in brackets when they were not significant (p≥0.05). The data are from dogs
life-insured at Agria
1
between years 1995-2000. Confidence intervals (95% CIs) are included for the total and
diagnostic mortality rates.
Group Total Diagnostic
Tumour Trauma
Locomotor
Heart
Neurologic
Other
Breed mortality mortality disorders disorders
CKC spaniel
2a
0.8 (0.7-0.8) 0.8 (0.7-0.9) (1.6) (0.9) (0.6) 0.6 (1.1) 1.4
German shepherd 0.8 (0.7-0.8) 0.8 (0.7-0.8) 1.2 (1.0) 0.7 (0.7) (0.8) 0.6
Drever 0.8 (0.8-0.9) (0.9) (0.8-1.0) 1.7 0.7 (1.1) (0.8) 0.5 (1.1)
Dachshund 0.8 (0.7-0.9) (0.9) (0.8-1.0) 1.8 (1.0) 0.6 0.5 (0.8) (1.2)
Labrador retriever 0.8 (0.7-0.8) 0.8 (0.7-0.9) (1.2) 0.6 0.7 (0.6) (0.6) (0.9)
Springer spaniel
2b
0.7 (0.6-0.8) 0.8 (0.7-1.0) 1.6 (1.0) (0.7) 0.4 0.5 0.7
Mongrel 0.7 (0.7-0.8) (0.9) (0.8-1.1) (1.3) (0.8) (0.7) (0.8) (0.6) (1.0)
Golden retriever 0.9 (0.8-1.0) (1.0) (0.9-1.1) (1.1) (0.8) (0.9) (0.9) 0.6 1.2
Poodle (min/ toy) (0.9) (0.8-1.1) (1.0) (0.8-1.2) 2.1 (0.7) (0.6) (0.4) (0.9) (1.2)
Min dachshund
2c
0.7 (0.6-0.8) (0.9) (0.7-1.0) (1.9) 0.7 (0.8) (1.1) (1.4) (1.1)
Total COMMON
3
0.8 (0.8-0.8) 0.9 (0.8-0.9) 1.3 0.9 0.7 0.6 0.7 0.9
Irish wolfhound (0.9) (0.7-1.1) (0.8) (0.7-1.1) (1.0) (0.6) (0.5) (0.6) (0.4) (1.0)
St Bernard 0.8 (0.6-1.0) (0.8) (0.6-1.1) (1.2) (1.8) (1.5) 0.3 0.3 (1.0)
Great dane 0.6 (0.5-0.7) 0.7 (0.5-0.8) (0.9) (1.3) (0.7) 0.2 (0.4) (0.9)
Bernese mtn dog
2d
0.8 (0.7-0.9) 0.8 (0.7-0.9) 0.7 0.4 (1.0) (0.8) 0.4 (0.9)
Newfoundland 0.8 (0.7-1.0) (0.9) (0.7-1.1) (1.4) (0.9) 0.5 0.4 (1.1) 0.8
Dobermann 0.7 (0.6-0.9) 0.8 (0.7-0.9) (1.2) (1.3) (0.8) 0.5 (0.3) (1.2)
Leonberger 0.8 (0.7-0.9) (0.9) (0.7-1.1) (1.0) (1.6) 0.4 (0.7) (2.3) (1.0)
Boxer (1.0) (0.8-1.1) (1.0) (0.8-1.2) (1.0) (1.2) (0.9) (0.7) (1.0) (1.2)
Greyhound 0.6 (0.5-0.8) 0.5 (0.4-0.7) (0.5) (1.1) 0.4 0.3 (0.1) 0.5
Pyrenees 0.6 (0.4-0.8) 0.6 (0.4-0.8) (0.9) (0.5) (0.6) (0.1) (0.5) 0.5
Total HIGH-RISK
4
0.8 (0.7-0.8) 0.8 (0.8-0.9) (0.9) (0.9) 0.7 0.5 0.6 (1.0)
OTHER
5
0.8 (0.8-0.8) 0.9 (0.9-0.9) (1.1) 0.8 0.7 0.5 0.7 (1.0)
TOTAL all breeds 0.8 (0.8-0.8) 0.9 (0.9-0.9) 1.1 0.8 0.8 0.6 0.7 (1.0)
1
Agria Insurance, PO 70306, SE-107 23 Stockholm, Sweden
2
- Breed names:
2a
- Cavalier King Charles spaniel,
2b
- English springer spaniel,
2c
- miniature dachshund,
2d
- Bernese mountain dog
3
- 10 most common breeds in the database
4
- 10 breeds with highest diagnostic mortality, among breeds with at least 1,800 DYAR
5
- All breeds not included in common or high risk
Mortality in over 350.000 Swedish dogs I 113
Acta vet. scand. vol. 46 no. 3, 2005
Table 4. The overall mortality rate per 10,000 dog-years at risk (DYAR), the number dead and the specific di-
agnosis proportional mortality (SP) overall for the five most common specific diagnoses within diagnostic cate-
gory for all dogs life-insured at Agria
1
between years 1995-2000.
Diagnostic Number Mortality
category of (per 10,000 SP
3
(SP:5)
2
Specific diagnosis deaths DYAR)
Tumour Mammary tumour 542 5 (5-5) 10
(39%) Lymphosarcoma, blood and
bloodproducing organs 501 5 (4-5) 9
Lymphosarcoma, whole animal 393 4 (3-4) 7
Liver tumour 385 4 (3-4) 7
Tumour in lung 339 3 (3-3) 6
Trauma Car accident 2342 21 (20-22) 44
(73%) Lost 416 4 (3-4) 8
Drowning 378 3 (3-4) 7
Train accident 347 3 (3-3) 7
Lost during hunting 344 3 (3-3) 7
Locomotor Hip dysplasia 844 8 (7-8) 20
disorders Disc herniation 622 6 (5-6) 15
(54%) Lumbosacral instability 322 3 (2-3) 8
Chronic deforming arthrosis,
elbow joint 294 3 (2-3) 7
Cruciate rupture 176 2 (1-2) 4
Heart Signs of heart failure 723 7 (6-7) 31
(77%) Signs of heart disease, no cause defined 354 3 (3-4) 15
Cardiomyopathy 295 3 (2-3) 12
Dilated cardiomyopathy 223 2 (2-2) 9
Endocardiosis 218 2 (1-2) 9
(myxomatous valvular disease)
Neurologic Idiopathic epilepsy 968 9 (8-9) 52
(82%) Epileptiforme seizures 350 3 (3-4) 19
Signs of disease without defined
cause, cerebrum 115 1 (1-1) 6
Acute inflammatory conditions, meninges 57 0.5 (0.4-0.7) 3
Progressive chronic degenerative
radiculomyelopathy 49 0.4 (0.3-0.6) 3
Other Dead- no diagnosis 2111 19 (18-20) 18
(33%) Pyometra 544 5 (4-5) 5
Signs of disease, no cause defined,
kidney or/and ureters 497 5 (4-5) 4
Diabetes mellitus 474 4 (4-5) 4
Liver insufficiency 358 3 (3-4) 3
1
- Agria Insurance, PO 70306, SE-107 23 Stockholm, Sweden
2
- SP:5 = number dead within 5 specific diagnoses / number dead in this diagnostic category)*100
3
- SP = specific diagnosis proportional mortality = number dead with the specific diagnosis / number dead in this diagnostic
category)*100
tions. In previous studies, it has been shown
that the accuracy of the demographic data in the
insurance database was excellent (Egenvall et
al. 1998) and that the population insured at
Agria is quite similar to the general population
of dogs in Sweden (Egenvall et al. 1999). The
major differences between the insured popula-
tion and the total Swedish population are that a
lower proportion of mongrels are insured, and
there are, of course, more older dogs in the gen-
eral population.
Some of the earlier studies were on limited
years of data, and the earliest one used only
breed-level data (Bonnett et al. 1997, Egenvall
et al. 2000a-c). In the present study six years of
data have been included, dogs could be fol-
lowed individually and it was possible to calcu-
late the actual time of observation for each dog.
This is a dynamic population (dogs may enter
or leave the database) and therefore mortality is
best expressed with MRs that express the oc-
currence of death based on the actual time at
risk. Compared to most of the published studies
on death in breeds of dogs, the database used in
this study provides a large number of cases (for
example deaths by breed or by diagnostic cate-
gory) over several years, making the results less
prone to random error. It is now possible to pre-
sent the mortality with respect to the effect of
for example age, breed and diagnosis simulta-
neously. Comparisons are facilitated across
breeds as to the relative burden of disease. For
example, golden retrievers are one of the most
common breeds of dog in Sweden, with over
68,000 dog years at risk in this database (6% of
the insured population, data not shown). Irish
wolfhounds provide less than 2,000 DYAR.
However, based on 10,000 DYAR there were
over 1,500 deaths in the Irish wolfhound and
only 243 in golden retrievers in insured dogs
under 10 years of age. One might postulate dif-
ferences due to size, i.e. a giant breed vs. a large
one, however, breeds of a similar size to golden
retrievers, e.g. Bernese mountain dogs, dober-
manns and boxers also have a much higher mor-
tality.
As space does not allow presentation of infor-
mation on all breeds in the database, the deci-
sion was made to include the 10 most common
breeds, a group of breeds with both high rates
of death and a sufficient number of dogs to en-
sure good validity for calculated rates and then
to group all other breeds in one group. The 20
specific breeds accounted for approximately
45% of the insured population and one-half of
the deaths. The information provided on the
group of all other breeds and for the whole pop-
ulation offers a useful comparison.
It is important to note that puppy mortality is
not included in the present study and dogs are
only included up to 10 years of age. However, if
one considers that the first 10 years represents
the major part of an expected lifespan for many
breeds, and that it is preferable to target preven-
tion strategies at diseases occurring relatively
early in life, the information presented is highly
relevant to veterinarians in clinical practice, re-
searchers and for dog organisations, breeders
and owners. Although the mortality due to most
causes increased with age, the rate of tumour
deaths started to rise earlier in the high-risk
breeds. This may be related to a faster rate of
aging, i.e. certain breeds may be biologically
older at a given chronological age compared to
other breeds (Albert et al. 1994, Egenvall et al.
2000c). On the other hand, the rate of trauma is
relatively higher in younger ages in common
and other breeds, perhaps related to behaviour.
It is important to take into account the age pat-
tern of disease and possible differences in age
distribution across groups when examining
competing causes of death, as in this and the
companion paper (Egenvall et al. 2005). In
order to die of causes of death that are a result
of aging (for example some cancers) one must
survive to an increased age. This must also be
114 B. N. Bonnett et al.
Acta vet. scand. vol. 46 no. 3, 2005
considered when interpreting proportional esti-
mates for mortality, especially from certain
sources of data (e.g. Craig 2001). Cox regres-
sion, assuming proportional hazards over the
analysed period, is used to analyse time to an
event, in this case death, rather than simply pro-
portions of a breed that have died.
One drawback with the insurance database is
that neuter status is not included. Although,
there may be an increasing trend for elective
spaying and neutering recently in Sweden, data
from 1998 suggest that only about seven per
cent of Swedish bitches and less than four per
cent of males (all ages) are neutered (Egenvall
et al. 1999). This estimate includes dogs spayed
both for medical conditions and non-medical
reasons.
Diagnostic considerations
Because owners tend to terminate their policy
when an animal has died, even if they have not
submitted a claim, the total mortality rate pre-
sumably includes almost all deaths. Any un-
recorded dead dogs would at least be censored
(in the analysis) when their policy was termi-
nated. Only those for whom a claim is pro-
cessed, however, have a diagnosis entered for
the cause of death (although this may include,
dead-no diagnosis, if provided by a veterinar-
ian). A diagnosis was specified for approxi-
mately 70% of all deaths. For some breeds over
85% of deaths had a recorded cause, however,
for mongrels 45% had a diagnosis. The possible
reasons that the death of a life-insured animal
would not have a cause recorded include the
following. The cause of death might not be cov-
ered by the policy, for e.g. behavioural prob-
lems and some inherited problems in certain
breeds. For example, hip dysplasia (HD) is cov-
ered for purebred dogs where the sire and dam
are registered with the Swedish Kennel Club
(SKK) and have been screened HD-free, but is
excluded for mongrels. However, as there are
relatively few exclusions for most breeds it may
be that most cases of death that do not have a di-
agnosis (i.e. were not claimed) arise because
the owner neglects or chooses not to submit a
claim, due to simple omission or, perhaps in
some cases, a reluctance to either deal with the
issue at a painful time or to benefit financially
from the animal's death. For mongrels, life in-
surance benefits may be quite small. It is likely
that for some cases of elective euthanasia (e.g.
behaviour problems, owner convenience) a
claim would not be submitted.
In a previous study, the agreement between di-
agnostic data in the database and in the practice
records was over 80% in all groups evaluated
(Egenvall et al. 1998). The overall consistency
and accuracy of diagnoses made by practicing
veterinarians remains a concern whenever sec-
ondary data are used. Consistency is improved
by the use of a standard diagnostic registry both
within most veterinary practices in Sweden and
when data is recorded in the insurance
database. Only one diagnosis can be recorded
for any case and in general veterinarians are re-
sponsible for choosing that designation. Clini-
cians often use rather non-specific diagnoses,
sometimes reflecting the degree to which the
case has been resolved (claims may be submit-
ted before final test results are received or own-
ers may elect euthanasia rather than pursue ex-
pensive tests to achieve a definitive diagnosis),
but often because of time constraints or practi-
cal limitations of using the diagnostic registry.
For example, one of the most common diag-
noses was 'dead – no diagnosis' or similar vari-
ants. For the heart system, five diagnoses cap-
tured 77% of deaths. However, some of these
designations were very non-specific, e.g. 'signs
of disease, no cause defined'. In consideration
of all these limitations of veterinary diagnoses,
both in general and specifically in these insur-
ance data, rather crude diagnostic categories
were used, which have been amalgamated over
Mortality in over 350.000 Swedish dogs I 115
Acta vet. scand. vol. 46 no. 3, 2005
different specific diagnoses, and for which rea-
sonable accuracy can be presumed. Future stud-
ies on specific diseases may require further val-
idation of the diagnostic criteria being used by
veterinarians.
Overall, among the general diagnostic cate-
gories, tumour and trauma had the highest mor-
tality rates (each accounting for almost one fifth
of all deaths). Studies of lifetime risk have sug-
gested a wide range in estimates of deaths due
to cancer, for example, from 3% of deaths in
military working German shepherds (Peterson
et al. 2000) to 27% of dogs from a German
study (Eichelberg & Seine 1996) and 16% of all
deaths in the UK (Michell 1999).
Among all dogs the specific diagnoses with the
highest mortality rates were car accident (ap-
proximately 21 per 10,000 DYAR), dead-no di-
agnosis (19 per 10,000 DYAR), epileptic and
epileptic-like seizures, hip dysplasia, signs of
heart failure and disc herniation. In spite of ex-
tensive monitoring of HD among purebred
dogs, and given that dogs claimed for HD
would be from HD-free parents, this disease
still remains a common problem in many
breeds.
Road traffic accidents were the cause of death
in approximately 0.2% (data not shown) of in-
sured dogs (all breeds) under 10 years of age.
This constituted five per cent of all deaths. Swe-
den is a country with remarkably few stray dogs
and these insured dogs are a 'cared-for' popula-
tion (i.e. receiving veterinary care) yet car acci-
dents are the most common single cause of
death. In a survey of owner reported causes of
death in the UK, including lifetime deaths, 3%
were due to car accidents (Michell 1999). Given
that younger dogs are more prone to accidental
death, age composition may partially explain
the higher proportion in this population. How-
ever, caution must be used in comparing pro-
portional estimates, as it may be that the actual
rate of traumatic death might not be different.
True population rates of road traffic accident
deaths are not readily available. In general,
these findings are in agreement with our previ-
ous studies, in spite of some differences in
defining diagnostic categories, and using either
total deaths (Egenvall et al. 2000c) or those
with a diagnostic code (Egenvall et al. 2000a).
As this study incorporates data from six years,
these are likely better estimates than the ones
previously published. These statistics for trau-
matic death are important, especially if you
consider road traffic accident deaths to be
mainly preventable by humans.
Breeds and causes of death
Mortality rates calculated using the exact time
at risk are useful for comparison of the occur-
rence of death between breeds within this pop-
ulation and for comparison with other estimates
from the literature. Even breeds with a similar
lifespan may have very different age patterns of
mortality. Although they must be interpreted
carefully, proportional mortality statistics are a
useful adjunct to MRs in completing the picture
on the pattern of death within various cate-
gories. From a population perspective it is
interesting to identify those breeds that account
for significant proportions of death within that
population. For example, German shepherds
represent approximately 7% of the total popula-
tion of insured dogs (in table 1 80,049DYAR/
1,098,358DYAR=7%), but account for almost
12% of the total mortality. The 10 high-risk
breeds account for approximately 5% of the
population and 11% of the mortality. If these
breeds and German shepherd dogs are com-
bined, the 11 breeds represent 12% of the in-
sured population and account for almost one
quarter of all deaths. Several breeds account for
a lower proportion of the total mortality, for ex-
ample golden retrievers constitute 6% of the to-
tal DYAR and less than 4% of total deaths.
Heart disease in the Cavalier King Charles
116 B. N. Bonnett et al.
Acta vet. scand. vol. 46 no. 3, 2005
spaniel accounts for over 50% of deaths in that
breed (in dogs under 10 years of age) and for
over one-quarter of the heart deaths in the in-
sured population. Although heart disease in
Cavalier King Charles spaniels is well recog-
nized (Häggström et al. 1992), these statistics
give further insight into the impact of this cause
of death in this breed. By comparison, in Irish
wolfhounds, although the actual rate of mortal-
ity due to heart disease is higher than in the
Cavalier King Charles spaniel, that diagnostic
category accounts for only 25% of deaths in
Irish wolfhounds as they also have other fre-
quent causes of death. Irish wolfhounds repre-
sent only 2.7% of all heart deaths in the popu-
lation, as they as are a less common breed (data
not shown). How should these statistics be most
effectively used? Mortality rates can be moni-
tored over time to see if there is an increase or
decrease in the actual incidence due to, for ex-
ample, breeding practices. The perception of
the commonness of disease occurrence by vet-
erinarians will be a reflection of the population
level proportional mortalities, which are also of
interest to the insurance company. Proportional
mortalities within a breed should inform health
strategies among dog breeders, helping them to
focus on those diseases causing the most deaths
at "too early an age" in their breed.
Notwithstanding the potential usefulness of
proportional mortalities, they must be viewed
with caution, especially when presented in the
absence of actual mortality rates. Craig (2001)
presents proportional statistics from a necropsy
database and concludes that golden retrievers
have an increased risk of tumours similar to that
for boxers. In this study, the actual rate of tu-
mours in boxers is almost four times higher
than that in golden retrievers.
Almost 50% of all deaths in drevers and minia-
ture dachshunds and 37% in dachshunds were
due to trauma, although the actual rate in dre-
vers was more than twice that for both types of
dachshunds. With these similar proportional
mortalities, traumatic death is of similar impor-
tance within each breed. However, drevers ac-
count for 11% of all deaths due to trauma in the
insured population (data not shown) although
they are only 3% of all insured dogs. Most dre-
vers and many dachshunds are used in hunting
in Sweden and the specific behavioural charac-
teristics for which they are selected also make
them prone to roaming. Notwithstanding, the
degree to which they die due to traumatic
causes is somewhat alarming. The influence of
usage on causes of death has been previously
reported, for example by Anderson & Rosen-
blatt (1965) who found that field beagles were
killed by motor accidents to a very large extent,
compared to laboratory beagles that died be-
cause of tumours to an overwhelming extent.
These findings remind us to be very conscious
of the source of data when comparing mortality
statistics.
Both the types of trauma and reasons behind an
increased risk may vary by breed. Mongrels,
miniature and toy poodles and greyhounds also
have a high proportional mortality for trauma.
For greyhounds, fractures were a common
cause of death due to trauma (data not shown).
Perhaps smaller dogs may be no more likely to
be hit by a car, but may be more likely to die if
they are. People may be less likely to pay for ex-
pensive veterinary care for mongrels following
an accident. Given the human element in trau-
matic deaths in dogs, these statistics might be
considered in discussions relative to responsi-
ble pet ownership.
Both Irish wolfhounds and Bernese mountain
dogs have approximately 300 deaths due to tu-
mours per 10,000 DYAR in dogs less than 10
years of age. The MR for boxers is 200 per
10,000 DYAR. Within the breed, a dying boxer
(under 10 years of age) has a 37% chance that it
is due to tumour and a Bernese mountain dog
41%, whereas tumour deaths are 22% of all
Mortality in over 350.000 Swedish dogs I 117
Acta vet. scand. vol. 46 no. 3, 2005
deaths in Irish wolfhounds. Obviously tumours
are an important consideration for these breeds
and within the population. Nielen (2001)
showed a high level of relatedness, inbreeding
and litter per sire ratio for Dutch Bernese
mountain dogs. Although it is possible to esti-
mate the relative risk for a cause of death by di-
viding the MR for each breed, it is important to
consider other possible factors, such as gender
influences and differences in age distribution.
Further discussion is presented below, and ad-
justed estimates of relative risks from multi-
variable models are presented in the companion
paper (Egenvall et al. 2005).
An example of the potential for misinterpreta-
tion of breed risk based on anecdote can be seen
for the neurologic system. Golden retrievers
and German shepherd dogs account for 6% and
8% of neurologic deaths so the impression of
veterinarians might be that this is a common
disease in these breeds. However, that is at least
partially due to their frequency in the popula-
tion. In fact, they do not have a high MR nor an
increased risk for death due to neurologic dis-
orders compared to other breeds. The highest
incidence is in the St. Bernard, great Dane and
boxer. According to the multivariable results
(see companion paper, Egenvall et al. 2005)
these three breeds have a significantly increased
risk, whereas Labrador retrievers, and both reg-
ular and miniature dachshunds have signifi-
cantly decreased mortality rates compared to all
other breeds.
Gender
In general, for total and diagnostic mortality
and for trauma, locomotor, heart and neurolog-
ical categories, females had a significantly re-
duced risk of death. In certain breeds and for
some causes strong effects were seen. For ex-
ample male St. Bernards and Bernese mountain
dogs were at least 2.5 times more likely to die
of neurological causes compared to females
(MRR for death = 0.4) and male Newfound-
lands and greyhounds were over twice as likely
to die of locomotor disorders (MRR for female
= 0.5). In many breeds males were significantly
more likely to die from heart causes, for exam-
ple, as much as five times more than females for
great Danes.
Although the effect was not significant for all
breeds, in general females were at up to two
times greater risk of dying from tumours, per-
haps not surprising considering the incidence
of mammary cancer. However, the notable ex-
ception was that among Bernese mountain dogs
females were significantly less likely to die with
a diagnosis of neoplasia. A further exploration
of these differences is presented in the multi-
variable analysis in the companion paper
(Egenvall et al. 2005).
Female German shepherd dogs were less likely
to die from other diagnoses. Although there
were many causes of death in this category, the
two most common for that breed were exocrine
pancreatic insufficiency and circumanal fistulae
(data not shown). An increased risk of males for
these conditions has been reported in the litera-
ture (Budsberg et al. 1985, Wiberg 2004).
Improving the health of the population of pure-
bred dogs should be considered not only from a
medical perspective but also in terms of animal
welfare (Ott 1996). In our role as stewards of
animal populations, it could be argued that we
have a duty to identify and try to reduce pre-
ventable disease. These detailed statistics on
mortality in various breeds provide a valuable
picture of the important causes of death in a
large and well-defined population of dogs. To
further elucidate the age pattern of death and
the relative risk of death across breeds, adjust-
ing for gender and age distribution, multivari-
able analysis and survival analysis are pre-
sented in the companion paper (Egenvall et al.
2005).
118 B. N. Bonnett et al.
Acta vet. scand. vol. 46 no. 3, 2005
Acknowledgements
This work has been supported by grants from the
Foundation for Research, Agria Insurance.
References
Albert RE, Benjamin SA, Shukla R: Life span and
cancer mortality in the Beagle dog and humans.
Mech. Ag. Develop.1994. 74, 149-159.
Allison P. Survival analysis using the SAS
®
system: a
practical guide. Cary, 1995.
Bonnett BN, Egenvall A, Olson P, Hedhammar Å:
Mortality in insured Swedish dogs: rates and di-
agnostic category of death in various breeds. Vet.
Rec. 1997. 141, 40-44.
Bredal WP, Moe L, Glattre E: Demographic charac-
teristics of Bernese mountain dogs in Norway.
Ken. Veter.1994. 18, 283
Breslow NE, Day NE: Statistical methods in Cancer
Research. Volume II. The design and analysis of
cohort studies. Lyon, 1987
Bronzon RT: Variation in age at death of dogs of dif-
ferent sexes and breeds. Am. J. Vet Res. 1982. 43,
2057-2059
Budsberg SC, Spurgeon TL, Liggitt HD: Anatomic
predisposition to perianal fistulae formation in the
German shepherd dog. Am. J. Vet Res. 1985. 46,
1468-1472.
Craig LE: Cause of death in dogs according to breed:
a necropsy survey of five breeds. J. Am. Anim.
Hosp. Assoc. 2001. 37, 438-443.
Deeb BJ, Wolf NS: Studying longevity and morbidity
in giant and small breeds of dogs. Vet. Med. 1994.
89 suppl, 702-713.
Dobson JM, Milstein SS, Rogers K, Wood JL: Canine
neoplasia in the UK: estimates of incidence rates
from a population of insured dogs. J. Small Anim.
Pract. 2002. 43, 240-246.
Egenvall A, Bonnett BN, Olson P, Hedhammar Å:
Validation of computerized Swedish dog and cat
insurance data against veterinary practice records.
Prev. Vet. Med. 1998. 36, 51-65.
Egenvall A, Bonnett BN, Olson P, Hedhammar Å:
Gender, age, breed and geographic pattern of
morbidity and mortality in insured dogs during
1995 and 1996. Vet. Rec. 2000a. 146, 519-525.
Egenvall A, Bonnett BN, Olson P, Hedhammar Å:
Gender, age and breed pattern of diagnoses for
veterinary care events in insured dogs during
1996. Vet. Rec. 2000b. 146, 551-557.
Egenvall A, Bonnett BN, Olson P, Hedhammar Å:
Mortality in over 350,000 insured Swedish dogs
from 1995-2000: II. Breed-specific age and sur-
vival patterns and relative risk for causes of death
Acta vet scand. 2005, 46, 121-136.
Egenvall A, Bonnett BN, Shoukri M, Olson P, Hed-
hammar Å, Dohoo I: (2000c) Age pattern of mor-
tality in eight breeds of insured dogs in Sweden.
Prev. Vet. Med. 2000c. 1503, 1-14.
Egenvall A, Bonnett BN, Öhagen, P, Olson P, Hed-
hammar Å, von Euler H: Incidence of and sur-
vival after mammary tumours in a population of
over 80,000 insured female dogs in Sweden from
1995-2002. Prev. Vet. Med. (in press)
Egenvall A, Hedhammar Å, Bonnett BN, Olson P:
Survey of the Swedish dog population: Age, Gen-
der, Breed, Location and Enrolment in Animal In-
surance. Acta Vet. Scand. 1999. 40, 231-240.
Eichelberg H, Seine R: Lebenserwartung and
Todeursachen bei Hunden 1. Zur Situation bei
Mischlingen und verschieden Rassehunden (Life
expectancy and cause of death in dogs). Berl.
Münch. Tierärzt. Woch. 1996. 109, 292-303 (In
German).
Häggström J, Hansson K, Kvart C, Swenson L:
Chronic valvular disease in the Cavalier King
Charles Spaniel. Vet. Rec.1992. 131, 549-553.
Michell A: Longevity of British breeds of dogs and
relationships with sex, size, cardiovascular vari-
ables and disease. Vet. Rec. 1999. 145, 625-629.
Nielen AL, van der Beck S. Ubbink GJ, Knol BW:
Population parameters to compare dog breeds:
differences between five Dutch purebred popula-
tions. Vet. Q. 2001. 23, 43-39.
Ott RS: Animal selection and breeding techniques
that create diseased populations and compromise
welfare. J. Amer. Vet. Med.Ass. 1996. 12, 1969-
1974.
Peterson MR, Frommelt RA, Dunn DG: A study of
the lifetime occurrence of neoplasia and breed
differences in a cohort of German Shepherd Dogs
and Belgian Malinois military working dogs that
died in 1992. J. Vet. Int. Med. 2000. 14, 140-145
Svenska Djursjukhusföreningen (Swedish animal
hospital association): Diagnosregister för häst,
hund och katt. Diagnostic registry for the horse,
the dog and the cat . Taberg, 1993. (In Swedish)
Wiberg ME: Pancreatic acinar atrophy in German
shepherd dogs and rough-coated collies. Etio-
pathogenesis, diagnosis and treatment. A review.
Vet. Q. 2004. 26, 61-75
Mortality in over 350.000 Swedish dogs I 119
Acta vet. scand. vol. 46 no. 3, 2005
Sammanfattning
Mortalitet hos hund baserad på data från över 350
000 svenska hundar försäkrade under 1995 till 2000:
1. Ras-, ålders-, köns- och orsaksspecifika rater.
I denna studie presenteras data från över 350 000 för-
säkrade svenska hundar, med en ålder upp till 10 år,
som tillsammans har bidragit med över en miljon
hundår av risk (HÅR) under åren 1995 till 2000. To-
talt dog eller avlivades 43 172 hundar. Av dessa hade
72% fått en dödsorsaksdiagnos. Den totala mortalite-
ten var 393 dödsfall per 10 000 HÅR. Mortalitet ut-
räknades generellt och per dödsorsak för de 10 vanli-
gaste hundraserna, för 10 hundraser med hög mor-
talitet och för en övrig grupp. Flera typer av propor-
tionell mortalitet presenteras. Fem generella orsaker
stod för 62% av alla dödsfall där diagnos förelåg – tu-
mörer (18%), trauma (17%), problem från rörelseap-
paraten (13%), hjärta (8%) och neurologiska problem
(6%). Mortaliteten för de fem vanligaste diagnoserna
inom de generella dödsorsakerna presenteras. Denna
detaljerade mortalitetsstatistik kan användas både för
rasspecifika strategier och för mer generella hälsobe-
främjande åtgärder.
120 B. N. Bonnett et al.
Acta vet. scand. vol. 46 no. 3, 2005
(Received January 27, 2005; accepted 12 April, 2005).
Reprints may be obtained from: A. Egenvall, Department of Clinical Sciences, Faculty of Veterinary Medicine
and Animal Science, Swedish University of Agricultural Sciences, SE-750 07 Uppsala, Sweden.