Báo cáo y học: "Association between synovial fluid levels of aggrecan ARGS fragments and radiographic progression in knee osteoarthritis" pdf
Bạn đang xem bản rút gọn của tài liệu. Xem và tải ngay bản đầy đủ của tài liệu tại đây (587.63 KB, 10 trang )
RESEARCH ARTICLE Open Access
Association between synovial fluid levels of
aggrecan ARGS fragments and radiographic
progression in knee osteoarthritis
Staffan Larsson
1*
, Martin Englund
1,2
, André Struglics
1
, L Stefan Lohmander
1
Abstract
Introduction: Aggrecanase cleavage at the
392
Glu-
393
Ala bond in the interglobular domain (IGD) of aggrecan,
releasing N-terminal
393
ARGS fragments, is an early key event in arthritis and joint injuries. We determined whether
synovial fluid (SF) levels of ARGS-aggrecan distinguish subjects with progressive radiographic knee osteoarthritis
(ROA) from those with stable or no ROA.
Methods: We studied 141 subjects who, at examination A, had been given meniscectomies an average of 18 years
earlier (range, 15 to 22 years). Seventeen individuals without surgery, and without known injury to the menisci or
cruciate ligaments, were used as references. At examinations A and B, with a mean follow-up time of 7.5 years, we
obtained SF and standing tibiofemoral and skyline patellofemoral radiographs. SF ARGS-aggrecan was measured
with an electrochemilumin escence immunoassay, and we graded radiographs according to the OARSI atlas. The
association between SF ARGS levels at examination A and progression of radiographic features of knee OA
between examinations A and B was assessed by using logistic regression adjusted for age, gender, body mass
index, and time between examinations, and stratified by ROA status at examination A.
Results: We found a weak negative association between SF ARGS concentrations and loss of joint space: the
likelihood of progression of radiographic joint space narrowing decreased 0.9 times per picomole per milliliter
increase in ARGS (odds ratio (OR) 0.89; 95% confidence interval (CI), 0.79 to 0.996). In subjects with and without
preexisting ROA at examination A, the association was OR, 0.96; 0.81 to 1.13; and 0.77; 0.62 to 0.95, respectively.
Average levels of SF ARGS 18 years after me niscectomy were no different from those of reference subjects and
were not correlated to radiographic status at examination A.
Conclusions: In subjects with previous knee meniscectomy but without ROA, levels of SF ARGS-aggrecan were
weakly and inversely associated with increased loss of joint space over a period of 7.5 years.
Introduction
In osteoarthritis (OA), the balance between cartilage-
matrix synthesis and degradation is disturbed, resulting
in a gradual destruction of the articular cartilage [1].
Collagen type II and aggrecan are the two major consti-
tuents of the matri x, and their proteolysis is regarded as
a critical event in joint disease [2-12]. In mouse models
of OA, co llagenolysis by matrix metalloprotease-13 [11],
and aggrecanolysis by aggrecanase-2 [5,6], were proven
crucial for development of disease. Aggrecanolysis may
be a prerequisite for collagenolysis [13]. Molecular frag-
ments resulting from these degradative processes appear
in synovial fluid (SF), blood, and urine, and have been
investigated as biomarkers for diagnosis, disease severity,
onset, or progression [14-16]. The clinical diagnosis of
OA relies on symptoms in combination with radio-
graphic changes, both of which appear late in the dis-
ease process; molecular biomarkers are being tested for
an earlier detection of the disease. Urinary levels of
C-telopeptides of type II collagen (CTX-II) have, for
example, been shown to be associated with both the
presence and the progression of radiographic hip and
knee OA [17]. Proteolytic aggrecan fragments are early
markers of joint-matrix damage [13], and increased
* Correspondence:
1
Department of Orthopedics, Clinical Sciences Lund, Lund University, BMC
C12, Klinikgatan 28, SE-221 84 Lund, Sweden
Full list of author information is available at the end of the article
Larsson et al. Arthritis Research & Therapy 2010, 12:R230
/>© 2010 Larsson et al.; licensee BioMed Central Ltd. This is an open access article distributed under the terms of the Creative Commons
Attribution L icense ( which permits unrestricted use, distribution, and reproduction in
any me dium, provided the original work is properly cited.
levels of proteoglycan in SF were reported in acute
injury and acute inflammatory arthritis [18-21].
We showed with an assay specific for the aggrecanase-
generated ARGS neoepitope that SF levels of ARGS-
aggrecan are increased in human knee disease, and that
measurements of this neoepitope better discriminate
between health and disease t han do aggrecan levels
determined by methods not specific for proteolytic clea-
vage [10,12]. The hypothesis of the present study was
that an association exists between SF ARGS and the
development of radiographic knee OA in a cohort of
individuals after meniscectomy [22-24].
Materials and methods
Subjects
The study was approved by the ethics committee of the
Faculty of Medicine at Lund University; informed con-
sent was obtained from all participants. Subjects were
from a cohort of 317 patients, retrospectively identified
to have undergone isolated meniscectomy at Lund
University Hospital in 1973, 1978, or between 1983 and
1985 [23]. The first examinations (A) were performed in
1994, 1995, and 2000, respectively, and the second
examination (B), in 2004. The mean time from menis-
cectomy to examination A was 18 years, and the mean
time between examinations A and B was 7.5 years
(Table 1). As described [23], rea sons for exclusion were
previous knee surgery, meniscectomy in both knee com-
partments, osteochondritis dissecans, fracture in or adja-
cent to the knee, septic arthritis, osteonecrosis, any
ligament injury, or radiographic signs of knee OA at
the time of surgery. Of 859 identified subjects, 456 ful-
filled criteria and were invited to participate at
examination A; 329 responded, and 317 had radiographs
taken. Here we further excluded subjects with end-stag e
OA (defined subsequently) of the index knee at exami-
nation A. Lack of SF or radiographic or demographic
data at examination A also were reasons for exclusion.
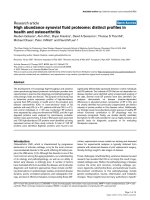
In all, 141 of the available 317 subjects were included in
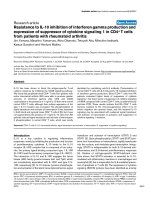
this study (Figure 1, Table 1). These 141 subjects were
studied as one group, or stratified for absence or pre-
sence of radiographic OA (ROA) at e xamination A to
addr ess possible floor or ceiling effects on the SF ARGS
levels created by the quantity or quality (or both) of the
cartilage in the joint.
Reference group
Seventeen indivi duals from a previously describe d refer-
ence group with no known knee injury had SF at exami-
nation B and complete radiographic data, and were
included as references (Table 1) [23].
Radiographic examination
At examination A, we obtained standing anteroposterior
radiographs of the tibiofemoral (TF) joint in about 15
degrees of flexion and a skyline view of the patellofe-
moral (PF) joint with the knee in about 50 degrees of
flexion by using a fluoroscopically positioned x-ray
beam,byusingfilm[24].AtexaminationB,adigitalx-
ray sensor was used, and posteroanterior and lateral
views of th e TF joint obtained by using the fixed flexion
(SynaFlexer) protocol [25,26].
Joint space narrowing (JSN) and osteophytes in the TF
and PF joints were graded on a 4-point scale (0 to 3,
where 0 = no evidence of JSN or osteophytes) according
to, and in comparison with, images provided in the
Table 1 Characteristics of the study subjects
No stratification Stratified ± ROA at examination A References
n = 141 (100%) -ROA, n = 63 (45%) +OA, n = 78 (55%) n = 17 (100%)
Men 116 (82%) 49 (78%) 67 (86%) 15 (88%)
Age at examination A, years 51 (31-73) 51 (32-73) 52 (31-73) 54 (37-70)
BMI at examination A, kg/m
2
26 (18-41) 26 (18-35) 27 (21-41) 26 (20-31)
Years between index surgery and examination A 18 (15-22) 18 (15-22) 18 (15-22) Na
Years between examinations A and B 7.5 (4.0-10.4) 7.1 (4.0-10.1) 7.8 (4.0-10.4) 8.6 (8.6-8.8)
ROA at examination A 78 (55%) 0 (0%) 78 (100%) 1 (6%)
ROA at examination B 106 (75%) 28 (44%) 78 (100%) 1 (6%)
End-stage OA at examination B 31 (22%) 2 (3.2%) 29 (37%) 0 (0)
Arthroplasty or osteotomy at examination B 2 (1.4%)
a
0 (0) 2 (2.6%)
a
0 (0)
Loss of joint space/Progression of the JSN score 76 (54%) 22 (35%) 54 (69%) 2 (12%)
Progression of osteophytes 66 (47%) 21 (33%) 45 (58%) 2 (12%)
Progression of ROA 98 (70%) 35 (56%) 63 (81%) 4 (24%)
SF ARGS at examination A, pmol ARGS/ml 6.95 (0.15-15.07) 6.96 (0.15-14.58) 6.94 (0.31-15.07) Nd
SF ARGS at examination B, pmol ARGS/ml Nd Nd Nd 7.19 (3.63-12.72)
a
One arthroplasty and one osteotomy. Na, not applicable; Nd, not determined. Values are expressed as numbers (%) or mean (range). BMI, body mass index; JSN,
joint space narrowing; OA, osteoarthritis; ROA, radiographic OA.
Larsson et al. Arthritis Research & Therapy 2010, 12:R230
/>Page 2 of 10
1995 atlas of Osteoarthritis Research Society Interna-
tional (OARSI) [27]. Two investigators blinded to clini-
cal data each graded all paired radiographs with
knowledge of the time sequence. Images were reread
with adjudication of discrepancies between the
investigators.
Sum scores of JSN, osteophytes and radiographic
osteoarthritis
The sum of all JSN or osteophyte grades of an index
kneeweretermedtheJSNscoreorosteophytescore;
the sum of all JSN and osteophyte grades in combina-
tion was termed the radiographic osteoarthritis score
(ROA).
Radiographic osteoarthritis score
A knee was def ined a s having ROA with any of th e fol-
lowing scores, according to the 1995 atlas of OARSI [27]:
1. JSN in any TF compartment or the PF compart-
ment of grade 2 or higher.
2. Osteophyte score in the medial or lateral TF com-
partment or the PF compartment of 2 or more.
3. JSN grade 1 and osteophyte grade 1 in the same TF
compartment or JSN grade 1 and osteophyte grade 1 in
the PF compartment.
This cut-off approxi mates grade 2 TF OA on the
Kellgren and Lawrence (K/L) scale [24].
End-stage osteoarthritis
A knee was considered to have end-stage ROA either
(a) with JSN grade 3 in any of the TF compartments or in
the PF compartment, or (b) when a subject had under-
gone subsequent tibial osteotomy or arthroplasty for OA.
Progression of radiographic features of osteoarthritis
We considered progression of the radiographic features
of OA–loss of joint space, progression of osteophytes,
or progression in either or both of those features
(termed progression of ROA)–to have occurred with an
increase from examination A to examination B of the
JSN score, the osteophyte score, or their sum, respec-
tively, by 1 or more in any of the TF compartments or
the PF compartment. This includes both incident JSN
or osteophytes at examination B and worsening of
already existing changes.
Materials
Chemicals were as described [28]. Human recombinant
ADAMTS-4 (a disintegrin and metallopr oteinase with
thrombospondin mo tifs; aggrecanase-1) [29], and mono-
clona l antibody (MAb) OA-1, specific for the N-terminal
ARGS neoepitope generated by aggrecanase cleavage at
the Glu-Ala bond within th e aggrecan interglobular
domain [30], were from GlaxoSmithKline (Collegeville,
PA, USA). MAb AHP0022 against human aggrecan,
described as specific for the hyaluronic acid-binding region
(HABR) by t he manufacturer , and as binding to both G1
and G2 of human aggrecan according to others [31], was
from Invitrogen (Carlsbad, CA, U SA). Chondroitinase
ABC (EC 4.2.2.4), keratanase (EC 3.2.1.103), and kerata-
nase II (from Bacillus sp. Ks36) were from Seikagaku
(Tokyo, Japan). High-bind MA600 96-well microtiter
plates (no. L11XB-1), streptavidin with Sulfo-Tag (strepta-
vidin tagged with the reporter molecule ruthenium(II) tris-
bipyridyl, no. R32AD), 4× Read Buffer T with surfactant
(no. R92TC), and the Sector Imager 6000 with software
Discovery Workbench 2006 MSD_3_0_18 were from
Meso Scale Discovery (MSD, Gaithersburg, MD, USA).
Treatment of SF samples and standard
Knee SF was centrifuged at 3,000 g for 10 minutes at
room temperature, and the supernatant was stored at
-80°C. Twenty-five microliter aliquots of SF samples
were deglycosylated for 3 hours at 37°C in a final
volume of 32.5 μl by using 0.4 mU chondroitinase ABC
and keratanase, and 0.02 mU keratanase II per microli-
ter SF in 50 mM Tris, 50 mM sodium acetate, 10 mM
EDTA, 1 mM AEBSF, and 10 mM NEM, at pH 7. 3.
ARGSstandardwasmadebycompleteADAMTS-4
digestion of human aggrecan , which was extracted from
knee cartilage by 4 M guanidinium hydrochloride and
purified by cesium chloride density-gradient centrifuga-
tion by using the A1D1 fraction, with a subsequent
deglycosylation with chondroitinase ABC (3 mU/μg),
keratanase (1 mU/μg), and keratanase II (0.1 mU/μg), as
described [28].
Measurement of ARGS-aggrecan by aggrecan capture OA-
1 ARGS electrochemiluminescence (ELCL) assay
SF levels of aggrecan fragments containing the ARGS
neoepitope were analyzed by using electrochemilumines-
cence (ELCL) technology on the Meso Scale Discovery
(MSD) platform [32-34].
Available cohort at exam A
n = 317
With SF at exam A
n = 225
Without end-stage OA at exam A
n = 210
With complete data
n = 142
Study cohort
n = 141
No SF at exam A
n = 92
End-stage OA at exam A
n = 15
9 with osteotomies
6 with JSN score = 3 in a TF compartment
Lack of demographic data (2)
or radiographic data at exam A (66)
n = 68
Extreme outlier regarding SF ARGS
n = 1
Figure 1 Flowchart of inclusion and excl usion of subject s in
the study.
Larsson et al. Arthritis Research & Therapy 2010, 12:R230
/>Page 3 of 10
High-bind 96-well microtiter plates were coated over-
nightat4°Cwith25μl/well of anti-human aggrecan
(AHP0022) diluted to 60 μg/ml in PBST (0.01 M
sodium phosphate, 0.138 M sodium chloride, 0.0027 M
potassium chloride, 0.05% Tween 20; pH 7.4). After a
wash (all washes 3 × 400 μl PBST), plates were blocked
for 1 hour at 22°C with 150 μl/well of PBST containing
1% wt/vol BSA and 1% wt/vol nonfat dry milk. Plates
were washed and incubated (2 hours, 22°C, plate shaker)
with 25 μl/well of duplicates of standards (2.5 to 0.0073
pmol ARGS/ml) or SF (final dilutions, 1:4 to 1:26)
diluted in PBST containing 1 % wt/vol BSA. After a
wash, plates were incubated, as described earlier, with
25 μl/well of 1 μg/ml biotinylated anti-ARGS (OA-1)
and 1 μg/ml Sulfo-Tagged streptavidin in PBST contain-
ing 1% wt/ vol BSA. After a final wash, 150 μl/well of 4×
Read Buffer diluted 1:2 in Mil lipore water was added,
and plates were read in a S ector Imager 6000. Sample
concentrations of ARGS-aggrecan were calculated from
the standard curve (four-parameter logistic) by using the
MSD software. A control SF was deglycosylated and pla-
ted in duplicates on each plate and used for inter- and
intraassay precision. Seven SFs were spiked after degly-
cosylation with equimolar concentrations of standard
and analyzed in the ARGS ELCL assay. To assess agree-
ment between the ARGS ELCL assay and a published
ARGSELISAbyusingthesamecaptureantibody
(AHP0022) but a different detection antibody (BC-3;
Abcam, Cambridge, UK) [35], 43 SF samples from a
cross-sectional cohort, spanning a wide range of ARGS
concentrations and diagnoses (eight with acute inflam-
matory arthritis, 35 with acute or chronic knee injuries)
previously analyzed in the ARGS ELISA were analyzed
in the ARGS ELCL assay.
Western blot
To test the specificity of the AHP0022 anti-human
aggrecan antibody, 2.4 μg of human aggrecan standard
was deglycosylated, reduced, and separated on a 3% to
8% Tris-acetate gel, transferred, and probed with
AHP0022 (1:500) or MAb OA-1 (1:2,000) by using
peroxidase-conjugated horse anti-mouse IgG (CST, Dan-
vers, MA; 1:25,000) as second ary antibody, or with anti-
G1 (PA1-1747; Affinity BioReagents, Golden, CO; 1:400)
with peroxidise-conjugated goat anti-rabbit IgG (KPL,
Gaithersburg, MD; 1:75,000), as described [28].
Statistical analysis
We used Pearson’s correlation (r)forcontinuousvari-
ables and Spearman’s rank order correlation (r
S
)when
categoric variables were included. We found SF ARGS
to be normally distributed, as t ested with Shapiro-Wilks
(P = 0.093). For group compa risons, we used analysis of
covariance (ANCOVA); comparison of SF ARGS in
male and female subjects were calculated with and with-
out adjustments for age, BMI, and time betwe en menis-
cectomy and examination A. Longitudinal associations
between SF ARGS at examination A and progression of
radiographic features of knee OA were assessed by
using univariate and multivariate logistic regression.
Odds ratios (ORs) with adjustments for age, gender,
BMI, and time between examinations A and B, and
respective crude ORs were calculated to estimate the
likelihood for progressionofROA.Progressionwas
def ined as both incident ROA and worsening of already
existing ROA at examination A. We also performed
analyses of radiographic progression in knees with or
without ROA at examination A separately. We consid-
ered a value of P < 0.05 to be significant. All tests wer e
two-tailed and performed by using PASW Statistics
(SPSS, Chicago, IL, USA) for Windows, version 17.0.3.
Results
Technical performance of the aggrecan capture OA-1
ARGS ELCL assay
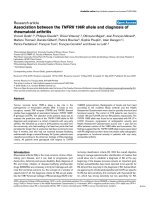
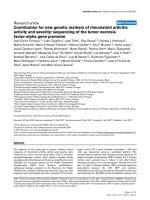
In Western blot analysis of the ADAMTS-4 digested
human aggrecan used as ARGS-standard, the aggrecan
antibody AHP0022 reacts with both G1-containing frag-
ments corresponding to G1-TEGE fragments, and with
the two major ARGS fragment s, ARGS-SELE and
ARGS-chondroitin sulfate-rich domain 1 (CS1), which
both contain the G2 domain but not the G1 domain
(Figure 2a). As noted by others [31], this indicates that
the AHP0022, described by the manufacturer as specific
for the hyalur onic acid-binding region (HABR) of aggre-
can, recognizes an epitope present in both the G1 and
G2 domains, which share homology [36].
Chondroitinase ABC, keratanase, and keratanase II
digestion was necessary at 0.4, 0.4, and 0.02 mU/μlSF,
respectively. Lower concentrations or exclusion of any
of the three enzymes resulted in decreased signal, and
the addition of a hyaluronidase digestion before the
described deglycosylation had no effect on the signal
(not shown). With SFs diluted 1:4 or more, dilution
curves of four SFs w ere parallel to the standard curve
within the same range of ARGS concentration per well
as the standard curve (Figure 2c). Table 2 details the
technical performance of the ARGS ELCL assay. The
mean difference between results obtained with ELISA
and ELCL was 0.71 pmol/ml (Figure 2b).
Patient characteristics, radiographic status, and SF levels
of ARGS-aggrecan
At a mean age of 51 years at examination A, 78 (55%) of
141 subjects h ad ROA 18 years after meniscectomy. At
examination B 7.5 years later, 28 additional subjects had
ROA, or 106 (75%) of 141 (Table 1). This was a consid-
erably higher proportion than that in the r eference
Larsson et al. Arthritis Research & Therapy 2010, 12:R230
/>Page 4 of 10
subjects,ofwhomone(6%)of17hadROAatboth
examination A and at examination B 8.6 years later.
The SF ARGS levels at examination A in the 141 sub-
jects after meniscectomy were normally distributed and
ranged from 0.15 to 15.07 pmol/ml, with a mean of 6.95
pmol/ml. This includes one sample of a subject who
had a concentration below the level of detection that
was assigned a value of 0.15 pmol ARGS/ml (that is,
half the lower limit of detection). One sample of a sub-
ject had an extreme level of ARGS (31 pmol/ml), which
was more than 7 times the interquartile range and was
excluded.
250
150
100
75
50
37
G1-TEGE
ARGS-G2-CS1
ARGS-G2-SELE
G1-TEGE dimer
anti-G1
anti-ARGS
AHP0022
G1-TEGE
A
AHP0022/OA-1 ELCL assay (pmol ARGS/ml)
1 10 100 1000
AHP0022/BC-3 ELISA (pmol ARGS/ml)
1
10
100
1000
r = 0.923
B
ARGS-standard (400 pmol ARGS/ml)
SF (444 pmol ARGS/ml)
SF (131 pmol ARGS/ml)
SF (95 pmol ARGS/ml)
SF (8.7 pmol ARGS/ml)
C
Dilution (1:x)
10100100010 000
Signal (AU)
1000
10 000
100 000
Figure 2 Specificity and technical performance of the aggrecan capture OA-1 ARGS ELCL assay. (a) 2.4 μg of ADAMTS-4-digested and
deglycosylated human aggrecan was separated on a 3 to 8% Tris-acetate gel, transferred and probed with anti-G1, anti-aggrecan (AHP0022), or
anti-ARGS (OA-1). Protein standard molecular weights and aggrecan fragments detected are indicated. Epitopes recognized by the antibodies are
written in color: red, anti-G1; blue, anti-aggrecan (AHP0022); green, anti-ARGS. Aggrecan domains and amino acid sequences: G1 and G2,
globular domains 1 and 2; CS1 and CS2, chondroitin sulfate-rich domains 1 and 2; TEGE and ARGS: C- and N-terminal amino acid sequences at
the aggrecanase cleavage site within the interglobular domain; SELE, C-terminal amino acid sequence of aggrecanase cleavage within the CS2
[1]. (b) ARGS concentration measured with the OA-1 ARGS ELCL assay and the BC-3 ARGS ELISA [35] in 43 individual SFs with a regression line,
dashed line of equality, and Pearson’s correlation coefficient (r). (c) Dilution curves of ARGS-aggrecan standard and four synovial fluids (SFs)
analyzed in the OA-1 ARGS ELCL assay. Sample concentrations of ARGS-aggrecan at different dilutions were calculated from the standard curve
(four-parameter logistic). Dilutions falling within the range of detection of the standard curve (solid symbols within horizontal lines) were used
for linearity of dilution calculations (Table 2), with mean values presented in the legend.
Larsson et al. Arthritis Research & Therapy 2010, 12:R230
/>Page 5 of 10
The average level and range of SF ARGS in the 68
individuals excluded f rom the study because of lack of
demographic or radiographic data (Figure 1) did not dif-
fer from those observed in the included subjects (not
shown).
No SF was available from the reference subjects at
examination A; at examination B, the SF level of ARGS
ranged from 3.63 to 12.72 pmol/ml, with a mean of 7.19
pmol/ml (P = 0.78 compared with ARGS levels in sub-
jects after meniscectomy at examination A).
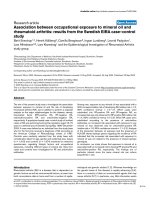
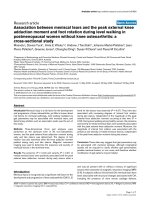
The SF ARGS concentration was higher in men com-
pared with women, with mean (range) values of 7.34
(0.31 to 15.07) and 5.14 (0.15 to 10.71) pmol ARGS/ml,
respectively (P = 0.002; Figure 3a). The difference
remained significant when adjusted for age, BMI, and
time between meniscectomy and examination A (P =
0.005). BMI wa s higher in men (P < 0.001), with mean
(range) values of 27.0 (21.8 to 41.4) kg/m
2
compared
with 23.9 (17.9 to 32.0) kg/m
2
in women. No correla-
tion, however, was seen between SF ARGS and BMI. No
other differences, including radiographic status at exam-
ination A, or progression thereof, were seen between
men and women. SF ARGS showed no correlation with
age (Figure 3b), or any of the radiographic outcom e
scores, alone (Figure 3c and 3d) or in combination
(Figure 3e).
SF ARGS and progression of radiographic features of OA
Independent of stratification for ROA at examination A,
a trend was seen for decreased likelihood of progression
of radiographic features with in creasing SF ARGS levels,
with a mean odds ratio of 0.91 per pmol/ml SF ARGS
(Table 3). A weak but significant negative association
was found with a decrease in likelihood of loss of joint
space with 0.89 times per pmol/ml increase in SF ARGS
(Table 3). This association was stronger in subjects
without ROA, whereas no association remained in those
with ROA at examination A (Table 3).
Discussion
In this cohort of subjects with meniscectomy performed
some 18 years earlier, we found SF ARGS levels no dif-
ferent from those in a reference group (without
menisc ectomy), and with no difference between subjects
with ROA and subjects without. We further found that,
within these relatively low and seemingly normal levels,
SF ARGS and loss of joint space seem to be associated.
However, contrary to our hypothesis, the association is
negative: low levels of SF ARGS are associated with
increased risk of loss of joint space.
We have reported, in acute inflammatory arthritis and
early after injury , extremely el evated levels of SF ARGS,
with a fold increase compared with healthy knee refer-
ences of between 34 and 177, as measured with quantita-
tive Western blot or ELISA, respectively [10,12]. We
concluded that the best underly ing explanation was an
increased aggrecanase activity toward the interglobular
domain (IGD) of aggrecan molecules that, to a large
ext ent, were already C-terminal ly truncated and that the
contributi on from newly synthesized full-length aggrecan
was minor [10,12]. The chondroi tin sulfate (CS) 846 epi-
tope has been suggested to be present mainly on recently
synthesized aggrecan [37], and it was shown to be elevated
two- to threefold in SF up to 20 years after knee injury
compared with those uninjured [38]. In the present study,
a decreased risk of joint space loss was found in subjects
with higher levels of SF ARGS. A possible explanation for
this could be that the higher SF ARGS levels observed
here reflect a tissue-repair response involving an increased
synthesis of aggrecan, in combination with aggrecanase
activity. This would explain both an increase in the release
of ARGS-aggrecan into the synovial fluid, and a decreased
risk of loss of joint space due to an, at least in part, suc-
cessful incorporation of newly synthesized aggrecan in the
tissue. The fact that the negative association between SF
ARGS and loss of joint space is stronger in subjects with-
out ROA present at the examination, further strengthens
the explanation that higher SF ARGS levels indeed reflect
a higher synthetic activity in these subjects. Measuring
only the ARGS neoepitope, we are, however, unable to
ascertain the source of aggrecan fragments being
degraded, which could span everything from newly synthe-
sized aggrec an not incorpora ted into a funct ional matrix
to C-terminally truncated aggrecan resident in the carti-
lage for a long period [39]. To better understand this bal-
ance between synthesis and degradation, our data indicate
Table 2 Technical performance of the aggrecan capture OA-1 ARGS ELCL assay
Range of detection of standards 0.075 to 5 pmol ARGS/ml
Minimum required dilution of SF 1:4
Lower limit of detection in SF 0.3 pmol ARGS/ml SF
Parallelism (obtained/expected) of four SF samples diluted 1:4 to 1:4,000
a
100% (78% to 120%)
b
Spiking recovery of equimolar spiking of seven SF samples 116% (92% to 133%)
b
Intra-assay CV, n =14 3.5%
Inter-assay CV, n =9 16.6%
CV, coefficient of variation; ELCL, electrochemiluminescence; SF, synovial fluid.
a
SFs with 9, 95, 131, and 444 pmol ARGS/ml diluted and read within the range of
detection of the standard curve.
b
Mean (range).
Larsson et al. Arthritis Research & Therapy 2010, 12:R230
/>Page 6 of 10
that the ARGS neoepitope marker may have to be used in
combination with a marker of aggrecan synthesis.
Although both the quality and the quantity of the
joint cartilage are suggested to influe nce the SF levels of
biomarkers [19], we found no correlation between SF
ARGS and radiographic status at the time of sampling
in this dataset. Inclusion of the JSN sum score at exami-
nation A (our best approximation of joint-cartilage
quantity) as an adjustment in the logistic regression
model, did not essentially c hange the results (data not
shown). Although we cannot exclude that the clearance
rate of matrix molecules from the joint cavity might
Age
35 40 45 50 55 60 65 70
ARGS-aggrecan (pmol ARGS/ml SF)
2
4
6
8
10
12
14
Men Women
r = -0.09, P = 0.913
JSN sum score
0123
ARGS-aggrecan (pmol ARGS/ml SF)
2
4
6
8
10
12
14
r
S
= 0.030, P = 0.725
OST sum score
0246810
2
4
6
8
10
12
14
ARGS-aggrecan (pmol ARGS/ml SF)
r
S
= 0.024, P = 0.781
ROA sum score
024681012
2
4
6
8
10
12
14
ARGS-aggrecan (pmol ARGS/ml SF)
r
S
= -0.095, P = 0.263
AB
C
DE
2
4
6
8
10
12
14
ARGS-aggrecan (pmol ARGS/ml SF)
P = 0.005
Figure 3 Distribution of SF levels of ARGS-aggrecan by gender, age, joint space narrowing (JSN) sum score, osteophyte (OST) sum
score, and the sum of the JSN and OST sum scores, termed radiographic OA (ROA) sum score. Open boxes or circles represent men;
grey boxes and circles represent women. (a) A box plot of SF ARGS in men (n = 116) and women (n = 25). The ends of the boxes define the
25
th
and 75
th
percentiles, with a line at the median, error bars defining the 10
th
and 90
th
percentiles and circles for individual outliers. Shaded
area with line defines the 25
th
and 75
th
percentiles and median of the non-operated reference group (n = 17). Group difference was assessed by
ANCOVA adjusted for age, body mass index, and time between meniscectomy and examination A. (b) Regression of SF ARGS and age with
Pearson’s correlation coefficient (r). (c through e) Regression of SF ARGS and JSN, OST, and ROA sum scores with Spearman’s rank order
correlation coefficients (r
S
).
Larsson et al. Arthritis Research & Therapy 2010, 12:R230
/>Page 7 of 10
influence the associations noted here, marker concentra-
tions were measured long after trauma, and a steady
state between markers released into the SF and markers
cleared from the SF has likely occurred [40].
Multiple reports have been published on aggrecan
release into SF in disease [18,19,21,38,41-43]. After knee
injury, SF levels of aggrecan were initially much ele-
vated, but w ith time declined toward level s seen in
uninjured knees [18,38]. The methods used were, how-
ever, not specific for proteolytic neoepitopes, which lim-
its the interpretation of the underlying processes
causing the aggrecan release. Confirming previous
results obtained by protein sequencing [44,45], we
showed with Western blots that the majority of aggre-
can fragments released into SF in disease are aggreca-
nase generated and carry the ARGS-neoepitope [12].
We further showed a strong positive association
between SF ARGS and knee-joint disease including knee
injury, in which greatly elevated levels early after injury
declined over time, with 1-year marker levels approach-
ing those observed in knee-healthy individuals [10]. The
present study is the first to suggest that SF levels of
aggrecanase-generated ARGS fragments are associated
with radiographic progression of OA.
In the search for a biomarker able to predict progres-
sion of OA, sample accessibility, as well as the specificity
of the marker for the joint, tissue, and molecule in ques-
tion, must be taken into consideration. Joint fluid is
more difficult to ob tain than blood or urine, but mar-
kers in SF are more likely to reflect local joint biology
compared with markers in blood or urine. The most
probable source of cartilage markers in knee-joint fluid
is the PF or TF joints. We therefore chose to consider
radiographic progression of OA in both joints, knowing
that mixed patellofemoral and tibiofemoral OA is com-
mon in this meniscectomized sample [24], and that
catabolic products of the cartilage of both joints are
released into the SF.
By using the BIPEDS (Burden of disease, Investigative,
Prognostic of disease, Efficacy of intervention, Diagnos-
tic of disease, and Safety of intervention) classification of
OA biomarkers [14,46], we showed that SF ARGS can
be categorized as a diagnostic marker for disease with
the capability of distinguishing a knee injured up to
1 year af ter injury from knees of healthy controls [10].
Here we showed that 18 years after a knee injury invol-
ving a meniscectomy, SF ARGS doe s not discriminate
subjects with ROA from subjects without, nor can it be
classified as a burden of disease marker for radiographic
status. However, the association between SF ARGS and
loss of join t space indicates a potential for SF ARGS as
a prognostic marker for JSN.
The ELCL assay here used to measure ARGS-aggrecan
is novel, based on an ELISA using a similar approach of
capturing aggrecan fragments by a commercial anti-
human aggrecan antibody and detecting with the BC-3
antibody directed at the ARGS ne oepitope [35]. By using
the same capture antibody, which is reactive against both
G1- and G2-containing aggrecan fragments, together
with the anti-ARGS MAb OA-1 [12,30], we found highly
similar results on the same human SFs. The assay is
more sensitive than the previously used keratan sulfate
capture OA-1 ARGS ELISA [10,30] and is better suited
for analysis of SF s amples low in ARGS, such as those
analyzed herein. The transition from EL ISA to the E LCL
format reduced the required sample volume by fourfold.
Conclusions
We found that concentrations of SF ARGS 18 years
after meniscectomy were inversely associated with loss
of joint space, where low levels of SF ARGS increased
the risk for progression.
Table 3 Odds ratios (ORs) from logistic regression analyses of associations between the examination A ARGS-aggrecan
levels in SF and progression of radiographic features of OA from examination A to examination B at 7.5 years
Total sample Stratified ± ROA at examination A
n = 141 -ROA, n = 63 +ROA, n =78
OR P OR P OR P
Loss of joint space 0.89 (0.80-0.99) 0.029 0.77 (0.63-0.94) 0.012 0.95 (0.82-1.10) 0.47
0.89 (0.79-0.996) 0.043 0.77 (0.62-0.95) 0.016 0.96 (0.81-1.13) 0.60
Osteophyte progression 0.96 (0.87-1.07) 0.48 0.90 (0.76-1.07) 0.23 1.01 (0.88-1.15) 0.94
0.97 (0.87-1.08) 0.59 0.92 (0.76-1.11) 0.38 0.99 (0.86-1.15) 0.93
ROA progression 0.90 (0.80-1.00) 0.059 0.87 (0.74-1.02) 0.092 0.91 (0.77-1.08) 0.30
0.89 (0.78-1.02) 0.10 0.87 (0.72-1.04) 0.13 0.90 (0.73-1.13) 0.37
Outcomes (loss of joint space, osteophyte progression, and ROA progression) are based on progression from examination A to examination B of the scoresof
joint space narrowing (JSN), osteophytes, and either JSN or osteophytes or both, scored a ccording to the OARSI atlas [27]. OR and P values are crude (italics)or
adjusted for age, gender, BMI, and time between examinati ons A and B (plain text), with 95% confidence interval in parentheses.
Larsson et al. Arthritis Research & Therapy 2010, 12:R230
/>Page 8 of 10
Abbreviations
ADAMTS: a disintegrin and metalloproteinase with thrombospondin motifs;
BIPEDS: the OA biomarker classification groups Burden of disease,
Investigative, Prognostic of disease, Efficacy of intervention, Diagnostic of
disease, and Safety of intervention; CS: chondroitin sulfate; CS1: CS-rich
domain 1; CTX-II: C-telopeptides of type II collagen; ELCL:
electrochemiluminescence; ELISA: enzyme-linked immunosorbent assay;
HABR: hyaluronic acid-binding region; IGD: interglobular domain; JSN: joint
space narrowing; MAb: monoclonal antibody; MSD: Meso Scale Discovery;
OA: osteoarthritis; OR: odds ratio; PF: patellofemoral; ROA: radiographic OA;
SF: synovial fluid; TF: tibiofemoral.
Acknowledgements
The authors thank Priya Chockalingam at Pfizer, Cambridge, MA, for sharing
information on their aggrecan capture BC-3 ARGS ELISA with us, and for
analyzing samples for validation. We also thank Michael Pratta and Sanjay
Kumar (GlaxoSmithKline, Collegeville, PA, USA) for the kind gift of ADAMTS-4
and MAb OA-1, our laboratory engineer Maria Hansson and Gail Calvert
from MSD for help in the setup of the ELCL assay, Ludvig Dahl and Björn
Slaug for extraction of data, and Jan-Åke Nilsson for guidance in the
statistical analysis. This study was supported by The Swedish Research
Council (LSL, ME), the Swedish Rheumatism Association (AS, LSL), the Kock
Foundation (AS), the King Gustaf V 80-year Birthday Fund (LSL), the Faculty
of Medicine Lund University (LSL, ME), Region Skåne (LSL, ME), Magnus
Bergvalls Foundation (AS), Alfred Österlunds Foundation (AS), and Swärds/
Eklunds Foundations (AS).
Author details
1
Department of Orthopedics, Clinical Sciences Lund, Lund University, BMC
C12, Klinikgatan 28, SE-221 84 Lund, Sweden.
2
Clinical Epidemiology
Research & Training Unit, Boston University School of Medicine, 650 Albany
Street, Suite X200, Boston, MA 02118, USA.
Authors’ contributions
SL developed and ran the ARGS ECLC assay, carried out the statistical
analysis and interpretation of data, and drafted the manuscript. ME, one of
the principal investigators in the original study of meniscectomy, read and
scored the radiographs together with another investigator (Ludvig Dahl) and
revised the manuscript. AS contributed in the development of the ARGS
ECLC assay and revised the manuscript. LSL conceived the original study of
meniscectomy, collected samples, and revised the manuscript. All authors
participated in the design, interpreted results, and approved the final
manuscript.
Competing interests
The authors declare that they have no competing interests.
Received: 10 September 2010 Revised: 12 November 2010
Accepted: 31 December 2010 Published: 31 December 2010
References
1. Sandy JD: Proteolytic degradation of normal and osteoarthritic cartilage
matrix. In Osteoarthritis 2 edition. Edited by: Brandt KD, Doherty M,
Lohmander LS. Oxford: Oxford University Press; 2003:82-92.
2. Fosang AJ, Last K, Maciewicz RA: Aggrecan is degraded by matrix
metalloproteinases in human arthritis: evidence that matrix
metalloproteinase and aggrecanase activities can be independent. J Clin
Invest 1996, 98:2292-2299.
3. Garnero P, Piperno M, Gineyts E, Ch ristgau S, Delm as PD, Vigno n E: Cross
sectional evaluation of bioch emical markers of bone, cartilage, and
synovial tiss ue metabolism in patients with knee osteoarthritis:
relations wit h disease activity and joint damage. Ann Rheum Dis 2001,
60:619-626.
4. Lohmander LS, Atley LM, Pietka TA, Eyre DR: The release of crosslinked
peptides from type II collagen into human synovial fluid is increased
soon after joint injury and in osteoarthritis. Arthritis Rheum 2003,
48:3130-3139.
5. Glasson SS, Askew R, Sheppard B, Carito B, Blanchet T, Ma HL, Flannery CR,
Peluso D, Kanki K, Yang Z, Majumdar MK, Morris EA: Deletion of active
ADAMTS5 prevents cartilage degradation in a murine model of
osteoarthritis. Nature 2005, 434:644-648.
6. Stanton H, Rogerson FM, East CJ, Golub SB, Lawlor KE, Meeker CT, Little CB,
Last K, Farmer PJ, Campbell IK, Fourie AM, Fosang AJ: ADAMTS5 is the
major aggrecanase in mouse cartilage in vivo and in vitro. Nature 2005,
434:648-652.
7. Hellio Le Graverand MP, Brandt KD, Mazzuca SA, Katz BP, Buck R, Lane KA,
Pickering E, Nemirovskiy OV, Sunyer T, Welsch DJ: Association between
concentrations of urinary type II collagen neoepitope (uTIINE) and joint
space narrowing in patients with knee osteoarthritis. Osteoarthritis
Cartilage 2006, 14:1189-1195.
8. Cibere J, Zhang H, Garnero P, Poole AR, Lobanok T, Saxne T, Kraus VB,
Way A, Thorne A, Wong H, Singer J, Kopec J, Guermazi A, Peterfy C,
Nicolaou S, Munk PL, Esdaile JM: Association of biomarkers with pre-
radiographically defined and radiographically defined knee osteoarthritis
in a population-based study. Arthritis Rheum 2009, 60:1372-1380.
9. Dam EB, Byrjalsen I, Karsdal MA, Qvist P, Christiansen C: Increased urinary
excretion of C-telopeptides of type II collagen (CTX-II) predicts cartilage
loss over 21 months by MRI. Osteoarthritis Cartilage 2009, 17:384-389.
10. Larsson S, Lohmander LS, Struglics A: Synovial fluid level of aggrecan
ARGS fragments is a more sensitive marker of joint disease than
glycosaminoglycan or aggrecan levels: a cross-sectional study. Arthritis
Res Ther 2009, 11:R92.
11. Little CB, Barai A, Burkhardt D, Smith SM, Fosang AJ, Werb Z, Shah M,
Thompson EW: Matrix metalloproteinase 13-deficient mice are resistant
to osteoarthritic cartilage erosion but not chondrocyte hypertrophy or
osteophyte development. Arthritis Rheum 2009, 60:3723-3733.
12. Struglics A, Larsson S, Hansson M, Lohmander LS: Western blot
quantification of aggrecan fragments in human synovial fluid indicates
differences in fragment patterns between joint diseases. Osteoarthritis
Cartilage 2009, 17:497-506.
13. Pratta MA, Yao WQ, Decicco C, Tortorella MD, Liu RQ, Copeland RA,
Magolda R, Newton RC, Trzaskos JM, Arner EC: Aggrecan protects cartilage
collagen from proteolytic cleavage. J Biol Chem
2003, 278:45539-45545.
14.
Bauer DC, Hunter DJ, Abramson SB, Attur M, Corr M, Felson D, Heinegård D,
Jordan JM, Kepler TB, Lane NE, Saxne T, Tyree B, Kraus VB: Classification of
osteoarthritis biomarkers: a proposed approach. Osteoarthritis Cartilage
2006, 14:723-727.
15. Kraus VB: Biomarkers in osteoarthritis. Curr Opin Rheumatol 2005,
17:641-646.
16. Rousseau JC, Delmas PD: Biological markers in osteoarthritis. Nat Clin
Pract Rheumatol 2007, 3:346-356.
17. Reijman M, Hazes JM, Bierma-Zeinstra SM, Koes BW, Christgau S,
Christiansen C, Uitterlinden AG, Pols HA: A new marker for osteoarthritis:
cross-sectional and longitudinal approach. Arthritis Rheum 2004,
50:2471-2478.
18. Lohmander LS, Dahlberg L, Ryd L, Heinegård D: Increased levels of
proteoglycan fragments in knee joint fluid after injury. Arthritis Rheum
1989, 32:1434-1442.
19. Dahlberg L, Ryd L, Heinegård D, Lohmander LS: Proteoglycan fragments in
joint fluid: influence of arthrosis and inflammation. Acta Orthop Scand
1992, 63:417-423.
20. Lohmander LS, Hoerrner LA, Dahlberg L, Roos H, Björnsson S, Lark MW:
Stromelysin, tissue inhibitor of metalloproteinases and proteoglycan
fragments in human knee joint fluid after injury. J Rheumatol 1993,
20:1362-1368.
21. Saxne T, Glennås A, Kvien TK, Melby K, Heinegård D: Release of cartilage
macromolecules into the synovial fluid in patients with acute and
prolonged phases of reactive arthritis. Arthritis Rheum 1993, 36:20-25.
22. Englund M, Roos EM, Lohmander LS: Impact of type of meniscal tear on
radiographic and symptomatic knee osteoarthritis: a sixteen-year
followup of meniscectomy with matched controls. Arthritis Rheum 2003,
48:2178-2187.
23. Englund M, Lohmander LS: Risk factors for symptomatic knee
osteoarthritis fifteen to twenty-two years after meniscectomy. Arthritis
Rheum 2004, 50:2811-2819.
24. Englund M, Lohmander LS: Patellofemoral osteoarthritis coexistent with
tibiofemoral osteoarthritis in a meniscectomy population. Ann Rheum Dis
2005, 64:1721-1726.
25. Peterfy C, Li J, Zaim S, Duryea J, Lynch J, Miaux Y, Yu W, Genant HK:
Comparison of fixed-flexion positioning with fluoroscopic semi-flexed
positioning for quantifying radiographic joint-space width in the knee:
test-retest reproducibility. Skeletal Radiol 2003, 32:128-132.
Larsson et al. Arthritis Research & Therapy 2010, 12:R230
/>Page 9 of 10
26. Kothari M, Guermazi A, von Ingersleben G, Miaux Y, Sieffert M, Block JE,
Stevens R, Peterfy CG: Fixed-flexion radiography of the knee provides
reproducible joint space width measurements in osteoarthritis. Eur Radiol
2004, 14:1568-1573.
27. Altman RD, Hochberg M, Murphy WA Jr, Wolfe F, Lequesne M: Atlas of
individual radiographic features in osteoarthritis. Osteoarthritis Cartilage
1995, 3(suppl A):3-70.
28. Struglics A, Larsson S, Pratta MA, Kumar S, Lark MW, Lohmander LS: Human
osteoarthritis synovial fluid and joint cartilage contain both
aggrecanase- and matrix metalloproteinase-generated aggrecan
fragments. Osteoarthritis Cartilage 2006, 14:101-113.
29. Tortorella MD, Burn TC, Pratta MA, Abbaszade I, Hollis JM, Liu R,
Rosenfeld SA, Copeland RA, Decicco CP, Wynn R, Rockwell A, Yang F,
Duke JL, Solomon K, George H, Bruckner R, Nagase H, Itoh Y, Ellis DM,
Ross H, Wiswall BH, Murphy K, Hillman MC Jr, Hollis GF, Newton RC,
Magolda RL, Trzaskos JM, Arner EC: Purification and cloning of
aggrecanase-1: a member of the ADAMTS family of proteins. Science
1999, 284:1664-1666.
30. Pratta MA, Su JL, Leesnitzer MA, Struglics A, Larsson S, Lohmander LS,
Kumar S: Development and characterization of a highly specific and
sensitive sandwich ELISA for detection of aggrecanase-generated
aggrecan fragments. Osteoarthritis Cartilage 2006, 14:702-713.
31. Swearingen CA, Carpenter JW, Siegel R, Brittain IJ, Dotzlaf J, Durham TB,
Toth JL, Laska DA, Marimuthu J, Liu C, Brown DP, Carter QL, Wiley MR,
Duffin KL, Mitchell PG, Thirunavukkarasu K: Development of a novel clinical
biomarker assay to detect and quantify aggrecanase-generated
aggrecan fragments in human synovial fluid, serum and urine.
Osteoarthritis Cartilage 2010, 18:1150-1158.
32. Deaver DR: A new non-isotopic detection system for immunoassays.
Nature 1995, 377:758-760.
33. Guglielmo-Viret V, Thullier P: Comparison of an electrochemiluminescence
assay in plate format over a colorimetric ELISA, for the detection of ricin
B chain (RCA-B). J Immunol Methods 2007, 328:70-78.
34. Chowdhury F, Williams A, Johnson P: Validation and comparison of two
multiplex technologies, Luminex and Mesoscale Discovery, for human
cytokine profiling. J Immunol Methods 2009, 340:55-64.
35. Chockalingam PS, Sun W, Rivera-Bermudez MA, Zeng W, Dufield DR,
Larsson S, Lohmander LS, Flannery CR, Glasson SS, Georgiadis KE, Morris EA:
Elevated aggrecanase activity in a rat model of joint injury is attenuated
by an aggrecanase specific inhibitor. Osteoarthritis Cartilage .
36. Doege KJ, Sasaki M, Kimura T, Yamada Y: Complete coding sequence and
deduced primary structure of the human cartilage large aggregating
proteoglycan, aggrecan: human-specific repeats, and additional
alternatively spliced forms. J Biol Chem 1991, 266:894-902.
37. Rizkalla G, Reiner A, Bogoch E, Poole AR: Studies of the articular cartilage
proteoglycan aggrecan in health and osteoarthritis: evidence for
molecular heterogeneity and extensive molecular changes in disease. J
Clin Invest 1992, 90:2268-2277.
38. Lohmander LS, Ionescu M, Jugessur H, Poole AR: Changes in joint cartilage
aggrecan after knee injury and in osteoarthritis. Arthritis Rheum 1999,
42:534-544.
39. Lohmander LS, Poole AR: Defining and validating the clinical role of
molecular markers in osteoarthritis. In Osteoarthritis 2 edition. Edited by:
Brandt KD, Doherty M, Lohmander LS. Oxford: Oxford University Press;
2003:468-477.
40. Simkin PA, Bassett JE: Cartilage matrix molecules in serum and synovial
fluid. Curr Opin Rheumatol 1995, 7:346-351.
41. Lohmander LS, Dahlberg L, Eyre D, Lark M, Thonar EJ, Ryd L: Longitudinal
and cross-sectional variability in markers of joint metabolism in patients
with knee pain and articular cartilage abnormalities. Osteoarthritis
Cartilage 1998, 6:351-361.
42. Saxne T, Heinegård D, Wollheim FA, Pettersson H: Difference in cartilage
proteoglycan level in synovial fluid in early rheumatoid arthritis and
reactive arthritis. Lancet 1985, 2:127-128.
43. Saxne T, Heinegård D, Wollheim FA: Therapeutic effects on cartilage
metabolism in arthritis as measured by release of proteoglycan
structures into the synovial fluid. Ann Rheum Dis 1986, 45:491-497.
44. Sandy JD, Flannery CR, Neame PJ, Lohmander LS: The structure of
aggrecan fragments in human synovial fluid: evidence for the
involvement in osteoarthritis of a novel proteinase which cleaves the
Glu 373-Ala 374 bond of the interglobular domain. J Clin Invest 1992,
89:1512-1516.
45. Lohmander LS, Neame PJ, Sandy JD: The structure of aggrecan fragments
in human synovial fluid: evidence that aggrecanase mediates cartilage
degradation in inflammatory joint disease, joint injury, and
osteoarthritis. Arthritis Rheum 1993, 36:1214-1222.
46. Kraus VB, Nevitt M, Sandell LJ: Summary of the OA Biomarkers Workshop
2009 Biochemical Biomarkers: biology, validation, and clinical studies.
Osteoarthritis Cartilage 2010, 18:742-745.
doi:10.1186/ar3217
Cite this article as: Larsson et al.: Association between synov ial fluid
levels of aggrecan ARGS fragments and radiographic progression in
knee osteoarthritis. Arthritis Research & Therapy 2010 12:R230.
Submit your next manuscript to BioMed Central
and take full advantage of:
• Convenient online submission
• Thorough peer review
• No space constraints or color figure charges
• Immediate publication on acceptance
• Inclusion in PubMed, CAS, Scopus and Google Scholar
• Research which is freely available for redistribution
Submit your manuscript at
www.biomedcentral.com/submit
Larsson et al. Arthritis Research & Therapy 2010, 12:R230
/>Page 10 of 10