Báo cáo y học: "Regulation of chondrocyte gene expression by osteogenic protein-1" ppt
Bạn đang xem bản rút gọn của tài liệu. Xem và tải ngay bản đầy đủ của tài liệu tại đây (414.86 KB, 14 trang )
RESEARCH ARTICLE Open Access
Regulation of chondrocyte gene expression by
osteogenic protein-1
Susan Chubinskaya
1,2,3*
, Lori Otten
1
, Stephan Soeder
4
, Jeffrey A Borgia
1,5
, Thomas Aigner
4
, David C Rueger
6
and
Richard F Loeser
7
Abstract
Introduction: The objective of this study was to investigate which genes are regulated by osteogenic protein-1
(OP-1) in human articular chondrocytes using Affimetrix gene array, in order to understand the role of OP-1 in
cartilage homeostasis.
Methods: Chondrocytes enzymatically isolated from 12 normal ankle cartilage samples were cultured in high-density
monolayers and either transfected with OP-1 antisense oligonucleotide in the presence of lipofectin or treated with
recombinant OP-1 (100 ng/ml) for 48 hours followed by RNA isolation. Gene expression profiles were analyzed by
HG-U133A gene chips from Affimetrix. A cut-off was chosen at 1.5-fold difference from controls. Selected gene array
results were verified by real-time PCR and by in vitro measures of proteoglycan synthesis and signal transduction.
Results: OP-1 controls cartilage homeostasis on multiple levels including regulation of genes responsible for
chondrocyte cytoskeleton (cyclin D, Talin1, and Cyclin M1), matrix production, and other anabolic pathways
(transforming growth factor-beta (TGF-b)/ bone morphogenetic protein (BMP), insulin-like growth factor (IGF),
vascular endothelial growth factor (VEGF), genes responsible for bone formation, and so on) as well as regulation
of cytokines, neuro mediators, and various catabolic pathways respons ible for matrix degradation and cell death. In
many of these cases, OP-1 modulated the expression of not only the ligands, but also their receptors, mediato rs of
downstream signaling, kinases responsible for an activation of the pathways, binding proteins responsible for the
inhibition of the pathways, and transcription factors that induce transcriptional responses.
Conclusions: Gene array data strongly suggest a critical role of OP-1 in human cartilage homeostasis. OP-1
regulates numerous metabolic pathways that are not only limited to its well-documented anabolic function, but
also to its anti-catabolic activity. An understanding of OP-1 function in cartilage will provide strong justification for
the application of OP-1 protein as a therapeutic treatment for cartilage regeneration and repair.
Introduction
Cartilage degeneration is one o f the features of osteoar-
thritis (OA). In order to identify cellular mechanisms
that drive OA progression, it is necessary to understand
the interplay between anabolic and catabolic processes
responsible for cartilage homeostasis under physiological
and pathophysiological states. Osteogenic protein-1
(OP-1) or bone morphogenetic protein-7 (BMP-7) is
one of the most potent growth factors for cartilage
maintena nce and repair identified thus far [1,2] . A large
number of in vivo and in vitro studies have shown a
high synthetic potency of human recombinant OP-1
(rhOP-1; [2]). In earlier work, we found that the inhibi-
tion of OP-1 gene expression by antisense oligonucleo-
tides ( ODNs) caused a significant decrease in aggrecan
expression, aggrecan core protein synthesis, and proteo-
glycan (PG) synthesis , which resulted in the deplet ion of
PGs from the cartilage matrix [3]. These findings sug-
gest that OP-1 plays a key role in maintenance of carti-
lage integrity and homeostasis, but further work is
needed to understand the mechanisms by w hich OP-1
acts at the molecular level.
In the current study, we used the Affymetrix Gene-
Chip technology to monitor OP-1 regulation of 22,000
genes from the human genome with specific emphasis
on genes that are relevant to adult articular cartilage.
* Correspondence:
1
Department of Biochemistry, Rush University Medical Center, 1653 W.
Congress Parkway, Chicago, IL 60612, USA
Full list of author information is available at the end of the article
Chubinskaya et al. Arthritis Research & Therapy 2011, 13:R55
/>© 2011 Chubinskaya et al.; licensee BioMed Central Ltd This is an open access article distributed under the terms of the C reative
Commons Attribution License which permits unrestricted use, distribution, and
reproduction in any medium, provided the original work is properly cited
Those included matrix proteins, anabolic and catabolic
gene products, as well as their intracellular regulators
and receptors. Recently, applying the same methodology
differential gene expression pattern in normal and
OA cartilage tissue w as identified [4]. These analyses
revealed numerous interesting gene expression profiles,
but per se did not allow elucidating cellular reaction pat-
terns in response to defined extracellular stimuli. The
goal of the current project was to evaluate the role OP-
1 plays in regulating human articular cartilage homeos-
tasis by using a gene a rray approach under conditions
where endogenous OP-1 gene expression w as inhibited
by antisense ODNs ([3]; OP-1A S) or OP-1 signaling was
activated and/or enhanced by rhOP-1. Key microarray
findings were verified by real-time PCR and additional
in vitro experimen ts of matrix synthesis and signal
transduction. We found that OP-1/BMP-7 controls
numerous metabolic pathways that are not limited t o its
direct anabolic or anti-catabolic function, but also
related t o cell growth, cell proliferation, differentiation,
survival, apoptosis, and death.
Materials and methods
Materials
Dulbecco’ s modified Eagle’ s medium (DMEM) , fetal
bovine serum (FBS), gentamicin, Ham’s F-12, lipo fectin,
Opti-MEM, penicillin/streptomycin/fungizo ne (PSF), 1X
Platinum Quantitative PCR SuperMix-UDG and Super-
Script III reverse transcriptase with oligo (dT)
12-18
were
purchased from Invitrogen (Carlsbad, CA, USA). P hos-
phorothioate ODN was custom synthes ized by Oligos
Etc. (Wilsonville, OR, USA). RN easy mini kit, QIA
shredder, RNase-free DNase kit and QuantiTect Primer
Assay were purchased from Qiagen (Vale ncia, CA,
USA). Real time polymerase chain reaction (PCR) pri-
mers were custom synthesized by Integrated DNA
Technologies (IDT), Coralville, IA, USA. 10,000 X SYBR
Green 1 was purchased f rom Cambrex, Rockland, ME,
USA. Recombinant human rhOP-1 was kindly provided
by Stryker Biotech (Hopkinton, MA, USA).
Isolation and culture of chondrocytes
Full-thickness articular cartilage from the talus of the
talocrural joint (ankle) from 12 human organ donors (age
55 to 70 years old, Collins grade 0 to 1 [5]) and from the
femur of the tibiofemoral joint (knee) from two human
organ donors (age 67 and 73 years old, Collins grade 2)
was obtained from the Gift of Hope Organ and Tissue
Donor Network (Elmhurst, IL, USA) with Institutional
Review Board approval and appropriate consent within
24 hours of the donor’s death. Knee cartilage was utilized
for verification of the ankle cartilage results using real-
time PCR. Chondrocytes were isolated by sequential
digestion with pronase (2 mg/ml) for 60 minutes and
collagenase P (0.25 mg/m l) overnight [6]. Cho ndrocytes
were plated in high density monolayer culture ( 4 × 10
6
cells/well in a six-well plate) and cultured for 24 hours in
50% DMEM/50% Ham’ s F-12 supplemented with 10%
FBS, 1% PSF, and gentamicin (50 μg/ml) for attachment
prior to treatment with either antisense (OP-1 AS) or
recombinant OP-1 (rhOP-1). Both treatments were
administered for 48 hours in the absence of serum.
Phosphorothioate ODNs
Antisen se ODNs were designed to be complementary to
sequences in the 5’-and3’-untransla ted regions of the
human OP-1 messenger RNA (mRNA) sequence
(XM_030621, National Ce nter for Biote chnology Infor-
mation (NCBI)) as described [3]. All verification experi-
ments with appropriate negative controls (sense and
scrambled probes) were performed in a previous study
[3]. For this study, the following antisense ODN was
used: 5’ -GGC-GAA-CGA-AAA-GGC-GAG-TGA-3’
(position 237-257).
Treatment groups
Chondrocyte cultures were divided into three experimen-
tal groups and treated for 48 hours as follows: 1) trans-
fected with OP-1 AS in the presence of 10 μg/ml
lipofectin [3]; 2) treated with 100 ng/ml of rhOP-1; and 3)
culture control (no treatment, no serum).
RNA Isolation
Total cellular RNA was isolated using the RNeasy Mini
Kit, following lysis of the cells with a Qia shredder [7]
and included an on-column DNase digestion, according
to the manufacturer’s instructions (Qiagen). All samples
were stored at -80°C until analyzed.
Microarray and pathway analysis
Gene expression profiles were analyzed by HG-U133A
gene chips from Affimetrix (accession number: E-MTAB-
571). At least 10 μg of RNA/per experimental group was
required for analysis. Therefor e, the RNA was pooled
from donors in order to have sufficient RNA and to
reduce donor-to-donor variations. Cells from all 12
donors were treated with each experimental condition.
The microarray data collection was in compliance with
the Minimum Information About Microarray Experi-
ments standard [8]. The quality of the RNA was checked
by the Agilent Bioanalyzer (Agilent Technologies, Inc.,
Santa Clara, CA, USA), and the quality of the hybridiza-
tion image was checked by the affyPLM model [ 9]. To
deal with the technical variation, each gene was measured
by 11 different probes on the Affymetrix U133A microar-
ray. A statistical model at the probe-level was used to
identify the differentially expressed genes. To estimate
the variance more efficiently with a small sample size, we
Chubinskaya et al. Arthritis Research & Therapy 2011, 13:R55
/>Page 2 of 14
utilized an empirical Bayesian correction of the linear
model [10]. Statistical significance was considered with a
P-value of P < 0.001 and fold change larger than 1.5-fold
between the treatment group and corresponding control.
All the data analysis was conducted using the Bioconduc-
tor/R package [11]. To interpret the biological signifi-
cance of differentially expressed genes, a gene ontology
analysis was conducted using DAVID/EASE [12].
Pathway analysis and classification by gene ontology
Regulated genes (R > 1.5-fold, P < 0.001) were used as
input for both analyses. The ingenuity pathway analysis
system [13] was used to project genes onto known biolo-
gical pathways (canonical pathways). The system deter-
mines a significance value for each pathway based on an
F-statistics that the input-genes occur randomly within
this pathway. Grouping of genes was done by computing
over-rep resentati on of regulated genes in gene ontology
(GO) classes [14]. Statistical analysis consisted of 1) ana-
lysis of differentially expressed genes under a single
experimental condition in comparison to the correspond-
ing control (up- or down-regulated in the presence of
OP-1 antisense or rhOP-1); 2) analysis of differentially
expressed genes when comparison is made between two
treatments (OP-1 antisense and rhOP-1); and 3) gene
ontology, when changes were analyzed within a family of
genes according to their function (comparison was made
between single treatment and control or between both
treatments). Selected gene array results were verified
experimentally in vitro or by real-time PCR.
Validation experiments -quantitative real time PCR
Selected gene array results were verified by real-time
PCR. SuperScript III reverse transcriptase with oligo
(dT)
12-18
was used to transcribe 4 μgofisolatedtotal
RNA into complementary DNA (cDNA) in a total
volume of 20 μl according to the manufacturer’ s
instructions (Invitrogen). Real time PCR primer sets spe-
cific for human b-actin, GAPDH, gremlin-1, IL-6, IL-8,
and LIF-1 (T able 1) were designed using the Primer-
Quest program (Integrated DNA Technologies, Inc.,
Coralville, Iowa, USA). The specificity of t he primers
was verified by testing in BLAST searches [15]. Real
time PCR primer sets spe cific for hum an 18SrRNA and
BMP-2 were purchased from Qiagen. Real time PCR
was performed using the Smart Cycler System (Cepheid,
Sunnyva le, CA, USA). Each 50 μlreactionmixturecon-
tained 1X Platinum Quantitative PCR SuperMix-UDG,
0.5X Smart Cycler additive reagent (0.1 mM Tris, pH
8.0; 0.1 mg of bovine serum albumin per ml, 75 mM
trehalose, and 0.1% Tween 20), 0.5X SYBR Green 1
(vendor stock 10,000X; Cambrex, Rockland, ME), 0.2
μM each o f forward and reverse primer (IDT primers)
or 1 X QuantiTect primers (Qiagen primers) and 1 μl
cDNA (18SrRNA, b-actin, BMP-2, GAPDH, gremlin-1, IL-
6, IL-8)or2μlcDNA(LIF-1). Cycling parameters were:
preheat at 60°C for 120 seconds then 95°C for 120 sec-
onds followed by 40 three-step cycles of 95°C for 15 sec-
onds, various annealing temperatures and times (Table 1)
and 72°C for 30 seconds. After the last amplification
cycle, PCR products were analyzed by melting curve ana-
lysis in the Smart Cycler by s lowly increasing the tem-
perature to 95°C. The reactions were run in triplicate
with appropriate controls (no cDNA template). The data
were analyzed by using the Cepheid Smart Cycler soft-
ware (version 2.0c) and reported as threshold cycle (C
t
).
Change in gene expression was calculated as fold change
=2
-Δ(ΔCt)
, where Δ(ΔC
t
)=(C
t
sample - C
t
housekeeping
gene) - (C
t
control - C
t
housekeeping gene).
Statistical analysis for real-time
PCR Data are expressed as mean +/- standard deviation.
Statistical significance was assessed by the Student t-test
and P-values < 0.05 were considered significant.
Table 1 Sequence of primers for quantitative real time PCR
Primer Orientation Sequence Annealing temp and time Accession no.
18SrRNA Qiagen QuantiTect Primer Assay 62°C, 40 sec [GenBank:X03205]
b-actin Forward 5’-TCCATCATGAAGTGTGACGTGGAC-3’ 62°C, 40 sec [GenBank:NM_001101]
Reverse 5’-TTGATCTTCATTGTGCTGGGTGCC-3’
BMP-2 Qiagen QuantiTect Primer Assay 60°C, 40 sec [GenBank::NM_001200]
GAPDH Forward 5’-TGGACTCCACGACGTACTCAG-3’ 62°C, 40 sec [GenBank:NM_002046]
Reverse 5’-CGGGAAGCTTGTCATCAATGGAA-3’
Gremlin-1 Forward 5’-ATACCTGAAGCGAGACTGGTGCAA-3’ 64°C, 40 sec [GenBank:NM_013372]
Reverse 5’-AACAGAAGCGGTTGATGATGGTGC-3’
IL-6 Forward 5’-GTCAATTCGTTCTGAAGAGGTGAGT-3’ 64°C, 40 sec [GenBank:NM_000600]
Reverse 5’-CCCCAGGAGAAGATTCCAAAGATG-3’
IL-8 Forward 5’-AGACATACTCCAAACCTTTCCACCC-3’ 58°C, 30 sec [GenBank:NM_000584]
Reverse 5’-ATTTCTGTGTTGGCGCAGTGTGGT-3’
LIF-1 Forward 5’-TAAGGAGGCCTCGCAGGATGTC-3’ 64°C, 30 sec [GenBank:NM_002309]
Reverse 5’-TAGTCGTGTACCTTGGCACCTC-3’
Chubinskaya et al. Arthritis Research & Therapy 2011, 13:R55
/>Page 3 of 14
Results
Microarray analysis: overview of data
GeneChip (HG-U133A) expression data from un-stimu-
lated, rhOP-1 and OP-1AS treated chondrocytes
maintained in high-density monolayer culture were gen-
erated. For the analysis of the expression data we used a
three step analytical strategy: (I) processing of raw inten-
sity values and normalization of profiles, (II) examina-
tion of expression levels of gene categories that are
relevant to articular cartilage, and (III) comparison of
gene expression changes between the two treatments -
OP-1AS to knockdown endogenous OP-1 expression vs.
addition of exogenous rhOP-1.
Analyzing the number of differentially expressed genes
(fold changes of larger than 1.5 and corresponding
P-values < 0.001 compared to control) after rhOP-1 or
OP-1AS, we found that rhOP-1 modulated expression of
4,057 genes, while OP-1AS treatment modulated expres-
sion of only 2,618 genes respectively. More genes were
down-regulated than up-regulated by either treatment:
rhOP-1 down-regulated 3,365 genes vs 692 genes that
were up-regulated; while OP-1AS down-regulated 2,364
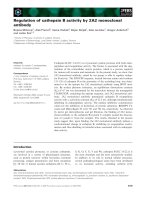
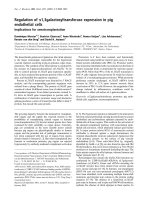
genes and up-regulated only 254 genes. The functional
groups of genes modulated by lack or excess of OP-1 are
depicted in Figure 1. RhOP-1 primarily controlled genes
responsible for molecular function, biological proces ses,
and cellular components, while OP-1AS primarily
affected genes controlling cellular processes and catalytic
activity. Interestingly, either treatment up-regulated fewer
functional groups than the number that were down-regu-
lated (Figure 1). For examp le, rhOP-1 induced only five
functional groups vs four induced by OP-1AS; while
rhOP-1 down-regulated 19 functional groups vs 12
down-regulated by OP-1AS. When the results were com-
pared between the two treatments, we found that very
few gene groups with the same function were differen-
tially regula ted by both treatm ents (Figure 1). Gro ups
regulated by both OP-1 conditions included the genes
responsible for cellular processes (the same number of
genes were up-regulated by either treatment, 100 vs 101),
development, protein binding, signal transducer activity
and signal transduction.
Analysis of catabolic genes: cytokines and their regulators
Previously, we showed that OP-1 was able to counteract
the catabolic activity of IL-1b [16,17] and other catabolic
mediators such as fragments of cartilage matrix, fibro-
nectin and hyaluronan [17-20]. There fore, it was of
interest to determine the effects of OP-1 on gen es regu-
lating pro-catabolic activity. Consistent with an anti-
catabolic function for OP-1, a broad spectrum of genes
with vario us pro-catabolic activities (cytokines and their
Genes up-regulated by rhOP-1
108
173
Genes down-regulated by rhOP-1
268
416
137
144
101
86
83
101
99
110
83
A
B
161
100
173
Binding
Biological Process
Cellular Component
Cellular Process
Molecular Function
161
387
185
260
103
93
130
418
Binding Biological Process
Cell Communication Cell Growth and/or Maintenance
Cellular Com
p
onent Cellular Ph
y
siolo
g
ical Process
150
Molecular
Function
p
yg
Cellular Process Development
Integral to Membrane Membrane
Molecular Function Nucleus
Organismal Physiological Process Protein Binding
Regulation of Transcription, DNA-dependent Response to Stimulus
Signal Transducer Activity Signal Transduction
Trans cri
p
tion
,
DNA-de
p
endent
Genes up-regulated by OP-1AS
62
51
Genes down-regulated by OP-1AS
Catalytic Activity
Cell Proliferation
Cellular Process
CD
62
40
Catalytic Activity
Cellular Process
Signal Transducer Activity
Signal Transduction
410
131
145
198
99
156
196
Development
Extracellular
Morphogenesis
Organogenesis
Plasma Membrane
101
534
179
91
119
106
145
Plasma
Membrane
Protein Binding
Receptor Activity
Signal Transducer Activity
Signal Transduction
Figure 1 Schematic representation of genes grouped according to their function. A, genes up-regulate d by treatment with recombinant
OP-1; B, genes down-regulated by treatment with recombinant OP-1; C, genes up-regulated by OP-1 antisense treatment; D, genes down-
regulated by OP-1 antisense treatment.
Chubinskaya et al. Arthritis Research & Therapy 2011, 13:R55
/>Page 4 of 14
regulators, matrix degrading proteinases, apoptosis-
related genes, neuromediators, transcript ion factors, and
so on) were modulated by OP-1. Multiple cytokines and
chemokines, in particular members of the IL-6 family,
(Figure 2), as well as their receptors and regulators of
their activity (Tables 2 and 3) were found to be regu-
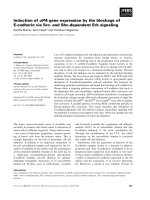
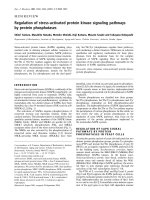
lated by OP-1. Interestingly, among these mediators
only members of the IL-6 family (leukemia inhib itory
factor (LIF), IL-11, IL-8,andIL-6) were differentially
regulated b y the two treatment c onditions: rhOP-1
down-regulated LIF expression by more than 15-fold,
IL-11 expression by more than eight-fold, IL-8 gene by
four-fold and IL-6 by two-fold, respectively (Figure 2A).
Likewise, when endogenous OP-1 was inhibited by OP-
1AS, expression of these four chemokines was elevated
by about two-fold indicating a tight association between
OP-1 levels and expression of members of the IL-6
family. Verification experiments of gene array findings
included both real- time PCR analysis and in vitro meta-
bolic tests (Figure 2). These tests confirmed that when
chondrocytes in high-density monolayer cultures were
treated with rhOP-1 for 48 hours, gene expression of
LIF, IL-6,andIL-8 was inhibited as detected by real-
time PCR, although the magnitude of changes was dif-
ferent from those identified by gene array (Figure 2A,
B). In metabolic studies, we also found that OP-1 could
overcome an inhibitory effect of IL-6 on PG synthesis in
chondrocytes cultured in al ginate beads (Figure 2C). In
addition, our previous studies showed an ability of OP-1
to inhibit mRNA expression of IL-1, IL-6, IL-8,and
other cytokines in primary and immortalized chondro-
cytes [17].
In analyzing t he relationship between treatments to
modulate OP-1 and the exp ression of genes in the IL-6
signaling pathway, we found that OP-1 not only regu-
lates expression of the IL-6 family of cytokines but also
Changes in gene expression of IL-6 family of chemokines
Ar r ay data
A
Real-time PCR
I it ifi ti
B
-4
-2
0
2
ges
Ar r ay
data
A
I
n v
it
ro ver
ifi
ca
ti
on
2.00
2.50
n
ge
-
14
-12
-10
-8
-6
Fold chan
0.50
1.00
1.50
Fold cha
n
-16
14
LIF IL-11 IL-8 IL-6
Genes
OP-1 AS
rhOP-1
GAPDH
Gremlin LIF-1
IL-6
IL-8
0.00
0.50
PG synthesis in cartilage
10% FBS
C
15
2.0
2.5
IL-6
BMP 7+ IL-6
g
DNA
P<0.05
0.5
1.0
1
.
5
ug PG / u
g
0.0
Day 2
Figure 2 Association between OP-1 and IL-6 family of chemokines. A, Effect of lack (OP-1 antisense oligo) or excess of OP-1 (treatment with
recombinant protein, 100 ng/ml, 48 hours) on gene expression of IL-6, IL-8, IL-11, and LIF in chondrocytes cultured in monolayers. Graphical
representation of gene array data. B, Real time PCR of in vitro verification experiments, where knee chondrocytes cultured in monolayers were
treated for 48 hours with the same dose of recombinant OP-1. The graph illustrates an inhibition of LIF, IL-6, and IL-8 gene expression. C,
verification experiments with metabolic study. Proteoglycan synthesis measured in chondrocytes cultured in alginate beads and treated for 48
hours with 100 ng/ml IL-6 (in the presence of 150 ng/ml soluble IL-6 receptor) or the combination of IL-6 and OP-1 (100 ng/ml). Data were
normalized to the DNA content and compared to 10% FBS control. OP-1 was able to overcome an inhibitory effect of IL-6 on PG synthesis.
Chubinskaya et al. Arthritis Research & Therapy 2011, 13:R55
/>Page 5 of 14
controls expression of their receptors and downstream
intracellular mediators including signal transducers and
activators of transcription (STATs), mitogen activated
protein (MAP) kinases, and transcription factors. This
suggests OP-1 inhibits IL-6 signaling at multiple levels
(Table 3). Among other genes that either regulate cyto-
kine activity or mediate their signaling, the most affected
by OP-1 were the receptors for IL-1b and tumor necro-
sis factor alpha (TNF-a) (see Table 2) as well as TN F-a
inducible protein. Although under the experimental
conditions expression of TNF-a and IL-1b genes was
not influenced by OP-1, previous studies showed that
injection of OP-1 i nto nucleus pulposus inhibited
production of autocrine TNF-a and IL-1b elevated in
response to injurious compression of the intervertebral
discs [21] proving an association between OP-1 and sig-
naling pathways of the above mentioned cytokines. In
addition, several other studies have provided evidence of
an ability of OP-1 to regulate either IL-1b induced
responses or IL-1b downstream signaling [16-18,22,23].
Analysis of catabolic genes. Neuromediators
Previous studies have provided evidence that OP-1 may
regulate mediators of pain- related behavior and their
activation in response to injurious compression of the
intervertebral disc and acute cartilage trauma [24-26].
Table 2 Changes in chemokines, cytokines, and their receptors
Gene rhOP-1 vs Cntr OP-1AS vs Cntr
fold change fold change Accession no.
LIF 15.86↓ 2.26↑ [GenBank:NM_002309]
IL-11 8.69↓ 1.82↑ [GenBank:NM_000641]
IL-8 4.01↓ 1.80↑ [GenBank:NM_000584]
IL-6 2.09↓ 1.60↑ [GenBank:NM_000600]
IL-5Ra 2.47↑ 2.40↑ [GenBank:NM_000564]
TNF-a induced
protein 6
2.14↓ [GenBank:NM_007115]
TNF-a induced
protein-3
2.02↓ 1.60↑ [GenBank:NM_006290]
TNF-R12 1.79↓ [GenBank:NM_016639]
TNF-R9 1.73↓ 1.57↓ [GenBank:NM_001561]
TNF-R5 1.88↑ [GenBank:NM_001250]
TNF-13 1.69↓ [GenBank:NM_003808]
IL1-R1 1.59↓ [GenBank:NM_000877]
TNF-R11B (osteoprotegerin) 1.58↓ [GenBank:NM_002546]
IL-13Ra1 1.55↓ [GenBank:NM_001560]
IL-12b 1.74↓ [GenBank:NM_002187]
IL-1R accessory
protein-like 1
1.64↓ [GenBank:NM_014271]
TNF-R6 2.08↓ [GenBank:NM_000043]
Table 3 Changes in the mediators of IL-6 signaling pathway
rhOP-1 vs Cntr OP-1AS vs Cntr
fold change fold change Accession no.
Genes from IL-6 signaling pathway
ELK-1 1.89↓ [GenBank:NM_005229]
IL-6 2.09↓ 1.60↑ [GenBank:NM_000600]
IL-6R 1.81↓ [GenBank:NM_000565]
IL-6 signal transducer (oncostatin M receptor) 1.63↓ [GenBank:NM_002184]
STAT1 2.42↓ [GenBank:NM_007315]
NFBIa 1.86↓ 1.58↑ [GenBank:NM_020529]
Protein inhibitor of activated STAT3 1.84↓ [GenBank:NM_006099]
STAT6 1.53↓ [GenBank:NM_003153]
MAP 3 kinase 7 1.67↓ [GenBank:NM_003188]
MAPK 14 1.52↓ [GenBank:L35253]
MAPK1 1.55↓
Chubinskaya et al. Arthritis Research & Therapy 2011, 13:R55
/>Page 6 of 14
We also reported that injection of OP-1 into nucleus
pulposus down-regulated substance P ex pression [26],
bradykinin and bradykinin inducible receptor b1[26].
Therefore, it was o f interest to examine expression of
neuromediat ors and their receptors in the present array
study. After stimulation for 48 hours with rhOP-1,
expression of the receptors of bradykinin and substance
P was down-regulated (Table 4). Both receptors of bra-
dykinin, constitutively expressed b2andinducibleb1,
were down-regulated by the treatment with OP-1.
Expression of the b1 receptor was differentially regu-
lated under conditions of exce ss and lack of OP-1, that
is, treatment with rhOP-1 inhibited gene expr ession of
this receptor by 1.85-fold, while its expression was up-
regulated by 1.59-fold when endogenous OP-1 expres-
sion was inhibited by antisense oligonucleotides. These
results are consistent with previous data on the protein
level in an in vivo mode l of disc herniation, where injec-
tion of OP-1 into the nucleus pulposus completely abol-
ished bradykinin receptor b1 [26]. Although by gene array
we did not identify significant changes in the expression of
bradykinin and substance P at the time point tested here,
we found changes in substance P receptor and its precur-
sor. We also found that OP-1 inhibited expression of
nerve growth factor-b by almost two-fold.
Analysis of catabolic genes: Transcription factors
Besides cytokines and their receptors, OP-1 also affected
gene expression of transcription factors that regulate
cytokine signaling. Previously, in normal primary and
immortalized chondrocytes, we found that OP-1 inhibits
activation of the nuclear factor kappa-light-chain-enhan-
cer of activated B cells (NF-B) and activator protein-1
(AP-1) transcription factors [17]. Here, expression of a
large set of transcription factors was found to be modu-
lated by OP-1 (Table 5). In addition to common factors
such as NF-B, STAT1 and STAT6, gene array also dis-
covered f actors that repress IL-2 expression, p38 inter-
acting protein, Runx1, and others. The majority of these
transcription factors regulate directly or indirectly (as
p38 interacting protein) transcriptional responses
induced by various pro-inflammatory mediators (IL-1b,
IL-6, matrix fragments). Others, like Runx1, are involved
in the process of chondrogenesis. To further demon-
stratetheeffectofOP-1onactivationoftranscription
factors, we treated cultured cells and found that OP-1
was able to at least part ially inhibit activatio n of NF-B
in primary chondrocytes pre-treated with IL-1b or acti-
vation of Stat-1 in chondrocytes treated with IL-6 and
IL-6 soluble receptor (data not shown).
Analysis of catabolic genes: Matrix degrading proteases,
cathepsins, and apoptosis-related genes
Among other catabolic genes influenced by OP-1 were
the matrix metalloproteinases (MMPs), cathepsins, and
a number of proteases with various modes of action
(Table 6). Thus, expression of membrane t ype-1 MMP
(MMP-14) was inhibited by rhOP-1 by 1.6 -fold (P <
0.001) along with tissue inhibitor of metalloproteinases
(TIMP)-3 (2.06-fold, P <0.001).Atthesametime,
expression of MMP-2 (gelatina se A), which is activated
by MMP-14 [24], was n ot affected by rhOP-1, but was
down-regulated by OP-1AS (2.31-fold, (P < 0.001) as
well as was MMP-9 (gelatinase B) (1.5-fold). Interest-
ingly, the same positive cor relation was found between
the levels of OP-1 and expression of another TIMP,
TIMP-4, which was decreased by 1.7-fold in the OP-
1AS group confirmin g its association with MMP-2 [25].
Parallel changes were observed in other types of p ro-
teases, such as a disintegrin and metalloproteinases
(ADAM)-9, 10, and 28. Their gene expression was down-
regulated under OP-1AS from 2.34 to 1.75-fold. Treat-
ment of chondrocyt es with rhOP-1 inhibited expression
of ADAM-15,-19, as well as urokinase type plasminogen
activator, its receptor, and tra nsglutamianse-2. There
were also some proteinases that w ere up-regulated by
rhOP-1: ADAM-TS7, ADAM-TS12, a nd tissue specific
plasminogen activator suggesting that perhaps these pro-
teins are involved in anabolic/remodeling processes.
Among the proteases that were also regulated by OP-1
were cathepsins B, C, and S. So far, these lysosomal
cysteine proteases have been less studied in cartilage,
though cathepsin C appears to be a central coordinator
for activation of many serine proteases in immune/
inflammatory cells [29], while cathepsin B was thought
to play an important role in the development o f
Table 4 Changes in neuromediators and their receptors
rhOP-1 vs Cntr OP-1AS vs Cntr
fold change fold change Accession no.
Bradykinin Rb1 1.85↓ 1.59↑ [GenBank:NM_000710]
Bradykinin Rb2 1.68↓ [GenBank:NM_000623]
Tachykinin R1 1.64↓ [GenBank:NM_001058]
Nerve growth factor-b 1.93↓ [GenBank:NM_002506]
Tachykinin1 precursor
(Substance K, Substance P)
2.26↓
Chubinskaya et al. Arthritis Research & Therapy 2011, 13:R55
/>Page 7 of 14
Table 5 Changes in transcription factors
rhOP-1 vs Cntr rhOP-1AS vs Cntr
fold change fold change Accession no.
Transcription factor 8 (represses IL-2 expression) 3.28↓ 2.97↓ [GenBank:NM_030751]
NF-B2 2.77↓ [GenBank:NM_002502]
STAT1 2.42↓ [GenBank:NM_007315]
Transcription factor AP-2a 2.07↓ 1.52↓ [GenBank:NM_003220]
Suppression of tumorigenicity 2.04↓ 2.20↓ [GenBank:NM_013437]
Runx1 1.89↓ 1.64↓ [GenBank:NM_001754]
NFBIa 1.86↓ 1.58↑ [GenBank:NM_020529]
NFYb 1.68↓ 1.75↓ [GenBank:NM_006166]
Activating transcription factor 7 1.66↓ [GenBank:NM_006856]
MADS box transcription enhancer factor 2-d 1.65↓ [GenBank:NM_005920]
Upstream transcription factor 2, c-fos interacting 1.58↓ [GenBank:NM_003367]
Transcription factor (p38 interacting protein) 1.57↓ [GenBank:NM_017569]
MADS box transcription enhancer factor 2-C 1.60↑ 1.94↓ [GenBank:NM_002397]
Protein inhibitor of activated STAT3 1.84↓ [GenBank:NM_006099]
Ubiquitin-like 1 (sentrin) 1.60↓ [GenBank:NM_003352]
STAT6 1.53↓ [GenBank:NM_003153]
Table 6 Changes in proteases and their inhibitors
rhOP-1 vs Cntr rhOP-1AS vs Cntr
fold change fold change Accession no.
Bcl-2 2.45↓ [GenBank:NM_001191]
Caspase 4, apoptosis-related cysteine protease 2.11↓ 1.59↓ [GenBank:NM_001225]
Programmed cell death 8 (apoptosis-inducing factor) 1.70↓ [GenBank:NM_004208]
Calpain 9 1.55↓ [GenBank:NM_006615]
Caspase 6 2.18↓ [GenBank:NM_001226]
Caspase 8 1.82↓ [GenBank:NM_001228]
Caspase 2 1.50↑ [GenBank:NM_001224]
MMPs and inhibitors
TIMP-3 2.06↓ [GenBank:NM_000362]
MMP-14 1.55↓ [GenBank:NM_004995]
MMP-2 2.31↓ [GenBank:NM_004530]
TIMP-4 1.69↓ [GenBank:NM_003256]
MMP-9 1.50↓ [GenBank:NM_004994]
ADAM and ADAMTS
ADAM-19 1.83↓ [GenBank:NM_023038]
ADAM-15 1.51↓ [GenBank:NM_003815]
ADAMTS-12 1.88↑ 2.03↑ [GenBank:NM_030955]
ADAMTS-7 1.58↑ [GenBank:NM_014272]
ADAM-10 2.34↓ [GenBank:NM_001110]
ADAM-28 1.63↓ [GenBank:NM_014265]
ADAM-9 1.61↓ [GenBank:NM_003816]
ADAM-7 1.56↑ [GenBank:NM_003817]
Cathepsins
Cathepsin B 2.14↓ [GenBank:NM_001908]
Cathepsin C 1.75↓ [GenBank:NM_001814]
Cathepsin S 1.75↓ [GenBank:NM_004079]
Other proteases
Transglutaminase 2 2.10↓ [GenBank:NM_004613]
Plasminogen activator-urokinase 1.57↓
[GenBank:NM_002658]
Tissue
Plasminogen Activator 1.56↑ [GenBank:NM_000930]
Chubinskaya et al. Arthritis Research & Therapy 2011, 13:R55
/>Page 8 of 14
osteoarthritis [30]. Expression of all three cathepsin
genes was down-regulated under OP-1AS.
A previous study on acute impact injury in vivo [31]
strongly suggested an anti-apoptotic effect of OP-1 in
post-traumatic OA. Therefore, we expected that OP-1
may control genes involved in apoptosis-related pro-
cesses. We found that rhOP-1 inhibited program cell
death 8 gene (a poptosis-ind uced factor), Bcl-2 gene and
the calpain-9 gene (Table 6). However, the key caspases
that trigger and promote cell death by apoptosis were
not affected. During the absence of OP-1 (antise nse
treatment), expression of caspases 8, 9, and 6 were
inhibited and only caspase 2 was elevated (Table 6). The
reason for a down-regulation of the apoptosis-related
genes under conditions where OP-1 is la cking is not
clear, but may be a response to help avoid cell death.
Analysis of anabolic genes: transforming growth factor-
beta (TGF-b)/BMP family, their receptors and regulators of
signaling
Affimetrix analysis identified a very interesting effect of
OP-1 on members of the BMP/TGF-b family (Table 7).
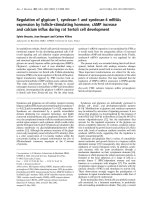
Treatment with rhOP-1 down-regulated expression of
growth differentiation factor (GDF)-15, BMP-2, and Acti-
vin A, and BMP-2 inducible kinase, while inhibition of OP-
1 expression up-regulated GDF-15 and Activin A. Down-
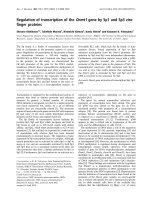
regulation of BMP-2 expression in chondrocytes treated
with rhOP-1 was confirmed by real-time PCR (Figure 3).
Antisense reduction of OP-1 levels resulted in down-regu-
lation of GDF-10 and TGF-a expression (Table 7). Further-
more, a correlation was also found between OP-1 and the
mediators of its downstream signaling, where OP-1AS
treatment inhibited expression of transcription factors, Id
proteins 2 to 4 (Table 7), binding protein Gremlin (Figure
2), and MAD genes. Changes in Id genes correlat ed wi th
the earlier findings from our laboratory, which demon-
strated that the treatment of chondrocytes with rhOP-1 le d
to the elevation of Id1, Id2,andId3 genes an d proteins
[32]. Contrary to changes in the Gremlin gene, which
showed a positive correlation with OP-1 levels, expression
of Follistatin binding protein was inhibited by more than
two-fold in chondrocytes treated with rhOP-1.
In addition, OP-1 modulated expression of the TGF-
b/BMP receptors. With the exception of Activin-a RIB,
Table 7 Changes in the expression of TGF-b/BMP family related genes, their receptors, and signaling regulators
rhOP-1 vs Cntr rhOP-1AS vs Cntr
fold change fold change Accession no.
GDF-15 3.04↓ 2.03↑ [GenBank:NM_004864]
BMP-2 2.67↓ [GenBank:NM_001200]
Inhibin-ba (activin A) 2.32↓ 2.15↑ [GenBank:NM_002192]
BMP-2 inducible kinase 1.61↓ [GenBank:NM_017593]
Parathyroid hormone-like hormone 1.60↓ 2.17↑ [GenBank:NM_002820]
ID2 2.32↓ [GenBank:NM_002166]
Notch 4 2.32↓ [GenBank:NM_004557]
MAD-6 2.05↓ [GenBank:NM_005585]
Gremlin 1.88↑ 1.94↓ [GenBank:NM_013372]
GDF-10 1.86↓ [GenBank:NM_004962]
ID4 1.82↑ 1.84↓ [GenBank:NM_001546]
ID3 1.73↓ [GenBank:NM_002167]
MAD interacting protein 1.69↓ [GenBank:NM_004799]
MAD-4 1.67↓ [GenBank:NM_005359]
Notch 1 1.65↓ [GenBank:NM_017617]
MAD-7 1.62↓ [GenBank:NM_005904]
TGF-a 1.54↓
Receptors
Frizzled homolog 10 (Drosophila) 1.57↓ [GenBank:NM_007197]
Activin-a RI 1.53↓ [GenBank:NM_001105]
Activin A-RIIB 2.42↓ [GenBank:NM_001106]
BMPR1A 1.83↓ [GenBank:NM_004329]
TGF-bRI 1.51↓ [GenBank:NM_004612]
TGF-bRIII 1.50↓ [GenBank:NM_003
243]
TGF-b R2 1.58↑ [GenBank:NM_003242]
Activin A-RIB 1.53↑ [GenBank:NM_004302]
Bone formation
Osteomodulin 1.78↑ 2.56↓ [GenBank:NM_005014]
Chubinskaya et al. Arthritis Research & Therapy 2011, 13:R55
/>Page 9 of 14
which was inhibited by rhOP-1 and elevated under the
lack of OP-1, expression of o ther receptors, Activin-a
RIIB, BMPR1A, TGF-b RI, II, and III correlated posi-
tively with OP-1 expression (Table 7).
Analysis of anabolic genes: other growth factors
Previously we showed that rhOP-1 stimulated expres-
sion of insulin-like growth factor (IGF)-1 and IGF-1
receptor genes [17], while inhibition of OP-1 gene
expression by OP-1AS down-regulated mRNA expres-
sion of these genes. We have also documented a syner-
gistic effect of OP-1 on IGF-1 induced responses in
normal and OA chondrocytes [33,34 ]. Here, we con-
firmed an association between OP-1 and IGF-1 path-
ways by documenting a 1.73-fold decrease in IGF-1
receptor expression and a decrease in two IGF-1 binding
proteins-5 and 7 (1.9- and 1.5-fold respectively) under
OP-1AS. Furthermore, other genes within the IGF-1 sig-
naling pathway were regulated by OP-1. Among them
were PIK3R1, PRKAR2B, MAP2K2, PDE3B,andSOCS3
(Table 8).
Modulati on of OP-1 levels affected mRNA expression
of growth factors and some of their receptors that belong
to various families, such as Nerve Growth Factor-b, Vas-
cular Endothelial Growth Factor, Endothelial Cell Growth
Factor 1 (platelet-derived), Capillary Morphogenesis Pro-
tein-1, and Fibroblast Growth Factor (FGF)-7. Their
expression was inhibited by rhOP-1 from 1.93- to 1.5-
fold. Contrary, the expression of the FGF-R2 and 3 recep-
tors, and a and b receptors of Platelet-Derived Growth
Factor was stimulated by rhOP-1 Table 8).
Matrix proteins and their receptors
Cartilage-specific matrix genes were found to be
modulated by rhOP-1 treatment. Exp ression of the
collagen type IX-a3 chain and cartilage oligomeric
protein (COMP) was up-regulated by about 1.5-fold in
chondrocytes treated with rhOP-1 (Table 9). Among
proteoglycans, versican was affected the most (by
about three-fold down-regulation by OP-1AS) and syn-
decan was differentially regulated under both rhOP-1
and OP-1AS treatments. There were a number of
other matrix genes regulated by OP-1: bone sialopro-
tein, osteonectin, cadherins, chondroitin sulfate PG4
and dermatan sulfate PG3 (Table 9). As expected,
there was a positive correlation between OP-1 and
CD44 expression. Inhibition of OP-1 expression
resulted in 2.34-fold reduction in CD44 expression.
However, contrary to previously published data [35],
rhOP-1 inhibited hyaluronan synthase 2 expression.
A number of basement membrane proteins were
modulated by OP-1: a1,2,3, and five chains of collagen
type IV, laminin, versican among others. Gene expres-
sion of bamacan and laminin was inhibited by rhOP-1
OP-1 treated
1.2
P<0.001
06
0.8
1
hange
0.2
0.4
0
.
6
F old c
3.98-fold
0
GAPDH 18SrRN A BM P-2
Gene names
Figure 3 Effect of OP-1 on BMP-2 gene expression.Realtime
PCR of in vitro verification experiments, where knee chondrocytes
cultured in monolayers were treated for 48 hours with 100 ng/ml
recombinant OP-1. The graph illustrates an inhibition of BMP-2
mRNA expression.
Table 8 Association between OP-1 and other growth
factors including igf-1, insulin, and tyrosine-kinase
signaling
rhOP-1 vs
Cntr
OP-1AS vs
Cntr
fold
change
fold change
IGF-BP1 2.17↓
Nerve growth factor-b 1.93↓
VEGF-b 1.62↓ 1.50↓
Endothelial cell growth factor 1
(platelet-derived)
1.56↓
VEGF 1.52↓
Capillary morphogenesis protein 1 1.52↓
FGF-7 2.87↓
FGF-R2 1.69↑ 2.83↓
IGF-BP5 1.90↓
FGF-R3 1.87↑ 1.80↓
IGF-1R 1.73↓
PDGF-Ra 1.62↑ 1.70↓
PDGF-Rb 1.68↓
IGF-BP7 1.58↓
IRS2 (insulin receptor substrate 2) 2.10↓ 1.70↑
DPYSL2 (dihydropyrimidinase-like 2) 1.60↑ 1.60↓
MET (hepatocyte growth factor receptor) 1.70↓ 1.60↑
SPRY2: sprouty homolog 2 (Drosophila) 1.60↓ 1.60↑
SORBS1: sorbin and SH3 domain containing
1
1.70↑ 1.50↓
PIK3R1 (Phosphoinositide-3-kinase,
regulatory subunit 1)
1.72↑
MAP2K2 (mitogen-activated protein kinase
kinase 2)
1.61↑
PDE3B (phosphodiesterase 3B, cGMP-
inhibited)
2.00↑
SOCS3 (suppressor
of cytokine signaling 3) 1.79↑
Chubinskaya et al. Arthritis Research & Therapy 2011, 13:R55
/>Page 10 of 14
and stimulated under OP-1AS. OP-1 also modulated
expression of collagens that are not cartilage-specific,
such as collagen type I, IV, V, VI, VIII, XIV, and XVI.
Their expression was inhibited under the OP-1AS
treatment (Table 9). The greatest decrease in mRNA
expression was found for a1anda2chainsoftypeI
collagen (more than 2.6-fold).
Discussion
To the best of our knowledge, this is the first report that
uses microarray analysis to provide a comprehensive
understanding of the role OP-1 plays in overall cartilage
homeostasis. We found that OP-1 controls cartilage
homeostasis on multiple levels including regulation of
genes responsible for chondrocyte cytoskeleton (cyclin D,
Talin1,andCyclin M1, for example, and confirmed in
[36]), matrix production and other anabolic pathways, as
well as regulation of cytokines and various catabolic path-
ways responsible for matrix degradation and cell death.
Importantly, in many of these cases, OP-1 modulated the
express ion of not only the ligands, but also their recep-
tors, mediators of downstream signaling, kinases respon-
sible for an activation of the pathways and transcri ption
factors that induce transcriptional responses.
Table 9 Changes in the expression of matrix proteins, their receptors, and integrins
rhOP-1 vs Cntr OP-1AS vs Cntr
fold change fold change Accession no.
Matrix proteins
Collagen IV-a3 1.82↓ 1.54↓ [GenBank:NM_000091]
Laminin-b1 1.65↓ 3.38↓ [GenBank:NM_002291]
Chondroitin sulfate PG6 (bamacan) 1.60↓ 1.52↑ [GenBank:NM_005445]
Versican (chondroitin sulfate PG2) 2.98↓ [GenBank:NM_004385]
Collagen I-a1 2.63↓ [GenBank:NM_000088]
Collagen XIV-a1 2.59↓ [GenBank:NM_021110]
Collagen I-a2 2.57↓ [GenBank:NM_000089]
Cartilage associated protein 2.13↓ [GenBank:NM_006371]
Cadherin 11 (OB-cadherin (osteoblast)) 2.03↓ [GenBank:NM_001797]
Collagen XVI-a1 2.00↓ [GenBank:NM_001856]
Dermatan Sulfate PG3 1.57↑ 1.95↓ [GenBank:NM_004950]
Collagen V-a1 1.89↓ [GenBank:NM_000093]
Bone sialoprotein 1.83↓ [GenBank:NM_004967]
Collagen VIII-a2 1.73↓ [GenBank:NM_005202]
Collagen VI-a1 1.70↓ [GenBank:NM_001848]
Collagen IV-a1 1.70↓ [GenBank:NM_001845]
Collagen IV-a2 1.69↓ [GenBank:NM_001846]
Syndecan 1.58↑ 1.67↓ [GenBank:NM_002997]
Collagen V-a2
1.65↓ [GenBank:NM_000393
]
Osteonectin 1.51↓ [GenBank:NM_003118]
Cadherin 19 1.50↓ [GenBank:NM_021153]
Collagen IX-a3 1.59↑ [GenBank:NM_001853]
Cadherin 1.54↑ [GenBank:NM_001408]
COMP 1.52↑ [GenBank:NM_000095]
Collagen IV-a5 1.89↑ [GenBank:NM_000495]
Chondroitin sulfate PG4 1.64↑ [GenBank:NM_001897]
Matrix protein receptors
HAS2 1.78↓ [GenBank:NM_005328]
CD44 2.34↓ [GenBank:NM_000610]
Integrins
Integrin-a5 1.77↓ [GenBank:NM_002205]
Integrin-b4 1.64↓ [GenBank:AF011375]
Integrin-a6 2.34↓ [GenBank:NM_000210]
Integrin-b-like 1 2.07↓ [GenBank:NM_004791]
Integrin-b3 1.72↓ [GenBank:NM_000212]
Integrin-aE 1.70↓ [GenBank:NM_002208]
Chubinskaya et al. Arthritis Research & Therapy 2011, 13:R55
/>Page 11 of 14
Due to high variability among human samples, only a
few s tudies have utilized microarray analysis to test the
entire human genome in primary adult articular chon-
drocytes [4,37-39], and only one of Saas et al. [4]
addre ssed in part the effect of BMP-7/OP-1. These ana-
lyses used the tissue from one or a maximum of two
donor cartilage samp les. In the present study, normal
(grade 0) articular cartilage was collected from 12
donors within a similar age range. One of the limitations
of the study is that we examined gene expression pro-
files only at one time point, after 48-hours of culture.
Therefore, changes in early-response genes and late-
response genes might have been missed. This could
explain some results, as for example, the lack of changes
in the expression of major cartilage matrix proteins.
However, such an approach gave us a breath of the
overall effects of OP-1 on cartilage homeostasis.
Due to the abundance of the results, we will discuss
only the most relevant and those that could be
explained by the current knowledge of the field. Perhaps
most important was the finding that OP-1 is a unique
growth factor in its capacity to display simultaneously
pro-anabolic and anti-catabolic activities. It was pre-
viously shown that OP-1 stimulate d expression and
synthesis of collagen type II, aggrecan, hyaluronan, and
CD44 [1,2,20,40] as well as IGF-1, IGF-1 receptor, and
responses to I GF-1 [17]. In the current studies, we used
high-density monolayers while in previous work explants
or alginate beads were used with different media condi-
tions (no serum vs serum or ITS-media). The finding
that the microarray results shown here were compara ble
to the previous results suggest that the pro-anabolic
effects of OP-1 in human articular chondrocytes are
persistent. With regard to the anti-catabolic activity, the
ability of OP-1 to counteract various pro-inflammatory/
catabolic responses or directly inhibit expression of cata-
bolicmediatorswaspreviouslyshowninprimarychon-
drocyte cultures or in animal models of post-traumatic
osteoarthritis or disc degeneration [17-19,24,31]. In this
study, we found that OP-1 inhibits expression of IL-6
and members of the IL-6 family of chemokines as well
as their receptors and signaling mediators. Further-
more, the tight association between these two classes
of mediators (OP-1 and IL-6) was documented under
both experimental conditions (plus or minus OP-1).
Based on our new data on the role of IL-6 in acute
post-traumatic responses [41], it is possible that OP-1
was able to protect cartilage from degenerative
changes caused by acute trauma [31] not only due to
its direct effect on matrix synthesis, but also because
of its ability to inhibit IL-6, TNF-a, and the catabolic
pathways induced by the fragments of the extracellular
matrix: fibronectin [19], hyaluronan [20], and collagen
telopeptides [42].
Another important effect of OP-1 may be an ability to
inhibit expression of neuromediators and their receptors.
Previously, an anti-pain effect of OP-1 was documented
in the rat models of herniated disc or disc degenerat ion
induced by injurious compression. In these studies, OP-1
injections reduced hyperalgesia and inhibited elevation of
IL-1, TNF-a, substance P, bradykinin and their receptors
in various disc tissues including spinal cord and dorsal
ganglion [21,24,26]. In chondrocytes, it is the first report
that indicates a connection between OP-1 and various
neuromediators, though substance P and its NK-1 recep-
tor were already identified in cartilage in the model of
mechanical stress [43]. Very recently, our findings
received another proof in phase I placebo-controlled clin-
ical studies on OP-1 treatment for osteoarthritis patients
[44], in w hich a single injection of OP-1 reduced pain
even after six months of treatment.
Interesting results were found with regard to the abil-
ity o f OP-1 to regulate the TGF-b/BMP signaling path-
way. The levels of OP-1 expression positively correlated
with the expression of activin-like kinase (ALK)-3 or
BMP-RIA, transcription factors Id proteins 2 to 4, and a
bin ding protein Gremlin, indicating that this could be a
primary route for OP-1 signaling. We also found that
another binding protein, Follistatin, exhibited a negative
correlation with the levels of OP-1. Thus, our results
suggest a differential regulation of these two binding
proteins by OP-1, which could mean that Gremlin and
Follistatin perform distinct functions in the m ediating
BMP responses or they are involved in different stages
of signaling. This point of view is supported by studi es
of Tardif et al. [45] who reported their differential
expression and spatial distribution in the d og OA
model. One of the most surprising results was the find-
ing that OP-1 inhibits expression of another member of
the BMP family, BMP-2, which shares the same signal-
ing machinery and in many c ases exhibits similar ana-
bolic activities [23,46]. This result was confirmed by
real-time PCR and definitely warrants further studies in
understanding the responses induced by homologous,
yet very different members of the same family [16].
Finally, another unexpected result was the inhibition of
TIMP-3 expression by rhOP-1; while previously, TGF- b
has been shown to induce this inhibitor [47]. The differ-
ences in the results could be attributed to distinct culture
conditions (primary chondrocytes in our case and pas-
saged chondrocytes as in Qureshi et al. [47], assessment
at various time points, or distinct signaling mechanisms
between TGF-b and OP-1 that are responsible for induc-
tion of TIMP-3 expression. However, on the protein level
it has already been reported that OP-1 inhibits TIMP-3
protein [48]. Furthermore, changes in TIMP-3 were par-
allel to changes in certain genes responsible for apoptosis,
which supports the notion that in cancer cells TIMP-3
Chubinskaya et al. Arthritis Research & Therapy 2011, 13:R55
/>Page 12 of 14
may promote cell death by apoptosis [28]. On the other
hand, TIMP-3 has bee n shown to inhibit aggrecanase-
mediated release of glycosaminoglycans in bovine nasal
cartilage [49]. At this point, the role of TIMP-3 in
human chondrocytes and its regulation by various media-
tors remains to be investigated.
Conclusions
This analysis of gene array data strongly suggests a criti-
cal role of OP-1 in human cartilage homeostasis. O P-1
regulates numerous metabolic pathways that are not
only limited to its anabolic function, but also to its anti-
catabolic activity. Understanding of OP-1 function in
cartil age will provide strong justificat ion for the applica-
tion of OP-1 protein as therapeutic treatment for carti-
lage regeneration and repair.
Abbreviations
ADAM: a disintegrin and metalloproteinase; ALK: activin-like kinase; AP-1:
activator protein-1; AS: antisense; Bcl-2: B-cell lymphoma 2; BMP: bone
morphogenetic proteins; cDNA: complementary DNA; DMEM: Dulbecco’s
modified Eagle’s medium; FBS: fetal bovine serum; FGF: fibroblast growth
factor; GDF: growth differentiation factor; IGF: insulin-like growth factor; IL:
interleukin; LIF: leukemia inhibitory factor; MAP kinase: mitogen activated
protein kinase; MMP: matrix metalloproteinase; NCBI: National Center for
Biotechnology Information; NF-κB: nuclear factor kappa-light-chain-enhancer
of activated B cells; OA: osteoarthritis; ODNs: oligonucleotides; OP-1:
osteogenic protein-1; PCR: polymerase chain reaction; PG: proteoglycan; PSF:
penicillin/streptomycin/fungizone; rhOP-1: recombinant OP-1; RNA:
ribonucleic acid; Runx1: runt-related transcription factor 1; STATs: signal
transducers and activators of transcription; TGF-β: transforming growth
factor-beta; TIMP: tissue inhibitor of metalloproteinases; TNF-α: tumor
necrosis factor-alpha; VEGF: vascular endothelial growth factor.
Acknowledgements
The authors would like to acknowledge the Gift of Hope Organ & Tissue
Donor Network and donors’ families as well as Dr. Margulis for tissue
procurement. The work was supported by the NIH grant AR 47654, Stryker
Biotech grant SC-001, and Ciba-Geigy Endowed Chair (SC). RFL was
supported by NIH grant AG016697.
Author details
1
Department of Biochemistry, Rush University Medical Center, 1653 W.
Congress Parkway, Chicago, IL 60612, USA.
2
Department of Orthopedic
Surgery, Rush University Medical Center, 1653 W. Congress Parkway, Chicago,
IL 60612, USA.
3
Section of Rheumatology, Rush University Medical Center,
1653 W. Congress Parkway, Chicago, IL 60612, USA.
4
Klinikum Coburg GmbH,
Ketschendorfer Str. 33, D - 96450 Coburg, Germany.
5
Department of
Pathology, Rush University Medical Center, 1653 W. Congress Parkway,
Chicago, IL 60612, USA.
6
Stryker Biotech, 35 South Street, Hopkinton, MA
01748, USA.
7
Wake Forest University School of Medicine, Medical Center
Blvd, Winston-Salem, NC 27157, USA.
Authors’ contributions
SC was the principle investigator on the project, developed conceptual idea,
wrote the research proposal, obtained research funding and IRB approval,
oversaw the progress of the study and acquisition of the project related
data, coordinated efforts of the participants, wrote progress reports to the
funding agencies (NIH, Stryker Biotech and Ciba-Geigy Endowed Chair), and
was involved in the writing of the manuscript.
LO was the research assistant in the laboratory of Dr. Susan Chubinskaya.
She performed all validation experiments, starting from cell culture and real-
time PCR, analyzed gene array data and prepared the first draft of the
manuscript. TA provided resources and performed gene expression analysis
by Affimetrix gene array. SS was a postdoctoral fellow in the laboratory of
the PI, Dr. Chubinskaya. He was solely responsible for all initial experiments:
design of antisense oligonucleotides, cell isolation, culture, transfection, RNA
isolation, and quality control of the RNA. JB is a collaborator on the project
and assisted with validation experiments: probe design and real time PCR.
He also was involved in the editing of the manuscript. DCR was a senior
director of R&D at Stryker Biotech. He was involved in the conceptual
development of the project, its objectives, specific aims, and experimental
design. He also provided all necessary tools for the project: background
knowledge on OP-1 gene, OP-1 cDNA library, recombinant OP-1, and OP-1
antibodies. He also was a main consultant on the project. RFL is a long-term
collaborator of the PI, who is also collaborator on this project. All IGF-related
experiments were done in Dr. Loeser’s laboratory as a joint effort. He was
also actively involved in data analysis and production of the manuscript as a
final editor.
Competing interests
Stryker Biotech provided partial research support and reagents. SC served on
the scientific advisory board of Stryker Biotech in 2005-2006. DCR, co-author
of the manuscript, was an employee of Stryker Biotech at the time the data
were collected; he has retired and no longer works at Stryker Biotech. The
other authors declare that they have no competing interests.
Received: 5 January 2011 Revised: 15 February 2011
Accepted: 29 March 2011 Publi shed: 29 March 2011
References
1. Chubinskaya S, Kuettner KE: Regulation of osteogenic proteins by
chondrocytes. Int J Biochem Cell Biol 2003, 35:1323-1340.
2. Chubinskaya S, Hurtig M, Rueger DC: (OP-1/BMP-7) in cartilage repair. In
vitro and in vivo study. In Bone Morphogenetic Proteins: From Local to
Systemic Therapeutics. Edited by: Birkhauser VS. Berlin: Springer Verlag;
2007:277-317.
3. Söder S, Hakimiyan A, Rueger DC, Kuettner KE, Aigner T, Chubinskaya S:
Antisense inhibition of osteogenic protein-1 disturbs human articular
cartilage integrity. Arthritis Rheum 2005, 52:468-478.
4. Saas J, Haag J, Rueger DC, Chubinskaya S, Sohler F, Bartnik E, Aigner T: IL-
1β, but not BMP-7 implicates a dramatic change in the gene expression
pattern of human adult articular chondrocytes. Cytokines 2006, 36:90-99.
5. Collins DH: Osteoarthritis. Chapter V. The Pathology of Articular and Spinal
Diseases London: Edward Arnold Publishers; 1949, 74-115.
6. Aydelotte MB, Kuettner KE: Differences between sub-populations of
cultured bovine articular chondrocytes. I. Morphology and cartilage
matrix production. Connect Tissue Res 1988, 18:205-222.
7. Bau B, Haag J, Schmid E, Kaiser M, Gebhard PM, Aigner T: Bone
morphogenetic protein-mediating receptor-associated Smads as well as
common Smad are expressed in human articular chondrocytes but not
up-regulated or down-regulated in osteoarthritic cartilage. J Bone Miner
Res 2002, 17:2141-2150.
8. Brazma A, Hingamp P, Quackenbush J, Sherlock G, Spellman P, Stoeckert C,
Aach J, Ansorge W, Ball CA, Causton HC, Gaasterland T, Glenisson P,
Holstege FC, Kim IF, Markowitz V, Matese JC, Parkinson H, Robinson A,
Sarkans U, Schulze-Kremer S, Stewart J, Taylor R, Vilo J, Vingron M:
Minimum information about a microarray experiment (MIAME)-toward
standards for microarray data. Nat Genet 2001, 29:365-371.
9. Irizarry RA, Bolstad BM, Collin F, Cope LM, Hobbs B, Speed TP: Summaries
of Affymetrix GeneChip probe level data. Nucleic Acids Res 2003, 31:e15.
10. Wettenhall JM, Smyth GK: limmaGUI: a graphical user interface for linear
modeling of microarray data. Bioinformatics 2004, 20:3705-3706.
11. Dudoit S, Gentleman RC, Quackenbush J: Open source software for the
analysis of microarray data. Biotechniques 2003, , Suppl: 45-51.
12. Hosack DA, Dennis G Jr, Sherman BT, Lane HC, Lempicki RA: Identifying
biological themes within lists of genes with EASE. Genome Biol 2003, 4:
R70.
13. Ingenuity pathway system. [].
14. Gene Ontology analysis. [].
15. BLAST search. [ />16. Chubinskaya S, Segalite D, Pikovsky D, Hakimiyan AA, Rueger DC: Effects
induced
by BMPS in cultures of human articular chondrocytes:
comparative studies. Growth Factors 2008, 26:275-283.
17. Im HJ, Pacione C, Chubinskaya S, Van Wijnen AJ, Sun Y, Loeser RF:
Inhibitory effects of insulin-like growth factor-1 and osteogenic protein-
Chubinskaya et al. Arthritis Research & Therapy 2011, 13:R55
/>Page 13 of 14
1 on fibronectin fragment- and interleukin-1beta-stimulated matrix
metalloproteinase-13 expression in human chondrocytes. J Biol Chem
2003, 278:25386-25394.
18. Huch K, Wilbrink B, Flechtenmacher J, Koepp HE, Aydelotte MB,
Sampath TK, Kuettner KE, Mollenhauer JA, Thonar EJ-MA: Effects of
recombinant human osteogenic protein 1 on the production of
proteoglycan, prostaglandin E2, and interleukin-1 receptor antagonist by
human articular chondrocytes cultured in the presence of interleukin-1β.
Arthritis Rheum 1997, 40:2157-2161.
19. Koepp HE, Sampath KT, Kuettner KE, Homandberg GA: Osteogenic protein-
1 (OP-1) blocks cartilage damage caused by fibronectin fragments and
promotes repair by enhancing proteoglycan synthesis. Inflamm Res 1999,
48:199-204.
20. Nishida Y, Knudson CB, Knudson W: Osteogenic protein-1 inhibits matrix
depletion in a hyaluronan hexasaccharide-induced model of
osteoarthritis. Osteoarthritis Cart 2004, 12:374-382.
21. Chubinskaya S, Kawakami M, Rapoport L, Matsumoto T, Migita N,
Rueger DC: Anti-catabolic effect of OP-1 in chronically compressed
intervertebral discs. J Ortho Res 2007, 25:517-530.
22. Elshaier A, Hakimiyan AA, Rappoport L, Rueger DC, Chubinskaya S: Effect of
interleukin-1β on osteogenic protein-1-induced signaling in adult
human articular chondrocytes. Arthritis Rheum 2009, 60:143-154.
23. Merrihew C, Soeder S, Rueger DC, Kuettner KE, Chubinskaya S: Differential
response of endogenous osteogenic protein-1 to interleukin-1β. J Bone
Joint Surg Am 2003, 85-A:67-74.
24. Kawakami M, Matsumoto T, Hashizume H, Kuribayashi K, Chubinskaya S,
Yoshida M: Osteogenic protein-1 (OP-1/BMP-7) inhibits degeneration and
pain-related behavior induced by chronically compressed nucleus
pulposus in the rat. Spine 2005, 30:1933-1939.
25. Willson T, Rappoport L, Wimmer M, Hakimiyan A, Shekhawat V, Pacione C,
Borgia J, Hurtig M, Oegema T, Chubinskaya S: Cellular responses in acute
trauma of human ankle cartilage: cell survival, catabolic cytokines and
neuromediators. In Proceedings of the 7th World Congress of the
International Cartilage Repair Society. Volume 16. Warsaw, Poland;
2007:(2):148, abstract.
26. Chubinskaya S, Kawakami M, Matsumoto T, Tsutsui S, Rappoport L, Rueger DC:
Immunohistochemical evidences of the anabolic and anti-catabolic effects
of epidural OP-1 injection for herniated nucleus pulposus in the rat. Trans
54th ORS San Francisco, CA; 2008, #3.
27. Cowell S, Knäuper V, Stewart ML, D’Ortho MP, Stanton H, Hembry RM,
López-Otín C, Reynolds JJ, Murphy G: Induction of matrix
metalloproteinase activation cascades based on membrane-type 1
matrix metalloproteinase: associated activation of gelatinase A,
gelatinase B and collagenase 3. Biochem J 1998, 331 ( Pt 2):453-458.
28. Baker AH, Edwards DR, Murphy G: Metalloproteinase inhibitors: biological
actions and therapeutic opportunities. J Cell Sci 2002, 115:3719-3727.
29. Hu Y, Pham CT: Dipeptidyl peptidase I regulates the development of
collagen-induced arthritis. Arthritis Rheum 2005, 52:2553-2558.
30. Baici A, Lang A, Zwicky R, Müntener K: Cathepsin B in osteoarthritis:
uncontrolled proteolysis in the wrong place. Semin Arthritis Rheum 2005,
34:24-28.
31. Hurtig M, Chubinskaya S, Dickey J, Rueger D: BMP-7 protects against
progression of cartilage degeneration after impact injury. J Orthop Res
2009, 27:602-611.
32. Chubinskaya S, Elshaier A, Tyree E, Nicholson A, Soeder S, Loeser RF,
Hakimiyan A, Rueger DC: Identification of Id proteins in human articular
cartilage and the effect of growth factors on their expression. In Trans
51st ORS. Volume 30. Washington, DC; 2005:303.
33. Chubinskaya S, Hakimiyan A, Pacione C, Yanke A, Rappoport L, Aigner T,
Rueger D, Loeser RF: Synergistic effect of IGF-1 and OP-1 on matrix
formation by normal and OA chondrocytes cultured in alginate beads.
Osteoarthritis Cart 2007, 15:421-430.
34. Loeser RF, Pacione CA, Chubinskaya S: The combination of insulin-like
growth factor 1 and osteogenic protein 1 promotes increased survival
of and matrix synthesis by normal and osteoarthritic human
chondrocytes. Arthritis Rheum 2003, 48:2188-2196.
35. Nishida Y, Knudson CB, Eger W, Kuettner KE, Knudson WL: Osteogenic
protein 1 stimulates cells-associated matrix assembly by normal human
articular chondrocytes: up-regulation of hyaluronan synthase, CD44, and
aggrecan. Arthritis Rheum 2000, 43:206-214.
36. Vinall RL, Lo SH, Reddi AH: Regulation of articular chondrocyte phenotype
by bone morphogenetic protein 7, interleukin 1, and cellular context is
dependent on the cytoskeleton. Exp Cell Res 2002, 272:32-44.
37. Aigner T, McKenna L, Zien A, Fan Z, Gebhard PM, Zimmer R: Gene
expression profiling of serum- and interleukin-1β-stimulated primary
human adult articular chodnrocytes - A molecular analysis based on
chondrocytes isolated from one donor. Cytokine 2005, 31:227-240.
38. Aigner T, Zien A, Gehrsitz A, Gebhard PM, McKenna LA: Anabolic and
catabolic gene expression pattern analysis in normal versus
osteoarthritic cartilage using complementary DNA-array technology.
Arthritis Rheum 2001, 44:2777-2789.
39. Fan Z, Chubinskaya S, Rueger DC, Bau B, Haag J, Aigner T: Regulation of
anabolic and catabolic gene expression in normal and osteoarthritic
adult human articular chondrocytes by osteogenic protein-1. Clin Exp
Rheumatol 2004, 22:103-106.
40. Flechtenmacher J, Huch K, Thonar EJ, Mollenhauer JA, Davies SR,
Schmid TM, Puhl W, Sampath TK, Aydelotte MB, Kuettner KE: Recombinant
human osteogenic protein 1 is a potent stimulator of the synthesis of
cartilage proteoglycans and collagens by human articular chondrocytes.
Arthritis Rheum 1996, 39:1896-1904.
41. Bajaj S, Shoemaker T, Hakimiyan AA, Rappoport L, Pascual-Garrido C,
Oegema TR, Wimmer MA, Chubinskaya S: Protective effect of P188 in the
model of acute trauma to human ankle cartilage: the mechanism of
action. J Ortho Trauma 2010, 24:571-576.
42. Jennings L, Wu L, King KB, Hämmerle H, Cs-Szabo G, Mollenhauer J:
The
effects of collagen fragments on the extracellular matrix metabolism of
bovine and human chondrocytes. Connect Tissue Res 2001, 42:71-86.
43. Millward-Sadler SJ, Mackenzie A, Wright MO, Lee HS, Elliot K, Gerrard L,
Fiskerstrand CE, Salter DM, Quinn JP: Tachykinin expression in cartilage
and function in human articular chondrocyte mechanotransduction.
Arthritis Rheum 2003, 48:146-156.
44. Hunter DJ, Pike MC, Jonas BL, Kissin E, Krop J, McAlindon T: Phase I safety
and tolerability study of BMP-7 in symptomatic knee osteoarthritis. BMC
Musculoskeletal Disorders 2010, 11:232-239.
45. Tardif G, Pelletier J-P, Boileau C, Martel-Pelletier J: The BMP antagonists
follistatin and gremlin in normal and early osteoarthritic cartilage: an
immunohistochemical study. Osteoarthritis Cart 2009, 17:263-270.
46. Fukui N, Zhu Y, Malloney WJ, Clohisy J, Sandell LJ: Stimulation of BMP-2
expression by pro-inflammatory cytokines IL-1 and TNF-α in normal and
osteoarthritic chondrocytes. J Bone Joint Surg Am 2003, 85-A:59-66.
47. Qureshi HY, Ricci G, Zafarullah M: Smad signaling pathway is a pivotal
component of tissue inhibitor of metalloproteinases-3 regulation by
transforming growth factor beta in human chondrocytes. Biochim
Biophys Acta 2008, 1783:1605-1612.
48. Morris KJ, Cs-Szabo G, Cole AA: Characterization of TIMP-3 in human
articular talar cartilage. Connect Tissue Res 2010, 51(6):478-490.
49. Gendron C, Kashiwagi M, Hughes C, Caterson B, Nagase H: TIMP-3 inhibits
aggrecanase-mediated glycosaminoglycan release from cartilage
explants stimulated by catabolic factors. FEBS Lett 2003, 555 :431-436.
doi:10.1186/ar3300
Cite this article as: Chubinskaya et al.: Regulation of chondrocyte gene
expression by osteogenic protein-1. Arthritis Research & Therapy 2011 13:
R55.
Submit your next manuscript to BioMed Central
and take full advantage of:
• Convenient online submission
• Thorough peer review
• No space constraints or color figure charges
• Immediate publication on acceptance
• Inclusion in PubMed, CAS, Scopus and Google Scholar
• Research which is freely available for redistribution
Submit your manuscript at
www.biomedcentral.com/submit
Chubinskaya et al. Arthritis Research & Therapy 2011, 13:R55
/>Page 14 of 14