Beginning Google Maps Applications with PHP and Ajax From Novice to Professional PHẦN 5 pps
Bạn đang xem bản rút gọn của tài liệu. Xem và tải ngay bản đầy đủ của tài liệu tại đây (1.43 MB, 39 trang )
■Note It’s incorrect HTML to have a ul element that doesn’t contain any children. In our case, however, we
know that as soon as the map loads, there will be elements added to this list, so it’s another standards gray
area. If having it empty troubles you, you could put in a dummy
li node, and then start your JavaScript out
by removing this node. But, of course, there would still be a moment in time where the
ul is empty, which is
why doing anything more than what we’ve got here feels a little silly.
Obviously, the current iteration of map_data.php provides only latitude, longitude, and
a text label. The side panel will be much more useful if it can display supplementary informa-
tion, rather than just the same thing with different formatting. Let’s arbitrarily pick a handful
more fields from the fcc_towers view and add them to the output, as shown in Listing 6-13.
Listing 6-13. An Updated map_data.php Output Section
var markers = [
<?php while($row = mysql_fetch_assoc($result)): ?>
<?= $joiner ?>
{
'latitude': <?= $row['latitude'] ?>,
'longitude': <?= $row['longitude'] ?>,
'address': '<?= addslashes($row['struc_address']) ?>',
'city': '<?= addslashes($row['struc_city']) ?>',
'state': '<?= addslashes($row['struc_state']) ?>',
'height': '<?= addslashes($row['struc_height']) ?>',
'elevation': '<?= addslashes($row['struc_elevation']) ?>',
'type': '<?= addslashes($row['struc_type']) ?>',
'owner': '<?= addslashes($row['owner_name']) ?>'
}
<?
$joiner = ',';
$count++;
?>
<?php endwhile; ?>
];
Now we’re ready to step back in JavaScript.
Regarding how to actually add these items to the side panel list, there are a number of dif-
ferent schools of thought. The strictest camps would argue for using only XML DOM methods.
This would mean creating each tag—ahem, element—with createElement, putting text inside
it using createTextNode, and then adding it to the list with appendChild. To use this method is
to respect the sanctity of the HTML document tree as an abstract XML data structure in memory.
In contrast, using the innerHTML property lets us inject blobs of already marked-up content—
unvalidated content, which may or may not keep the document correct.
Our method, shown in Listing 6-14, is a hybrid approach. We create and attach the list
items using DOM methods, but each list item’s content is created as a text string and assigned
using innerHTML.
CHAPTER 6 ■ IMPROVING THE USER INTERFACE132
7079ch06FINAL.qxd 7/25/06 1:42 PM Page 132
Listing 6-14. The createMarker Function Reimagined As initializePoint
function initializePoint(pointData) {
var point = new GPoint(pointData.longitude, pointData.latitude);
var marker = new GMarker(point);
var listItem = document.createElement('li');
var listItemLink = listItem.appendChild(document.createElement('a'));
listItemLink.href = "#";
listItemLink.innerHTML = '<strong>' + pointData.address + ' </strong><span>' +➥
pointData.city + ', ' + pointData.state + ' (' + pointData.height + 'm)</span>';
var focusPoint = function() {
marker.openInfoWindowHtml(pointData.address);
map.panTo(point);
return false;
}
GEvent.addListener(marker, 'click', focusPoint);
listItemLink.onclick = focusPoint;
document.getElementById('sidebar-list').appendChild(listItem);
map.addOverlay(marker);
}
function init() {
for(id in markers) {
initializePoint(markers[id]);
}
handleResize();
}
Here, we greatly expanded the role of the function that used to just create a marker. Now,
it creates a marker and a sidebar list item, as well as a common event-handler function that
fires when either of them is clicked. We added some styles to it, and you can see the results in
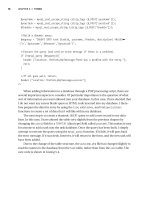
Figure 6-6.
■Note There might be a case here for isolating the generate-sidebar code from the generate-marker code,
but the lure of a common
focusPoint function is simply too great. Indeed, keeping the two tightly knit
offers us more opportunities for crossover functionality, as you’ll see shortly.
CHAPTER 6 ■ IMPROVING THE USER INTERFACE 133
7079ch06FINAL.qxd 7/25/06 1:42 PM Page 133
Figure 6-6. The side panel populated with marker details
Getting Side Panel Feedback
In the code as of Listing 6-14, the users can interact with both the side panel item and the marker
itself. However, they’re receiving feedback through only the map marker—its info window
pops up. It would be ideal if we could enhance this behavior by also highlighting the current
point in the side panel list.
Up until now, we’ve managed to avoid manipulating the classes of elements other than body.
Indeed, with a static navigation system, using body classes is a highly robust way to respond to
feedback. However, the side panel is full of dynamic content, generated within the browser; as
possible as it is, it would be absurd to be dynamically modifying the style rules to accommo-
date an unknown number of items.
The real key to this problem, though, is that the first click means “highlight me,” but every
subsequent click means “highlight me and unhighlight the previous selection.” Previously, the
API handled this transparently, by providing only a single info window. Now, you need to do it
yourself.
The method will be a global variable, called deselectCurrent, which always stores a func-
tion for unselecting the current selection. Whenever something new is selected, the handler
can simply run the current function, select itself, and then reassign the variable to a new func-
tion that will unselect itself. Perhaps it will make more sense in code, as shown in Listing 6-15.
CHAPTER 6 ■ IMPROVING THE USER INTERFACE134
7079ch06FINAL.qxd 7/25/06 1:42 PM Page 134
Listing 6-15. A Function to Deselect the Current List Item
var deselectCurrent = function() {}; // Empty function
function initializePoint(pointData) {
var point = new GPoint(pointData.longitude, pointData.latitude);
var marker = new GMarker(point);
var listItem = document.createElement('li');
var listItemLink = listItem.appendChild(document.createElement('a'));
listItemLink.href = "#";
listItemLink.innerHTML = '<strong>' + pointData.address + ' </strong><span>' +➥
pointData.city + ', ' + pointData.state + ' (' + pointData.height + 'm)</span>';
var focusPoint = function() {
deselectCurrent();
listItem.className = 'current';
deselectCurrent = function() { listItem.className = ''; }
marker.openInfoWindowHtml(pointData.address);
map.panTo(point);
return false;
}
GEvent.addListener(marker, 'click', focusPoint);
listItemLink.onclick = focusPoint;
document.getElementById('sidebar-list').appendChild(listItem);
map.addOverlay(marker);
}
And once again, with a few styles thrown in, you can see the results in Figure 6-7. Although
other sections have done so already, this code is one of the most explicit examples we’ve had
so far of using a closure. In the code in Listing 6-15, every time a new copy of focusPoint is cre-
ated (one per pin, right?), the JavaScript interpreter makes a copy of the environment in which
it was created. So even though the initializePoint() function has long finished by the time
focusPoint runs, each instance of focusPoint has access to the particular listItem object that
was in existence at the time.
CHAPTER 6 ■ IMPROVING THE USER INTERFACE 135
7079ch06FINAL.qxd 7/25/06 1:42 PM Page 135
Figure 6-7. The selected item in the side panel is highlighted.
This, of course, applies to the deselectCurrent() function as well. Although there’s only
one of them at any particular time, whatever one is in existence is maintaining access to the
listItem object that the focusPoint function that spawned it was carrying.
Doesn’t make sense? Don’t worry too much. Closures are just one of those computer science
topics that will become clearer after you encounter them a few times.
Warning, Now Loading
As you create map projects of increasing complexity, users will begin to experience a notice-
able lag while the browser gets everything set up. One courtesy that can be added is a message
to alert your users when the map is processing or initializing.
You’re going to use almost the exact same trick as was used for the hovering toolbar,
except this time, you’re hovering a temporary message rather than a persistent user control.
Modify the body of your markup file to add some structure for a loading message as shown in
Listing 6-16.
Listing 6-16. Markup to Add a Loading Message to the Map
<body class="sidebar-right loading">
<div id="toolbar">
CHAPTER 6 ■ IMPROVING THE USER INTERFACE136
7079ch06FINAL.qxd 7/25/06 1:42 PM Page 136
</div>
<div id="content">
<div id="map-wrapper">
<div id="map"></div>
</div>
<div id="sidebar">
</div>
<div id="alert">
<p>Loading data </p>
</div>
</div>
</body>
If you wanted, you could add a fancy spinning GIF animation, but this is adequate for
a start. You’ll need some similar additions to the CSS to pull this message in front of the map
and center it, as shown in Listing 6-17.
Listing 6-17. Styles to Position the Loading Message in Front of the Map
#alert {
position: absolute;
top: 50%;
left: 0;
width: 100%;
text-align: center;
display: none;
}
#alert p {
width: 150px;
margin: 0 auto 0 auto;
padding: 10px;
background: white;
border: 1px solid #aaa;
}
body.loading #alert { display: block; }
This uses the same strategy as we used in Listing 6-7 to show and hide the side panel. By
hooking the visibility of the alert on the body’s class, you can centralize control of it on that
one spot, and yet still be free later on to move it around and not need to change any JavaScript.
Moreover, you avoid the hassle of having to keep track of specific elements to hide and unhide,
as in Listing 6-15. Figure 6-8 shows the new loading notice.
CHAPTER 6 ■ IMPROVING THE USER INTERFACE 137
7079ch06FINAL.qxd 7/25/06 1:42 PM Page 137
Figure 6-8. A loading notice on the map
Here’s how to banish the loading message after the map is set up. Tack the line shown in
Listing 6-18 to the end of the init()function.
Listing 6-18. JavaScript to Hide the Loading Notice After Map Loading Is Completed
function init() {
changeBodyClass('loading', 'standby');
}
■Tip It may seem weird to replace “loading” with “standby,” rather than just deleting it outright. This way,
however, makes it more straightforward to revert back to loading status again at a later point. For example,
if the user interacts with the map in such a way that it needs to download another big block of data, it
becomes trivial to pop up that message again and let the user know you’re working on it.
CHAPTER 6 ■ IMPROVING THE USER INTERFACE138
7079ch06FINAL.qxd 7/25/06 1:42 PM Page 138
Data Point Filtering
Just one more area of the application still shows dummy content. With the data just begging to
be broken down by category, why not use that menu bar as a mechanism for selectively displaying
groups of points?
In this final example of the chapter, we’ll show you how to filter points into rudimentary
groups.
■Note Typically, when you want to display a bunch of things, and then display a bunch of different things,
you think of dashing back to the server to grab the next block of information. While this is important to be
able to do, we’re not actually making an Ajax call here.We’re just selectively limiting what is displayed. When
the entire data set for Hawaii is less than 40KB, what would be the point of breaking it up into multiple server
calls? When you grab it in one big lump, it makes for a more seamless user interface, since there’s no wait-
ing around for network latency on a 5KB file.
Flipping through the database view, it seems there are a handful of different structures
shown in the type field. Most of the Hawaii data seems to fall under either “Tower” or “Pole,”
but there are a few maverick types. Why bother hard-coding in the types of structures, when
the program could just figure them out at runtime?
Let’s go with pretty much the same starting markup for the toolbar list as we did for the
side panel list, as shown in Listing 6-19.
Listing 6-19. Markup for a Dynamic Filter Bar
<div id="toolbar">
<h1>Cell-Tower Locations</h1>
<ul id="filters">
</ul>
<ul id="sidebar-controls">
<li><a href="#" id="button-sidebar-hide">hide</a></li>
<li><a href="#" id="button-sidebar-show">show</a></li>
</ul>
</div>
From here, you have three main tasks:
• Use an efficient mechanism for showing and hiding particular points.
• Figure out which groups exist in the given data.
• Create a function that can cycle through and hide all points not belonging to a particular
group.
CHAPTER 6 ■ IMPROVING THE USER INTERFACE 139
7079ch06FINAL.qxd 7/25/06 1:42 PM Page 139
Showing and Hiding Points
The current implementation of initializePoint() (as of Listing 6-15) doesn’t provide any
obvious mechanism for toggling the points on and off—it’s a one-way operation. This isn’t
hard to fix, though. All you need to do is create a pair of functions for each point: one to show
and the other to hide. As for where to store these functions, what better place than inside the
original markers array itself? Listing 6-20 shows how we added the new functions.
Listing 6-20. Adding Methods to the markers Array Members
function initializePoint(pointData) {
var visible = false;
GEvent.addListener(marker, 'click', focusPoint);
listItemLink.onclick = focusPoint;
pointData.show = function() {
if (!visible) {
document.getElementById('sidebar-list').appendChild(listItem);
map.addOverlay(marker);
visible = true;
}
}
pointData.hide = function() {
if (visible) {
document.getElementById('sidebar-list').removeChild(listItem);
map.removeOverlay(marker);
visible = false;
}
}
pointData.show();
}
Isn’t that clever? Now along with latitude and longitude data members, each of those
markers array items has a pair of on-board functions for controlling their visibility.
Discovering Groupings
Figuring out all the unique values appearing in the type field is just a matter of iterating over
all the markers. Inside the init() function, we’ve added a single line to the existing loop that
runs over each record already, to call initializePoint() on it. This is shown in Listing 6-21.
CHAPTER 6 ■ IMPROVING THE USER INTERFACE140
7079ch06FINAL.qxd 7/25/06 1:42 PM Page 140
Listing 6-21. Augmented Initialization Function to Check for Different Structure Types
function init() {
var type;
var allTypes = { 'All':[] };
for(id in markers) {
initializePoint(markers[id]);
allTypes[markers[id].type] = true;
}
for(type in allTypes)
{
initializeSortTab(type);
}
handleResize();
changeBodyClass('loading', 'standby');
}
For each element of the markers array, initializePoint() is called, and then the point’s
type value is assigned as a key to the allTypes object. The nature of an object is that the keys
are unique, so by the end, allTypes has as its keys the different marker types. From there, you
can simply loop through that object and create a button and handler for each of the discov-
ered types.
Creating Filter Buttons
The last section, shown in Listing 6-22, is just implementing the initializeSortTab() function
called in Listing 6-21. Creating the button is identical to how you created sidebar links in
initializePoint(). The primary “gotcha” to pay attention to here is the special case for the All
button. And, of course, you’ll want to use the spiffy loading message.
Listing 6-22. Adding Filter Buttons to Show and Hide Groups of Markers
function initializeSortTab(type) {
var listItem = document.createElement('li');
var listItemLink = listItem.appendChild(document.createElement('a'));
listItemLink.href = "#";
listItemLink.innerHTML = type;
listItemLink.onclick = function() {
changeBodyClass('standby', 'loading');
CHAPTER 6 ■ IMPROVING THE USER INTERFACE 141
7079ch06FINAL.qxd 7/25/06 1:42 PM Page 141
for(id in markers) {
if (markers[id].type == type || 'All' == type) {
markers[id].show();
} else {
markers[id].hide();
}
}
changeBodyClass('loading', 'standby');
return false;
}
document.getElementById('filters').appendChild(listItem);
}
And there it is. It’s simple code, but there’s a lot of really classy functionality here. Given
almost any set of points, these techniques can be applied to create a useful, high-quality
presentation. The final result is shown in Figure 6-9.
Figure 6-9. Marker filters in action
CHAPTER 6 ■ IMPROVING THE USER INTERFACE142
7079ch06FINAL.qxd 7/25/06 1:42 PM Page 142
Summary
In this chapter, we took a look at a number of cross-browser layout tricks involving JavaScript
and CSS, as well as a handful of other methods to make your maps more visually and func-
tionally interesting. Together, we can stop the proliferation of boring, fixed-size, single-pane
mashups!
In Chapter 7, you’ll continue to develop this code, focusing on how to deal with the vastness
of the full US-wide database.
CHAPTER 6 ■ IMPROVING THE USER INTERFACE 143
7079ch06FINAL.qxd 7/25/06 1:42 PM Page 143
7079ch06FINAL.qxd 7/25/06 1:42 PM Page 144
Optimizing and Scaling for
Large Data Sets
So far in the book, we’ve looked at the basics of the Google Maps API and shown how it’s
possible to retrieve and store data for your map. You’ve probably come up with some great
ideas for your own map applications and started to assemble the information for your markers.
And you may have found that your data set is overwhelmingly large—far larger than the simple
examples you’ve been experimenting with so far.
In the previous chapters, you’ve been experimenting with the US FCC data in the
Antenna Structure Registration (ASR) database. As you’ve probably noticed, the FCC tower
information is a rather large data set, containing more than 115,000 points across the United
States. If you tried to map the towers using one GMarker per point, the map, or even the user’s
computer, would simply crawl to a halt.
When your data grows from a dozen to a few thousand points, or even hundreds of thou-
sands of points, you need to select the best way to present your information without confusing
or frustrating your users. This chapter presents a variety of methods for working with larger
data sets such as the FCC tower data. The methods you’ll learn will provide your users with an
interactive experience while maintaining a sensible overhead in your web application.
When dealing with large data sets, you need to focus on three areas of your application:
the communication between the server and browser, the server side, and the client side. In
this chapter, you’ll learn techniques for each of these areas as follows:
• Streamline the data flowing between your server and client’s web browser.
• Optimize your server-side script and data storage.
• Improve the users’ experience with the client-side JavaScript and web browser.
Understanding the Limitations
Before we discuss how to overcome any limitations that arise from dealing with large data
sets, you should probably familiarize yourself with what those limitations are. When we refer
to the “limits of the API,” we don’t mean to imply that Google is somehow disabling features of
the map and preventing you from doing something. What we’re referring to are the ambiguous
limits that apply to any web-based software, such as the software’s ability to run in the client’s
web browser.
145
CHAPTER 7
■ ■ ■
7079ch07FINAL.qxd 7/25/06 1:45 PM Page 145
CHAPTER 7 ■ OPTIMIZING AND SCALING FOR LARGE DATA SETS146
If you’re developing your map application on a cluster of supercomputers, the limitations of
your computer are going to be different than those of someone who is browsing on an old 486
laptop with just a few megabytes of RAM. You’ll never know for sure what type of computer
your users are going to have, so remember that not everyone is going to experience a map in the
same way. For this chapter, we’ll focus on the limitations related to plotting larger than normal
data sets on an average home computer. These issues are mainly performance-related and
occur when there are too many GOverlay objects on the map at one time.
Overlays are objects that build on the API’s GOverlay class and include any items added to
the map using the GMap2.addOverlay() method. In the Google Maps API, Google uses overlays for
GMarker objects, GPolyline objects, and info windows, all of which you’ve probably been play-
ing with a lot as you’ve progressed through this book. In each case, the overlay is built into the
JavaScript class, and in some cases, may include shadows or translucent images. Along with
the API overlays, the map may also contain custom overlays that you’ve built yourself. You can
implement your own overlays, using the API’s GOverlay object, to display all sorts of informa-
tion. In fact, one of the methods you’ll explore in this chapter uses a custom overlay to display
detailed information using a transparent GIF.
Here is a summary of the relevant limits:
GMarker limits: If you’re going to display only markers on your map, the maximum number
to try for the average user is around 100; however, performance will be slow on anything
but the latest computer hardware. Loading markers and moving them around with
JavaScript is an expensive operation, so for better performance and reliability, try to keep
the number to around 50 to 75 GMarker objects on the map at one time—even fewer if
you’re combining them with GPolyline objects.
GPolyline limits: Too many GPolyline objects will slow the map in the same way as do too
many markers. The difference with polylines is in the number of points in the lines, not
the number of lines. One really long line with a bunch of points will slow the map down
just as much as a few little lines. Load a maximum of 100 to 150 points, but keep in mind
that using around 50 to 75 will make your application run a lot smoother. If your applica-
tion requires a large, complicated set of polygons with hundreds of points, check out the
server-side overlay and tile solutions described in this chapter. The examples demonstrate
generating your own overlays and tiles, but the embedded images don’t need to be limited
to just markers—you could draw complicated images, lines, and shapes as well.
Info window limits: As you saw in Chapter 3, there’s only one instance of an info window
on the map at any given time, so there are no direct limits on the info window with regard to per-
formance. However, remember that the info window adds more complexity to the map,
so if you try to slide the map around while the window is open, the map may begin to
slow down.
Streamlining Server-Client Communications
Throughout the book, we’ve mentioned that providing an interactive experience to your users
is a key characteristic of your mapping application’s success. Adding interactivity often means
creating more requests back and forth between the client’s web browser and the server. More
requests means more traffic and accordingly, a slower response, unless you invest in addi-
tional resources such as hardware to handle the load. To avoid making these investments yet
7079ch07FINAL.qxd 7/25/06 1:45 PM Page 146
still improve response time, you should always streamline any process or data that you’ll be
using to communicate with the client.
As you’ve probably figured out by now, Ajax doesn’t really need to talk in XML. You can
send and receive any information you want, including both HTML and JavaScript code. Ini-
tially, many web developers make the mistake of bloating their server responses with full,
and often verbose, JavaScript. Bloating the response with JavaScript is easy on you as a devel-
oper, but becomes a burden on both the server and the client. For example, the response from
the server could add ten markers to your map by sending:
map.addOverlay(new GMarker(new GLatLng(39.49,-75.07)));
map.addOverlay(new GMarker(new GLatLng(39.49,-76.24)));
map.addOverlay(new GMarker(new GLatLng(39.64,-74.29)));
map.addOverlay(new GMarker(new GLatLng(40.76,-73.00)));
map.addOverlay(new GMarker(new GLatLng(40.83,-74.47)));
map.addOverlay(new GMarker(new GLatLng(40.83,-74.05)));
map.addOverlay(new GMarker(new GLatLng(40.83,-72.60)));
map.addOverlay(new GMarker(new GLatLng(40.83,-76.64)));
map.addOverlay(new GMarker(new GLatLng(41.17,-71.56)));
map.addOverlay(new GMarker(new GLatLng(41.26,-70.06)));
The problem with sending all this code in your response becomes apparent as your data set
scales to larger and larger requests. The only unique information for each point is the latitude
and longitude, so that’s all you really need to send. The response would be better trimmed and
rewritten using the JSON objects introduced in Chapter 2, such as the following:
var points = {
{lat:39.49,lng:-75.07},
{lat:39.49,lng:-76.24},
{lat:39.64,lng:-74.29},
{lat:40.76,lng:-73.00},
{lat:40.83,lng:-74.47},
{lat:40.83,lng:-74.05},
{lat:40.83,lng:-72.60},
{lat:40.83,lng:-76.64},
{lat:41.17,lng:-71.56},
{lat:41.26,lng:-70.06},
}
By sending only what’s necessary, you decrease every line from about 55 characters to just 23,
an overall reduction of 32 characters per line and a savings of about 9KB for a single request
with 300 locations! Trimming your response and generating the markers from the data in the
response will also give your client-side JavaScript much more control over what to do with
the response. If you’re sending a larger data set of 1000 points, you can easily see how you
could save megabytes in bandwidth and download time, plus, considering the number of
requests your application could receive, that will add up to a big savings over time.
Reducing data bloat is a fairly easy concept and requires little, if any, extra work. Though
you may shrug it off as obvious, remember to think about it the next time you build your web
application. Less bloat will make your application run faster! Plus, it will also make your code
much easier to maintain, as JavaScript operations will be contained in one place rather than
spread around in the server response.
CHAPTER 7 ■ OPTIMIZING AND SCALING FOR LARGE DATA SETS 147
7079ch07FINAL.qxd 7/25/06 1:45 PM Page 147
Optimizing Server-Side Processing
When building a map with a large and complex set of data, you’ll most likely be interacting
with the server to retrieve only a small subset of the available information. The trick, as you will
soon see, is in how you request the information combined with how it’s processed and displayed.
You could retrieve everything from the server and then display everything in your client’s
web browser but, as we mentioned earlier in the chapter, the client will slow to a crawl, and in
many cases, just quit. To avoid slowing the map and annoying your users, it’s important to
optimize the method of your requests.
How you store your information on your server is up to you, but whichever way you choose,
you’ll need to ensure the data is easily accessible and searchable. Processing a large flat file for
each request will just slow down the server and waste valuable resources, while at the same
time searching multiple XML files can get a bit tricky. For optimum speed and efficiency, you’ll
probably want to use a database to store your information. We’ve already discussed databases
and how to create them throughout the book, so in this chapter we’ll just focus on targeting
the information you need from your database for each request.
To easily search, filter, and categorize the information displayed on the map, make sure
your database has the appropriate data types for each of the fields in your database table. For
example, if you have a lat and a lng column, make sure they’re floats with the appropriate
precision for your data. Using the proper data types will allow the database to better optimize
the storage and retrieval of your information, making it a lot quicker to process each request.
Additionally, if your database supports it, be sure to use indexing on frequently requested
columns or other database-specific optimizations on your data.
Once your database is flush with information, your requests and queries will most likely
be retrieving information about points within a particular latitude and longitude boundary.
You’ll also need to consider how much information you want to display versus how much
information it is actually possible to display. After you’ve decided on an appropriate balance of
wants versus needs, you’ll need to pick the solution that best fits your data. Here, we’ll explore
five possible solutions:
• Server-side boundary method
• Server-side common point method
• Server-side clustering
• Custom detail overlay method
• Custom tile method
These approaches have varying degrees of effectiveness, depending on your database of
information and the context of the map. We’ll describe each method and then point out its
advantages and disadvantages.
CHAPTER 7 ■ OPTIMIZING AND SCALING FOR LARGE DATA SETS148
7079ch07FINAL.qxd 7/25/06 1:45 PM Page 148
Server-Side Boundary Method
The boundary method involves requesting only the points within a specific boundary, defined
using some relevant reference such as the viewport of the visible map. The success of the boundary
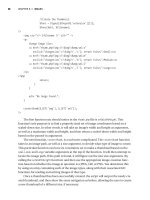
method relies on highly dispersed data at a given zoom level.
If you have a large data set and the information is relatively dispersed over the globe, you
can use the GLatLngBounds of the GMap2 object as a boundary for your query. This essentially
restricts the data in your response to those points that are within the on-screen viewable
area of the map. For globally dispersed data at zoom level 1, where the map covers the entire
globe, you’ll see the whole world at once, so plotting the data set using markers is still is going
to go beyond the suggested 100 marker limit and cause problems, as shown in Figure 7-1. At
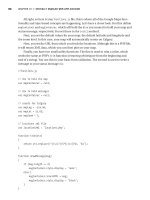
closer zoom levels, say 5 or higher, you’ll have a smaller portion of the markers on the map at
one time, and this method will work great, as shown in Figure 7-2. The same would apply for
localized data dispersed across a smaller area or large, less dispersed data, but you’ll need to
zoom in much closer to have success.
Figure 7-1. Server-side boundary method with the entire world at zoom level 1
CHAPTER 7 ■ OPTIMIZING AND SCALING FOR LARGE DATA SETS 149
7079ch07FINAL.qxd 7/25/06 1:45 PM Page 149
Figure 7-2. Server-side boundary method at a closer zoom level
To experiment with a smaller, globally dispersed data set, suppose you want to create
a map of capital cities around the world. There are 192 countries, so that would mean 192
markers to display. Capital cities are an appropriate data set for the boundary method because
there are relatively few points and they are dispersed throughout the globe. If you adjust the
zoom of the map to something around 5, you’ll have only a small portion of those points on
the map at the same time.
■Tip The boundary method is usually used in combination with one of the other solutions. You’ll notice that
in many of the server-based methods, the first SQL query still uses the boundary method to initially limit the
data set to a particular area, and then additional optimizations are performed.
Listings 7-1 and 7-2 contain a working example of the server-side boundary method
( using the SQL database of capital city
locations you created in Chapter 5 (in the screen scraping example). If you haven’t created the
database from Chapter 5, you can quickly do so using the Chapter 7 capital_cities_seed.sql file
in the supplemental code for the book.
Listing 7-1. Client-Side JavaScript for the Server-Side Boundary Method
var map;
var centerLatitude = 49.224773;
var centerLongitude = -122.991943;
var startZoom = 4;
CHAPTER 7 ■ OPTIMIZING AND SCALING FOR LARGE DATA SETS150
7079ch07FINAL.qxd 7/25/06 1:45 PM Page 150
function init() {
map = new GMap2(document.getElementById("map"));
map.addControl(new GSmallMapControl());
map.setCenter(new GLatLng(centerLatitude, centerLongitude), startZoom);
updateMarkers();
GEvent.addListener(map,'zoomend',function() {
updateMarkers();
});
GEvent.addListener(map,'moveend',function() {
updateMarkers();
});
}
function updateMarkers() {
//remove the existing points
map.clearOverlays();
//create the boundary for the data
var bounds = map.getBounds();
var southWest = bounds.getSouthWest();
var northEast = bounds.getNorthEast();
var getVars = 'ne=' + northEast.toUrlValue()
+ '&sw=' + southWest.toUrlValue()
//log the URL for testing
GLog.writeUrl('server.php?'+getVars);
//retrieve the points using Ajax
var request = GXmlHttp.create();
request.open('GET', 'server.php?'+getVars, true);
request.onreadystatechange = function() {
if (request.readyState == 4) {
var jscript = request.responseText;
var points;
eval(jscript);
//create each point from the list
for (i in points) {
var point = new GLatLng(points[i].lat,points[i].lng);
var marker = createMarker(point,points[i].city);
map.addOverlay(marker);
}
}
}
CHAPTER 7 ■ OPTIMIZING AND SCALING FOR LARGE DATA SETS 151
7079ch07FINAL.qxd 7/25/06 1:45 PM Page 151
request.send(null);
}
function createMarker(point, html) {
var marker = new GMarker(point);
GEvent.addListener(marker, 'click', function() {
var markerHTML = html;
marker.openInfoWindowHtml(markerHTML);
});
return marker;
}
window.onload = init;
Listing 7-2. PHP Server-Side Script for the Server-Side Boundary Method
<?php
//retrieve the variables from the GET vars
list($nelat,$nelng) = explode(',',$_GET['ne']);
list($swlat,$swlng) = explode(',',$_GET['sw']);
//clean the data
$nelng=(float)$nelng;
$swlng=(float)$swlng;
$nelat=(float)$nelat;
$swlat=(float)$swlat;
//connect to the database
require($_SERVER['DOCUMENT_ROOT'] . '/db_credentials.php');
$conn = mysql_connect("localhost", $db_name, $db_pass);
mysql_select_db("googlemapsbook", $conn);
if($nelng > $swlng) {
//retrieve all points in the southwest/northeast boundary
$result = mysql_query(
"SELECT
lat,lng,capital,country
FROM
capital_cities
WHERE
(lng > $swlng AND lng < $nelng)
AND (lat <= $nelat AND lat >= $swlat)
ORDER BY
lat"
, $conn);
CHAPTER 7 ■ OPTIMIZING AND SCALING FOR LARGE DATA SETS152
7079ch07FINAL.qxd 7/25/06 1:45 PM Page 152
} else {
//retrieve all points in the southwest/northeast boundary
//split over the meridian
$result = mysql_query(
"SELECT
lat,lng,capital,country
FROM
capital_cities
WHERE
(lng >= $swlng OR lng <= $nelng)
AND (lat <= $nelat AND lat >= $swlat)
ORDER BY
lat"
, $conn);
}
$list = array();
$i=0;
$row = mysql_fetch_assoc($result);
while($row)
{
$i++;
extract($row);
$city = addcslashes($capital.', '.$country,"'");
$list[] = "p{$i}:{lat:{$lat},lng:{$lng},city:'{$city}'}";
$row = mysql_fetch_assoc($result);
}
//echo back the JavaScript object nicely formatted
header('content-type:text/plain;');
echo "var points = {\n\t".join(",\n\t",$list)."\n}";
?>
This method has two key parts. The first is the request to the server in Listing 7-1, which
includes the bounds of the map by sending the southwest and northeast corners:
//create the boundary for the data
var bounds = map.getBounds();
var southWest = bounds.getSouthWest();
var northEast = bounds.getNorthEast();
var getVars = 'ne=' + northEast.toUrlValue()
+ '&sw=' + southWest.toUrlValue()
The second is the SQL query to the database in Listing 7-2, which limits the points to the
boundary defined by the southwest and northeast corners:
CHAPTER 7 ■ OPTIMIZING AND SCALING FOR LARGE DATA SETS 153
7079ch07FINAL.qxd 7/25/06 1:45 PM Page 153
if($nelng > $swlng) {
//retrieve all points in the southwest/northeast boundary
$result = mysql_query(
"SELECT
lat,lng,capital,country
FROM
capital_cities
WHERE
(lng > $swlng AND lng < $nelng)
AND (lat <= $nelat AND lat >= $swlat)
ORDER BY
lat"
, $conn);
} else {
//retrieve all points in the southwest/northeast boundary
//split over the meridian
$result = mysql_query(
"SELECT
lat,lng,capital,country
FROM
capital_cities
WHERE
(lng >= $swlng OR lng <= $nelng)
AND (lat <= $nelat AND lat >= $swlat)
ORDER BY
lat"
, $conn);
}
■Caution You may have noticed the SQL is wrapped in an if statement and two different queries are per-
formed depending on the relationship of the longitudes. This is due to the meridian in the Mercator projection
of the map. The map is displayed using a Mercator projection where the meridian of the earth is at the left
and right edges. When you slide to the left or right, the map will wrap as you move past the meridian at
+/– 180 degrees. In that case, the bounds are partially split across the left and right edges of the map and
the northeast corner is actually positioned at a point that is greater than 180 degrees. The Google Maps API
(and probably your data) automatically adjusts the longitude values to fit between –180 and + 180 degrees,
so you need to request two portions of the map from your database covering the left and right sides.
When you move the map around or change the zoom level, a new request is created by
the moveend and zoomend events in Listing 7-1. The request to the server retrieves a new JSON
object, which is then processed by the JavaScript to create the necessary markers.
CHAPTER 7 ■ OPTIMIZING AND SCALING FOR LARGE DATA SETS154
7079ch07FINAL.qxd 7/25/06 1:45 PM Page 154
As you would expect, there are both pros and cons to using the boundary method. The
advantages are as follows:
• This technique uses the standard existing Google Maps API methods to create the
markers on the map.
• It doesn’t drastically change your code from the simple examples presented earlier in the
book.
• The PHP requires little server-side processing and little overhead.
The following are the boundary method’s disadvantages:
• It works for only dispersed data or higher zoom levels.
• It may not work for lower zoom levels, as too many markers will be shown at once.
• The client’s web browser makes a new request for markers after each map movement,
which could increase server traffic.
Server-Side Common Point Method
Unlike the server-side boundary method, the server-side common point method relies on
a known point, one around which you can centralize your data, and retrieves the maximum
number of points relative to that known point. This method is useful for location-based appli-
cations where you are asking your users to search for things relative to other things, or possibly
even relative to themselves. It works for any zoom level and any data set, whether it’s a few
hundred points or thousands of points, but larger data sets may require more time to process
the relative distance to each point.
For example, suppose you want to create a map of all the FCC towers relative to someone’s
position so he can determine which towers are within range of his location. Simply browsing
the map using the server-side boundary method won’t be useful because the data is fairly dense
and you would need to maintain a very close zoom. What you really want is to find towers rel-
ative to the person’s street address or geographic location. You could have him enter an address
on your map, and then you could create the central point by geocoding the address using the
methods you learned in Chapter 4.
The difficulty with the common point method is calculating the distance between the
central point and all the other points. The calculation itself is fairly simple and can be done
using kilometers, miles, or nautical miles, as shown in the PHP surfaceDistance() function in
Listing 7-3.
Listing 7-3. Surface Distance Calculation Function in PHP
<?php
function surfaceDistance($lat1,$lng1,$lat2,$lng2,$type='km'){
$a1 = deg2rad($lat1); //lat 1 in radians
$a2 = deg2rad($lat2); //lat 2 in radians
$b1 = deg2rad($lng1); //lng 1 in radians
$b2 = deg2rad($lng2); //lng 2 in radians
CHAPTER 7 ■ OPTIMIZING AND SCALING FOR LARGE DATA SETS 155
7079ch07FINAL.qxd 7/25/06 1:45 PM Page 155
//earth radius = 6378.8 kilometers or 3963 miles
switch(strtolower($type)) {
case 'km': $r = 6378.8; break; //kilometers
case 'm': $r = 3963; break; //miles
case 'n': $r = 3443.9; break; //nautical
}
return acos(cos($a1)*cos($b1)*cos($a2)*cos($b2) +
cos($a1)*sin($b1)*cos($a2)*sin($b2) +
sin($a1)*sin($a2)) * $r;
}
?>
The problem arises when you need to calculate the distance to every point in your data-
base. Looping through each point is fine for a relatively small database, but when you are dealing
with hundreds of thousands of points, you should first reduce your data set using other meth-
ods. For example, you could limit the search to a certain range from the central point and
construct a latitude/longitude boundary, as you did with the server-side boundary method
in Listing 7-2. This would limit the surface distance calculation to each point in the bound-
ary rather than the entire database. You could also look up the city or state when you geocode
the address and filter your SQL query to points only in that city or state. Either way, it’s best
to provide some level of additional search criteria so you don’t waste resources by calculat-
ing distances to points on the other side of the world.
If you choose to use this method, also be aware that user interface problems may arise if
you don’t design your interface correctly. The problem may not be obvious at first, but what hap-
pens when you slide the map away from the common central point? Using strictly this method
means no additional markers are shown outside those closest to the common point. Your users
could be dragging the map around looking for the other markers that they know are there, but
aren’t shown due to the restrictions of the central point location, as shown in Figure 7-3.
Figure 7-3. A map missing the available data outside the viewable area
CHAPTER 7 ■ OPTIMIZING AND SCALING FOR LARGE DATA SETS156
7079ch07FINAL.qxd 7/25/06 1:45 PM Page 156