Beginning Google Maps Applications with PHP and Ajax From Novice to Professional PHẦN 6 ppt
Bạn đang xem bản rút gọn của tài liệu. Xem và tải ngay bản đầy đủ của tài liệu tại đây (2.72 MB, 39 trang )
this.backgroundColor_, this.opacity_);
}
Detail.prototype.redraw = function(force) {
if (!force) return;
this.bounds_ = this.map_.getBounds();
var c1 = this.map_.fromLatLngToDivPixel(this.bounds_.getSouthWest());
var c2 = this.map_.fromLatLngToDivPixel(this.bounds_.getNorthEast());
this.div_.style.width = Math.abs(c2.x - c1.x) + "px";
this.div_.style.height = Math.abs(c2.y - c1.y) + "px";
this.div_.style.left = (Math.min(c2.x, c1.x) - this.weight_) + "px";
this.div_.style.top = (Math.min(c2.y, c1.y) - this.weight_) + "px";
//the position or zoom has changed so reload the background image
this.loadBackground();
}
Detail.prototype.loadBackground = function() {
//retrieve the bounds of the detail area
var southWest = this.bounds_.getSouthWest();
var northEast = this.bounds_.getNorthEast();
//determine the pixel position of the corners
var swPixels = this.map_.fromLatLngToDivPixel(this.bounds_.getSouthWest());
var nePixels = this.map_.fromLatLngToDivPixel(this.bounds_.getNorthEast());
//send the lat/lng as well as x/y and zoom to the server
var getVars = 'ne=' + northEast.toUrlValue()
+ '&sw=' + southWest.toUrlValue()
+ '&nePixels=' + nePixels.x + ',' + nePixels.y
+ '&swPixels=' + swPixels.x + ',' + swPixels.y
+ '&z=' + this.map_.getZoom()
+ '';
//log the URL for testing
GLog.writeUrl('server.php?'+getVars);
//set the background image of the div
this.div_.style.background='transparent url(server.php?'+getVars+')';
}
function init() {
map = new GMap2(document.getElementById("map"));
CHAPTER 7 ■ OPTIMIZING AND SCALING FOR LARGE DATA SETS 171
7079ch07FINAL.qxd 7/25/06 1:45 PM Page 171
map.addControl(new GSmallMapControl());
map.setCenter(new GLatLng(centerLatitude, centerLongitude), startZoom);
var bounds = map.getBounds();
map.addOverlay(new Detail(bounds));
}
window.onload = init;
■Tip For examples of the mathematical formulas for different maps such as the Mercator projection
maps, visit MathWorld at />Looking at Listing 7-9, you can see the Rectangle object renamed to Detail and the addi-
tion of a loadBackground method, which modifies the background style property of the Detail
object:
Detail.prototype.loadBackground = function() {
//retrieve the bounds of the detail area
var southWest = this.bounds_.getSouthWest();
var northEast = this.bounds_.getNorthEast();
//determine the pixel position of the corners
var swPixels = this.map_.fromLatLngToDivPixel(this.bounds_.getSouthWest());
var nePixels = this.map_.fromLatLngToDivPixel(this.bounds_.getNorthEast());
var getVars = 'ne=' + northEast.toUrlValue()
+ '&sw=' + southWest.toUrlValue()
+ '&nePixels=' + nePixels.x + ',' + nePixels.y
+ '&swPixels=' + swPixels.x + ',' + swPixels.y
+ '&z=' + this.map_.getZoom()
+ '';
this.div_.style.background='transparent url(server.php?'+getVars+')';
}
When loading your background image, you’ll need to include several variables for your
server-side script, including the northeast and southwest corners in latitude and longi-
tude, as well as the northeast and southwest corners in pixel values. You also need to pass
the current zoom level for the map. This will allow you to perform the necessary calculations
on the server side and also allow you to modify your image, depending on how far your users
have zoomed in on the map. You can then use the server-side script in Listing 7-10 to create
the appropriately sized image with the appropriate information for the boundary. For the
example in Listing 7-10 ( we’ve
CHAPTER 7 ■ OPTIMIZING AND SCALING FOR LARGE DATA SETS172
7079ch07FINAL.qxd 7/25/06 1:45 PM Page 172
chosen to create a GIF with a small circle marking each tower location within the northeast and
southwest boundary.
Listing 7-10. Server-Side PHP for the Custom Overlay Method
<?php
//retrieve the variables from the GET vars
list($nelat,$nelng) = explode(',',$_GET['ne']);
list($swlat,$swlng) = explode(',',$_GET['sw']);
list($neX,$neY) = explode(',',$_GET['nePixels']);
list($swX,$swY) = explode(',',$_GET['swPixels']);
//clean the data
$nelng = (float)$nelng;
$swlng = (float)$swlng;
$nelat = (float)$nelat;
$swlat = (float)$swlat;
$w = (int)abs($neX - $swX);
$h = (int)abs($neY - $swY);
$z = (int)$_GET['z'];
//connect to the database
require($_SERVER['DOCUMENT_ROOT'] . '/db_credentials.php');
$conn = mysql_connect("localhost", $db_name, $db_pass);
mysql_select_db("googlemapsbook", $conn);
/*
* Retrieve the points within the boundary of the map.
* For the FCC data, all the points are within the US so we
* don't need to worry about the meridian.
*/
$result = mysql_query(
"SELECT
longitude as lng,latitude as lat,struc_height,struc_elevation
FROM
fcc_towers
WHERE
(longitude > $swlng AND longitude < $nelng)
AND (latitude <= $nelat AND latitude >= $swlat)
ORDER BY
lat");
$count = mysql_num_rows($result);
//calculate the Mercator coordinate position of the top
//latitude and normalize from 0-1
$mercTop = 0.5-(asinh(tan(deg2rad($nelat))) / M_PI / 2);
CHAPTER 7 ■ OPTIMIZING AND SCALING FOR LARGE DATA SETS 173
7079ch07FINAL.qxd 7/25/06 1:45 PM Page 173
//calculate the scale and y position on the Google Map
$scale = (1 << ($z)) * 256;
$yTop = $mercTop * $scale;
//calculate the pixels per degree of longitude
$lngSpan = $nelng-$swlng;
$pixelsPerDegLng = abs($w/$lngSpan);
//create the image
$im = imagecreate($w,$h);
$trans = imagecolorallocate($im,0,0,255);
$black = imagecolorallocate($im,0,0,0);
$white = imagecolorallocate($im,255,255,255);
imagefill($im,0,0,$trans);
imagecolortransparent($im, $trans);
//label the number of points for testing
imagestring($im,1,0,0,$count.' points in this area:',$black);
$row = mysql_fetch_assoc($result);
while($row)
{
extract($row);
$lng = $row['lng'];
$lat = $row['lat'];
$x = ceil(abs($lng-$swlng)*$pixelsPerDegLng);
//calculate the mercator cordinate position of this point
//latitude and normalize from 0-1
$yMerc = 0.5-(asinh(tan(deg2rad($lat))) / M_PI / 2);
//calculate the y position on the Google Map
$yMap = $yMerc * $scale;
//calculate the y position in the overlay
$y = $yMap-$yTop;
//draw the marker, a dot in this case
imagefilledellipse($im, $x, $y, $z+1, $z+1, $black );
imageellipse($im, $x, $y, $z+1, $z+1, $white );
$row = mysql_fetch_assoc($result);
}
//echo a GIF
header('content-type:image/gif;');
imagegif($im);
?>
CHAPTER 7 ■ OPTIMIZING AND SCALING FOR LARGE DATA SETS174
7079ch07FINAL.qxd 7/25/06 1:45 PM Page 174
Looking at Listing 7-9 again, you’ll notice that your background image for the overlay is
based on the viewable area of the map. You can imagine, when you zoom in very close, the
image covering all of Hawaii would be exponentially larger at each zoom increment.
Limiting the image to cover only the viewable area decreases the number of points that
need to be drawn and decreases the size of the image.
■Tip Another advantage of the custom overlay method as well as the custom tile method, described next,
is the ability to circumvent the same origin security policy built into most browsers. The policy doesn’t apply
to images, so your map can be hosted on one domain and you can request your background images or tiles
from a different domain without any problems.
Once the overlay is loaded onto the map, you should have the towers for Hawaii marked some-
thing like Figure 7-6. Again, you could use any image for the markers simply by copying it onto
the image in PHP using the appropriate PHP GD functions.
Figure 7-6. A map showing the custom detail overlay for FCC towers in Hawaii
The pros of using the custom overlay method are as follows:
• It overcomes API limitations on the number of markers and polylines.
• You can use the same method to display objects, shapes, photos, and more.
• It works for any sized data set and at any zoom level.
CHAPTER 7 ■ OPTIMIZING AND SCALING FOR LARGE DATA SETS 175
7079ch07FINAL.qxd 7/25/06 1:45 PM Page 175
The following are its disadvantages:
• It creates a new image after each map movement or zoom change.
• Extremely large data sets could be slow to render.
Custom Tile Method
The custom tile method is the most elegant solution to display the maximum amount of infor-
mation on the map with the least overhead. You could use custom tiles to display a single
point or millions of points.
To add your own custom tiles to the map, version 2 of the Google Maps API exposes the
GTile and GProjection objects. This means you can now use the API to show your own tiles on
the map. What’s even better is that you can also layer transparent or translucent tiles on top of
each other to create a multilayered map. By layering tiles on top of one another, you have no limit
to what information you can display. For example, you could create tiles with your own driving
directions, outline buildings and environmental features, or even display your information
using an old antique map rather than Google’s default or satellite map types.
To demonstrate this method, let’s create a map of all the available FCC towers in the
United States. That’s an excessively large amount of dense data (about 115,000 points as men-
tioned earlier), and it covers a fairly large area of the earth. You could use the custom overlay
method discussed in the previous section, but the map would be very sluggish as it continually
redrew the image when looking at anything larger than a single city in a dense area. Your
best option would be to create transparent tiles containing all your information, and match
them to Google’s tiles so you can overlay them on top of each of the different map types. By
slicing your data into smaller tiles, each image is relatively small (256 by 256 pixels) and both
the client web browser and the server can cache them to reduce redundant processing.
Figure 7-7 shows each of the tiles outlined on the sample Google map.
Figure 7-7. Tiles outlined on a Google map
CHAPTER 7 ■ OPTIMIZING AND SCALING FOR LARGE DATA SETS176
7079ch07FINAL.qxd 7/25/06 1:45 PM Page 176
To layer your data using the same tile structure as the Google Maps API, you’ll need to cre-
ate each of your tiles to match the existing Google tiles. Along with the sample code for the
book, we’ve included a PHP GoogleMapsUtility class in Listing 7-11, which has a variety of
useful methods to help you create your tiles. The tile script for the custom tile method (shown
later in Listing 7-13) uses the methods of the GoogleMapsUtility class to calculate the various
locations of each point on the tile. The calculations in the utility class are based on the
Mercator projection, which we’ll discuss further in Chapter 9, when we talk about types of
map projections.
Listing 7-11. The GoogleMapUtility Class Methods for Tile Construction
<?php
class GoogleMapUtility {
//The Google Maps all use tiles 256x256
const TILE_SIZE = 256;
/**
* Convert from a pixel location to a geographical location.
**/
public static function fromXYToLatLng($point,$zoom) {
$mapWidth = (1 << ($zoom)) * GoogleMapUtility::TILE_SIZE;
return new Point(
(int)($normalised->x * $mapWidth),
(int)($normalised->y * $mapWidth)
);
}
/**
* Calculate the pixel offset within a specific tile
* for the given latitude and longitude.
**/
public static function getPixelOffsetInTile($lat,$lng,$zoom) {
$pixelCoords = GoogleMapUtility::toZoomedPixelCoords(
$lat, $lng, $zoom
);
return new Point(
$pixelCoords->x % GoogleMapUtility::TILE_SIZE,
$pixelCoords->y % GoogleMapUtility::TILE_SIZE
);
}
/**
* Determine the geographical bounding box for the specified tile index
* and zoom level.
**/
public static function getTileRect($x,$y,$zoom) {
$tilesAtThisZoom = 1 << $zoom;
CHAPTER 7 ■ OPTIMIZING AND SCALING FOR LARGE DATA SETS 177
7079ch07FINAL.qxd 7/25/06 1:45 PM Page 177
$lngWidth = 360.0 / $tilesAtThisZoom;
$lng = -180 + ($x * $lngWidth);
$latHeightMerc = 1.0 / $tilesAtThisZoom;
$topLatMerc = $y * $latHeightMerc;
$bottomLatMerc = $topLatMerc + $latHeightMerc;
$bottomLat = (180 / M_PI) * ((2 * atan(exp(M_PI *
(1 - (2 * $bottomLatMerc))))) - (M_PI / 2));
$topLat = (180 / M_PI) * ((2 * atan(exp(M_PI *
(1 - (2 * $topLatMerc))))) - (M_PI / 2));
$latHeight = $topLat - $bottomLat;
return new Boundary($lng, $bottomLat, $lngWidth, $latHeight);
}
/**
* Convert from latitude and longitude to Mercator coordinates.
**/
public static function toMercatorCoords($lat, $lng) {
if ($lng > 180) {
$lng -= 360;
}
$lng /= 360;
$lat = asinh(tan(deg2rad($lat)))/M_PI/2;
return new Point($lng, $lat);
}
/**
* Normalize the Mercator coordinates.
**/
public static function toNormalisedMercatorCoords($point) {
$point->x += 0.5;
$point->y = abs($point->y-0.5);
return $point;
}
/**
* Calculate the pixel location of a latitude and longitude point
* on the overall map at a specified zoom level.
**/
public static function toZoomedPixelCoords($lat, $lng, $zoom) {
$normalised = GoogleMapUtility::toNormalisedMercatorCoords(
GoogleMapUtility::toMercatorCoords($lat, $lng)
);
CHAPTER 7 ■ OPTIMIZING AND SCALING FOR LARGE DATA SETS178
7079ch07FINAL.qxd 7/25/06 1:45 PM Page 178
$scale = (1 << ($zoom)) * GoogleMapUtility::TILE_SIZE;
return new Point(
(int) ($normalised->x * $scale),
(int)($normalised->y * $scale)
);
}
}
/**
* Object to represent a coordinate point (x,y).
**/
class Point {
public $x,$y;
function __construct($x,$y) {
$this->x = $x;
$this->y = $y;
}
function __toString() {
return "({$this->x},{$this->y})";
}
}
/**
* Object to represent a boundary point (x,y) and (width,height)
**/
class Boundary {
public $x,$y,$width,$height;
function __construct($x,$y,$width,$height) {
$this->x = $x;
$this->y = $y;
$this->width = $width;
$this->height = $height;
}
function __toString() {
return "({$this->x},{$this->y},{$this->width},{$this->height})";
}
}
?>
CHAPTER 7 ■ OPTIMIZING AND SCALING FOR LARGE DATA SETS 179
7079ch07FINAL.qxd 7/25/06 1:45 PM Page 179
Using the GoogleMapsUtility class, you can determine what information you need to
include in each tile. For example, in the client-side JavaScript for the custom tile method in
Listing 7-12 (which you’ll see soon), each tile request:
var tileURL = "server.php?x="+tile.x+"&y="+tile.y+"&zoom="+zoom;
contains three bits of information: an X position, a Y position, and the zoom level. These three
bits of information can be used to calculate the latitude and longitude boundary of a specific
Google tile using the GoogleMapsUtility::getTileRect method, as demonstrated in the
server-side PHP script for the custom tiles in Listing 7-13 (also coming up soon). The X and Y
positions represent the tile number of the map relative to the top-left corner, where positive X
and Y are east and south, respectively, starting at 1 and increasing as illustrated in Figure 7-8.
You can also see that the first column in Figure 7-8 contains tile (7,1) because the map has
wrapped beyond the meridian, so the first column is actually the rightmost edge of the map
and the second column is the leftmost edge.
Figure 7-8. Google tile numbering scheme
The zoom level is also required so that the calculations can determine the latitude
and longitude resolution of the current map. For now, play with the example in Listings 7-12
and 7-13 ( In Chapter 9, you’ll get
into the math required to calculate the proper position of latitude and longitude on the Mer-
cator projection, as well as a few other projections.
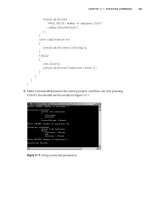
For the sample tiles, we’ve drawn a colored circle outlined in white with each color repre-
senting the height of the tower, as shown in Figure 7-9.
CHAPTER 7 ■ OPTIMIZING AND SCALING FOR LARGE DATA SETS180
7079ch07FINAL.qxd 7/25/06 1:45 PM Page 180
Figure 7-9. The finalized custom tile map in satellite mode
For testing purposes, each tile is also labeled with the date/time tile number and the
number of points in that tile. If you look at the online example, you’ll notice that the tiles ren-
der very quickly. Once drawn, the tiles are cached on the server side so when requested again, the
tiles are automatically served up by the server. Originally, when the tiles were created for zoom
level 1, some took up to 15 seconds to render, as there were almost 50,000 points per tiles in the
United States. If the data on your map is continually changing, you may want to consider
running a script to create all the tiles before publishing your map to the Web so your first
visitors don’t experience a lag when the tiles are first created.
Listing 7-12. Client-Side JavaScript for the Custom Tile Method
var map;
var centerLatitude = 49.224773;
var centerLongitude = -122.991943;
var startZoom = 6;
//create the tile layer object
var detailLayer = new GTileLayer(new GCopyrightCollection(''));
//method to retrieve the URL of the tile
detailLayer.getTileUrl = function(tile, zoom){
//pass the x and y position as well as the zoom
var tileURL = "server.php?x="+tile.x+"&y="+tile.y+"&zoom="+zoom;
return tileURL;
};
CHAPTER 7 ■ OPTIMIZING AND SCALING FOR LARGE DATA SETS 181
7079ch07FINAL.qxd 7/25/06 1:45 PM Page 181
detailLayer.isPng = function() {
//the example uses GIFs
return false;
}
//add your tiles to the normal map projection
detailMapLayers = G_NORMAL_MAP.getTileLayers();
detailMapLayers.push(detailLayer);
//add your tiles to the satellite map projection
detailMapLayers = G_SATELLITE_MAP.getTileLayers();
detailMapLayers.push(detailLayer);
function init() {
map = new GMap2(document.getElementById("map"));
map.addControl(new GSmallMapControl());
map.addControl(new GMapTypeControl());
map.setCenter(new GLatLng(centerLatitude, centerLongitude), startZoom);
}
window.onload = init;
Listing 7-13. Server-Side PHP for the Custom Tile Method
<?php
//include the helper calculations
require('GoogleMapUtility.php');
//this script may require additional memory and time
set_time_limit(0);
ini_set('memory_limit',8388608*10);
//create an array of the size for each marker at each zoom level
$markerSizes = array(1,1,1,1,2,2,3,3,4,4,5,5,6,6,7,7,8,8,9,9,10,10,11,11,12,12);
//get the lat/lng bounds of this tile from the utility function
//return a bounds object with width,height,x,y
$rect = GoogleMapUtility::getTileRect(
(int)$_GET['x'],
(int)$_GET['y'],
(int)$_GET['zoom']
);
CHAPTER 7 ■ OPTIMIZING AND SCALING FOR LARGE DATA SETS182
7079ch07FINAL.qxd 7/25/06 1:45 PM Page 182
//create a unique file name for this tile
$file = 'tiles/c'.md5(
serialize($markerSizes).
serialize($rect).'|'.
$_GET['x'].'|'.
$_GET['y'].'|'.
$_GET['zoom']).
'.gif';
//check if the file already exists
if(!file_exists($file)) {
//create a new image
$im = imagecreate(GoogleMapUtility::TILE_SIZE,GoogleMapUtility::TILE_SIZE);
$trans = imagecolorallocate($im,0,0,255);
imagefill($im,0,0,$trans);
imagecolortransparent($im, $trans);
$black = imagecolorallocate($im,0,0,0);
$white = imagecolorallocate($im,255,255,255);
//set up some colors for the markers.
//each marker will have a color based on the height of the tower
$darkRed = imagecolorallocate($im,150,0,0);
$red = imagecolorallocate($im,250,0,0);
$darkGreen = imagecolorallocate($im,0,150,0);
$green = imagecolorallocate($im,0,250,0);
$darkBlue = imagecolorallocate($im,0,0,150);
$blue = imagecolorallocate($im,0,0,250);
$orange = imagecolorallocate($im,250,150,0);
//init some vars
$extend = 0;
$z = (int)$_GET['zoom'];
$swlat=$rect->y + $extend;
$swlng=$rect->x+ $extend;
$nelat=$swlat+$rect->height + $extend;
$nelng=$swlng+$rect->width + $extend;
//connect to the database
require($_SERVER['DOCUMENT_ROOT'] . '/db_credentials.php');
$conn = mysql_connect("localhost", $db_name, $db_pass);
mysql_select_db("googlemapsbook", $conn);
/*
* Retrieve the points within the boundary of the map.
* For the FCC data, all the points are within the US so we
* don't need to worry about the meridian problem.
*/
CHAPTER 7 ■ OPTIMIZING AND SCALING FOR LARGE DATA SETS 183
7079ch07FINAL.qxd 7/25/06 1:45 PM Page 183
$result = mysql_query(
"SELECT
longitude as lng,latitude as lat,struc_height,struc_elevation
FROM
fcc_towers
WHERE
(longitude > $swlng AND longitude < $nelng)
AND (latitude <= $nelat AND latitude >= $swlat)
ORDER BY
lat"
, $conn);
//get the number of points in this tile
$count = mysql_num_rows($result);
$filled=array();
$row = mysql_fetch_assoc($result);
while($row)
{
//get the x,y coordinate of the marker in the tile
$point = GoogleMapUtility::getPixelOffsetInTile($row['lat'],$row['lng'],$z);
//check if the marker was already drawn there
if($filled["{$point->x},{$point->y}"]<2) {
//pick a color based on the structure's height
if($row['struc_height']<=20) $c = $darkRed;
elseif($row['struc_height']<=40) $c = $red;
elseif($row['struc_height']<=80) $c = $darkGreen;
elseif($row['struc_height']<=120) $c = $green;
elseif($row['struc_height']<=200) $c = $darkBlue;
else $c = $blue;
//if there is aready a point there, make it orange
if($filled["{$point->x},{$point->y}"]==1) $c=$orange;
//get the size
$size = $markerSizes[$z];
//draw the marker
if($z<2) imagesetpixel($im, $point->x, $point->y, $c );
elseif($z<12) {
imagefilledellipse($im, $point->x, $point->y, $size, $size, $c );
imageellipse($im, $point->x, $point->y, $size, $size, $white );
} else {
imageellipse($im, $point->x, $point->y, $size-1, $size-1, $c );
imageellipse($im, $point->x, $point->y, $size-2, $size-2, $c );
CHAPTER 7 ■ OPTIMIZING AND SCALING FOR LARGE DATA SETS184
7079ch07FINAL.qxd 7/25/06 1:45 PM Page 184
imageellipse($im, $point->x, $point->y, $size+1, $size+1, $black );
imageellipse($im, $point->x, $point->y, $size, $size, $white );
}
//record that we drew the marker
$filled["{$point->x},{$point->y}"]++;
}
$row = mysql_fetch_assoc($result);
}
//write some info about the tile to the image for testing
imagestring($im,1,-1,0,
"$count points in tile ({$_GET['x']},{$_GET['y']}) @ zoom $z ",$white);
imagestring($im,1,0,1,
"$count points in tile ({$_GET['x']},{$_GET['y']}) @ zoom $z ",$white);
imagestring($im,1,0,-1,
"$count points in tile ({$_GET['x']},{$_GET['y']}) @ zoom $z ",$white);
imagestring($im,1,1,0,
"$count points in tile ({$_GET['x']},{$_GET['y']}) @ zoom $z ",$white);
imagestring($im,1,0,0,
"$count points in tile ({$_GET['x']},{$_GET['y']}) @ zoom $z ",$black);
imagestring($im,1,0,9,date('r'),$black);
//output the new image to the file system and then send it to the browser
header('content-type:image/gif;');
imagegif($im,$file);
echo file_get_contents($file);
} else {
//output the existing image to the browser
header('content-type:image/gif;');
echo file_get_contents($file);
}
?>
■Tip Another benefit of using the tile layer is that it bypasses the cross-domain scripting restrictions on the
browser. Each tile is actually an image and nothing more. The
GET parameters specify which tile the browser
is requesting, and the browser can load any image from any site, as it is not considered malicious—it’s just
an image.
CHAPTER 7 ■ OPTIMIZING AND SCALING FOR LARGE DATA SETS 185
7079ch07FINAL.qxd 7/25/06 1:45 PM Page 185
BUT WHAT ABOUT INFO WINDOWS?
Using tiles to display your “markers” is relatively easy, and you can simulate most of the features of the GMarker
object, with the exception of info windows. You can’t attach an info window to the pretend markers in your tile,
but you can fake it.
Back in Chapter 3, you created an info window when you clicked on the map by using
GMap2.openInfoWindow. You could do the same here, and then use an Ajax request to ask for the content of
the info window using something like this:
GEvent.addListener(map, "click", function(marker, point) {
GDownloadUrl(
"your_server_side_script.php?"
+ "lat=" + point.lat()
+ "&lng=" + point.lng()
+ "&z=" + map.getZoom(),
function(data, responseCode) {
map.openInfoWindow(point,document.createTextNode(data));
});
});
The trick is figuring out what was actually clicked. When your users click your map, you’ll need to send
the location’s latitude and longitude back to the server and have it determine what information is relative to that
point. If something was clicked, you can then send the appropriate information back across the Ajax request and
create an info window directly on the map. From the client’s point of view, it will look identical to an info window
attached to a marker, except that it will be slightly slower to appear, as your server needs to process the
request to see what was clicked.
Optimizing the Client-Side User Experience
If your data set is just a little too big for the map—somewhere between 100 to 300 points—
you don’t necessarily need to make new requests to retrieve your information. You can achieve
good results using solutions similar to those we’ve outlined for the server side, but store the
data set in the browser’s memory using a JavaScript object. This way, you can achieve the same
effect but not require an excessive number of requests to the server.
The three methods we’ll discuss are pretty much the same as the corresponding server-side
methods, except that the processing is all done on the client side using the methods of the API
rather than calculating everything on the server side:
• Client-side boundary method
• Client-side closest to a common point method
• Client-side clustering
After we look at these solutions using client-side JavaScript and data objects, we’ll recom-
mend a couple other optimizations to improve your users’ experience.
CHAPTER 7 ■ OPTIMIZING AND SCALING FOR LARGE DATA SETS186
7079ch07FINAL.qxd 7/25/06 1:45 PM Page 186
Client-Side Boundary Method
With the server-side boundary method, you used the server to check if a point was inside the
boundary of the map. Doing so on the server side required that you write the calculation man-
ually into your script. Using the Google Maps API provides a much simpler solution, as you
can use the contains() method of the GLatLngBounds object to ask the API if your GLatLng point
is within the specified boundary. The contains() methods returns true if the supplied point is
within the geographical coordinates defined by the rectangular boundary.
Listing 7-14 ( shows the working
example of the boundary method implemented in JavaScript.
Listing 7-14. JavaScript for the Client-Side Boundary Method
var map;
var centerLatitude = 49.224773;
var centerLongitude = -122.991943;
var startZoom = 4;
function init() {
map = new GMap2(document.getElementById("map"));
map.addControl(new GSmallMapControl());
map.setCenter(new GLatLng(centerLatitude, centerLongitude), startZoom);
updateMarkers();
GEvent.addListener(map,'zoomend',function() {
updateMarkers();
});
GEvent.addListener(map,'moveend',function() {
updateMarkers();
});
}
function updateMarkers() {
map.clearOverlays();
var mapBounds = map.getBounds();
//loop through each of the points from the global points object
for (k in points) {
var latlng = new GLatLng(points[k].lat,points[k].lng);
if(!mapBounds.contains(latlng)) continue;
var marker = createMarker(latlng);
map.addOverlay(marker);
}
}
CHAPTER 7 ■ OPTIMIZING AND SCALING FOR LARGE DATA SETS 187
7079ch07FINAL.qxd 7/25/06 1:45 PM Page 187
function createMarker(point) {
var marker = new GMarker(point);
return marker;
}
window.onload = init;
When you move or zoom the map, the updateMarkers() function loops through
a points object to create the necessary markers for the boundary of the viewable area. The
points JSON object resembles the object discussed earlier in the chapter:
var points = {
p1:{lat:-53,lng:-74},
p2:{lat:-51.4,lng:59.51},
p3:{lat:-45.2,lng:-168.43},
p4:{lat:-41.19,lng:-174.46},
p5:{lat:-36.3,lng:60},
p6:{lat:-35.15,lng:-149.08},
p7:{lat:-34.5,lng:56.11},
etc
p300:{lat:-33.24,lng:70.4},
}
This object was loaded into the browser using another script tag, in the same way you
loaded the data into the map in Chapter 2. Now, rather than creating a new request to the
server, the points object contains all the points, so you only need to loop through points
and determine if the current point is within the current boundary. Listing 7-14 uses the cur-
rent boundary of the map from map.getBounds().
Client-Side Closest to a Common Point Method
As with the boundary method, the client-side closest to a common point method is similar
to the server-side closest to common point method, but you can use the Google Maps API to
accomplish the same goal on the client side if you don’t have too many points. With a known
latitude and longitude point, you can calculate the distance from the known point to any other
point using the distanceFrom() method of the GLatLng class as follows:
var here = new GLatLng(lat,lng);
var distanceFromThereToHere = here.distanceFrom(there);
The distanceFrom() method returns the distance between the two points in meters, but
remember that the Google Maps API assumes the earth is a sphere, even though the earth is
slightly elliptical, so the accuracy of the distance may be off by as much as 0.3%, depending
where the two points are on the globe.
In Listing 7-15 ( you can see the
client-side JavaScript is very similar to the server-side PHP in Listing 7-5. The main difference
(besides not sending a request to the server) is the use of point.distanceFrom() rather than
CHAPTER 7 ■ OPTIMIZING AND SCALING FOR LARGE DATA SETS188
7079ch07FINAL.qxd 7/25/06 1:45 PM Page 188
the surfaceDistance() PHP function. Also for the example, the boundary of the data is out-
lined using the Rectangle object, similar to the one discussed earlier.
Listing 7-15. JavaScript for the Client-Side Closest to Common Point Method
var map;
var centerLatitude = 41.8;
var centerLongitude = -72.3;
var startZoom = 8;
function init() {
map = new GMap2(document.getElementById("map"));
map.addControl(new GSmallMapControl());
map.setCenter(new GLatLng(centerLatitude, centerLongitude), startZoom);
//pass in an initial point for the center
updateMarkers(new GLatLng(centerLatitude, centerLongitude));
GEvent.addListener(map,'click',function(overlay,point) {
//pass in the point for the center
updateMarkers(point);
});
}
function updateMarkers(relativeTo) {
//remove the existing points
map.clearOverlays();
//mark the outer boundary of the data from the points object
var allsw = new GLatLng(41.57025176609894, -73.39965820312499);
var allne = new GLatLng(42.589488572714245, -71.751708984375);
var allmapBounds = new GLatLngBounds(allsw,allne);
map.addOverlay(new Rectangle(allmapBounds,4,"#F00"));
var distanceList = [];
var p = 0;
//loop through points and get the distance to each point
for (k in points) {
distanceList[p] = {};
distanceList[p].glatlng = new GLatLng(points[k].lat,points[k].lng);
distanceList[p].distance = distanceList[p].glatlng.distanceFrom(relativeTo);
p++;
}
//sort based on the distance
distanceList.sort(function (a,b) {
CHAPTER 7 ■ OPTIMIZING AND SCALING FOR LARGE DATA SETS 189
7079ch07FINAL.qxd 7/25/06 1:45 PM Page 189
if(a.distance > b.distance) return 1
if(a.distance < b.distance) return -1
return 0
});
//create the first 50 markers
for (i=0 ; i<50 ; i++) {
var marker = createMarker(distanceList[i].glatlng);
map.addOverlay(marker);
if(++i > 50) break;
}
}
function createMarker(point) {
var marker = new GMarker(point);
return marker;
}
window.onload = init;
/*
* Rectangle overlay for testing to mark boundaries
*/
function Rectangle(bounds, opt_weight, opt_color) {
this.bounds_ = bounds; this.weight_ = opt_weight || 1;
this.color_ = opt_color || "#888888";
}
Rectangle.prototype = new GOverlay();
Rectangle.prototype.initialize = function(map) {
var div = document.createElement("div");
div.innerHTML = '<strong>Click inside area</strong>';
div.style.border = this.weight_ + "px solid " + this.color_;
div.style.position = "absolute";
map.getPane(G_MAP_MAP_PANE).appendChild(div);
this.map_ = map;
this.div_ = div;
}
Rectangle.prototype.remove = function() {
this.div_.parentNode.removeChild(this.div_);
}
Rectangle.prototype.copy = function() {
return new Rectangle(
this.bounds_,
this.weight_,
this.color_,
this.backgroundColor_,
CHAPTER 7 ■ OPTIMIZING AND SCALING FOR LARGE DATA SETS190
7079ch07FINAL.qxd 7/25/06 1:45 PM Page 190
this.opacity_
);
}
Rectangle.prototype.redraw = function(force) {
if (!force) return;
var c1 = this.map_.fromLatLngToDivPixel(this.bounds_.getSouthWest());
var c2 = this.map_.fromLatLngToDivPixel(this.bounds_.getNorthEast());
this.div_.style.width = Math.abs(c2.x - c1.x) + "px";
this.div_.style.height = Math.abs(c2.y - c1.y) + "px";
this.div_.style.left = (Math.min(c2.x, c1.x) - this.weight_) + "px";
this.div_.style.top = (Math.min(c2.y, c1.y) - this.weight_) + "px";
}
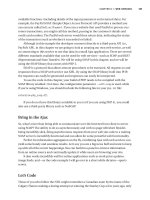
Client-Side Clustering
If your data is dense, you may still want to cluster points when there are overlapping points in
proximity. As with the server-side clustering method, there are a variety of ways you can calculate
which points to group. In Listing 7-16 ( we
use a grid method similar to the one we used with the server-side clustering example. The biggest dif-
ference here is your grid cells will be larger and not as fine-grained, so you don’t slow down the
JavaScript on slower computers. If you modify the grid cells over several loops, the browser
may assume that the script is taking too long and display a warning, as shown in Figure 7-10.
Figure 7-10. A JavaScript warning in Firefox indicating the script is taking too long to execute
Listing 7-16. JavaScript for Client-Side Clustering
var map;
var centerLatitude = 42;
var centerLongitude = -72;
var startZoom = 8;
//create an icon for the clusters
var iconCluster = new GIcon();
iconCluster.image = " />iconCluster.shadow = " />iconCluster.iconSize = new GSize(26, 25);
iconCluster.shadowSize = new GSize(22, 20);
iconCluster.iconAnchor = new GPoint(13, 25);
iconCluster.infoWindowAnchor = new GPoint(13, 1);
iconCluster.infoShadowAnchor = new GPoint(26, 13);
CHAPTER 7 ■ OPTIMIZING AND SCALING FOR LARGE DATA SETS 191
7079ch07FINAL.qxd 7/25/06 1:45 PM Page 191
//create an icon for the pins
var iconSingle = new GIcon();
iconSingle.image = " />iconSingle.shadow = " />iconSingle.iconSize = new GSize(12, 20);
iconSingle.shadowSize = new GSize(22, 20);
iconSingle.iconAnchor = new GPoint(6, 20);
iconSingle.infoWindowAnchor = new GPoint(6, 1);
iconSingle.infoShadowAnchor = new GPoint(13, 13);
function init() {
map = new GMap2(document.getElementById("map"));
map.addControl(new GSmallMapControl());
map.setCenter(new GLatLng(centerLatitude, centerLongitude), startZoom);
updateMarkers();
GEvent.addListener(map,'zoomend',function() {
updateMarkers();
});
GEvent.addListener(map,'moveend',function() {
updateMarkers();
});
}
function updateMarkers() {
//remove the existing points
map.clearOverlays();
//mark the boundary of the data
var allsw = new GLatLng(41.57025176609894, -73.39965820312499);
var allne = new GLatLng(42.589488572714245, -71.751708984375);
var allmapBounds = new GLatLngBounds(allsw,allne);
map.addOverlay(
new Rectangle(
allmapBounds,
4,
'#F00',
'<strong>Data Bounds, Zoom in for detail.</strong>'
)
);
7079ch07FINAL.qxd 7/25/06 1:45 PM Page 192
//get the bounds of the viewable area
var mapBounds = map.getBounds();
var sw = mapBounds.getSouthWest();
var ne = mapBounds.getNorthEast();
var size = mapBounds.toSpan(); //returns GLatLng
//make a grid that's 10x10 in the viewable area
var gridSize = 10;
var gridCellSizeLat = size.lat()/gridSize;
var gridCellSizeLng = size.lng()/gridSize;
var gridCells = [];
//loop through the points and assign each one to a grid cell
for (k in points) {
var latlng = new GLatLng(points[k].lat,points[k].lng);
//check if it is in the viewable area,
//it may not be when zoomed in close
if(!mapBounds.contains(latlng)) continue;
//find grid cell it is in:
var testBounds = new GLatLngBounds(sw,latlng);
var testSize = testBounds.toSpan();
var i = Math.ceil(testSize.lat()/gridCellSizeLat);
var j = Math.ceil(testSize.lng()/gridCellSizeLng);
var cell = i+j;
if( typeof gridCells[cell] == 'undefined') {
//add it to the grid cell array
var cellSW = new GLatLng(
sw.lat()+((i-1)*gridCellSizeLat),
sw.lng()+((j-1)*gridCellSizeLng)
);
var cellNE = new GLatLng(
cellSW.lat()+gridCellSizeLat,
cellSW.lng()+gridCellSizeLng
);
gridCells[cell] = {
GLatLngBounds : new GLatLngBounds(cellSW,cellNE),
cluster : false,
markers:[],
length:0
};
//mark cell for testing
CHAPTER 7 ■ OPTIMIZING AND SCALING FOR LARGE DATA SETS 193
7079ch07FINAL.qxd 7/25/06 1:45 PM Page 193
map.addOverlay(
new Rectangle(
gridCells[cell].GLatLngBounds,
1,
'#00F',
'<strong>Grid Cell</strong>'
)
);
}
gridCells[cell].length++;
//already in cluster mode
if(gridCells[cell].cluster) continue;
//only cluster if it has more than 2 points
if(gridCells[cell].markers.length==3) {
gridCells[cell].markers=null;
gridCells[cell].cluster=true;
} else {
gridCells[cell].markers.push(latlng);
}
}
for (k in gridCells) {
if(gridCells[k].cluster == true) {
//create a cluster marker in the center of the grid cell
var span = gridCells[k].GLatLngBounds.toSpan();
var sw = gridCells[k].GLatLngBounds.getSouthWest();
var marker = createMarker(
new GLatLng(sw.lat()+(span.lat()/2),
sw.lng()+(span.lng()/2))
,'c'
);
map.addOverlay(marker);
} else {
//create the single markers
for(i in gridCells[k].markers) {
var marker = createMarker(gridCells[k].markers[i],'p');
map.addOverlay(marker);
}
}
}
}
function createMarker(point, type) {
CHAPTER 7 ■ OPTIMIZING AND SCALING FOR LARGE DATA SETS194
7079ch07FINAL.qxd 7/25/06 1:45 PM Page 194
//create the marker with the appropriate icon
if(type=='c') {
var marker = new GMarker(point,iconCluster,true);
} else {
var marker = new GMarker(point,iconSingle,true);
}
return marker;
}
window.onload = init;
/*
* Rectangle overlay for development only to mark boundaries for testing
*/
function Rectangle(bounds, opt_weight, opt_color, opt_html) {
this.bounds_ = bounds; this.weight_ = opt_weight || 1;
this.html_ = opt_html || ""; this.color_ = opt_color || "#888888";
}
Rectangle.prototype = new GOverlay();
Rectangle.prototype.initialize = function(map) {
var div = document.createElement("div");
div.innerHTML = this.html_;
div.style.border = this.weight_ + "px solid " + this.color_;
div.style.position = "absolute";
map.getPane(G_MAP_MAP_PANE).appendChild(div);
this.map_ = map;
this.div_ = div;
}
Rectangle.prototype.remove = function() {
this.div_.parentNode.removeChild(this.div_);
}
Rectangle.prototype.copy = function() {
return new Rectangle(
this.bounds_,
this.weight_,
this.color_,
this.backgroundColor_,
this.opacity_
);
}
Rectangle.prototype.redraw = function(force) {
if (!force) return;
var c1 = this.map_.fromLatLngToDivPixel(this.bounds_.getSouthWest());
var c2 = this.map_.fromLatLngToDivPixel(this.bounds_.getNorthEast());
this.div_.style.width = Math.abs(c2.x - c1.x) + "px";
this.div_.style.height = Math.abs(c2.y - c1.y) + "px";
CHAPTER 7 ■ OPTIMIZING AND SCALING FOR LARGE DATA SETS 195
7079ch07FINAL.qxd 7/25/06 1:45 PM Page 195