Báo cáo y học: " Regional differences in the pattern of airway remodeling following chronic allergen exposure in mice" pptx
Bạn đang xem bản rút gọn của tài liệu. Xem và tải ngay bản đầy đủ của tài liệu tại đây (1.55 MB, 9 trang )
BioMed Central
Page 1 of 9
(page number not for citation purposes)
Respiratory Research
Open Access
Research
Regional differences in the pattern of airway remodeling following
chronic allergen exposure in mice
Jeremy A Hirota*, Russ Ellis and Mark D Inman
Address: Firestone Institute for Respiratory Health, Department of Medicine, McMaster University, Hamilton, Ontario, Canada
Email: Jeremy A Hirota* - ; Russ Ellis - ; Mark D Inman -
* Corresponding author
Abstract
Background : Airway remodeling present in the large airways in asthma or asthma models has
been associated with airway dysfunction in humans and mice. It is not clear if airways distal to the
large conducting airways have similar degrees of airway remodeling following chronic allergen
exposure in mice. Our objective was to test the hypothesis that airway remodeling is
heterogeneous by optimizing a morphometric technique for distal airways and applying this to mice
following chronic exposure to allergen or saline.
Methods : In this study, BALB/c mice were chronically exposed to intranasal allergen or saline.
Lung sections were stained for smooth muscle, collagen, and fibronectin content. Airway
morphometric analysis of small (0–50000 μm
2
), medium (50000 μm
2
–175000 μm
2
) and large
(>175000 μm
2
) airways was based on quantifying the area of positive stain in several defined sub-
epithelial regions of interest. Optimization of this technique was based on calculating sample sizes
required to detect differences between allergen and saline exposed animals.
Results : Following chronic allergen exposure BALB/c mice demonstrate sustained airway
hyperresponsiveness. BALB/c mice demonstrate an allergen-induced increase in smooth muscle
content throughout all generations of airways, whereas changes in subepithelial collagen and
fibronectin content are absent from distal airways.
Conclusion : We demonstrate for the first time, a systematic objective analysis of allergen induced
airway remodeling throughout the tracheobronchial tree in mice. Following chronic allergen
exposure, at the time of sustained airway dysfunction, BALB/c mice demonstrate regional
differences in the pattern of remodeling. Therefore results obtained from limited regions of lung
should not be considered representative of the entire airway tree.
Background
The hallmarks of asthma are variable airflow limitation
associated with increased airway responsiveness, airway
inflammation, and airway remodeling [1-5]. Ongoing air-
way inflammation and associated airway remodeling are
believed to play a role in the development of airway
hyperresponsiveness and airflow limitation. The relative
contribution of various pathologic components to the
increased airway responsiveness is yet to be elucidated,
although airway remodeling appears to play a major role
[3-5]. In human studies, advances in this area have relied
on quantifying established airway remodeling and relat-
Published: 21 September 2006
Respiratory Research 2006, 7:120 doi:10.1186/1465-9921-7-120
Received: 19 July 2006
Accepted: 21 September 2006
This article is available from: />© 2006 Hirota et al; licensee BioMed Central Ltd.
This is an Open Access article distributed under the terms of the Creative Commons Attribution License ( />),
which permits unrestricted use, distribution, and reproduction in any medium, provided the original work is properly cited.
Respiratory Research 2006, 7:120 />Page 2 of 9
(page number not for citation purposes)
ing this to airway function measured at the same time
[1,3,6]. In animal studies, greater insight is potentially
afforded by observing the development of airway remod-
eling over time and relating this to changes in airway func-
tion occurring over the same period [7,8]. We currently
use a murine chronic allergen exposure protocol that
results in airway remodeling and associated sustained air-
way dysfunction which persists for up to 8 wks following
cessation of allergen [7]. In human and animal
approaches, assumptions have been made that measure-
ment of airway remodeling changes at a single, or limited
number of airway generations represents the whole lung.
While this assumption is necessary when the access to
multiple sites is limited (i.e. human biopsy studies), it is
unlikely to be valid. In fact, there is evidence that the
extent of specific indices of airway remodeling differs
depending on the airway generation [9-11].
The involvement of the airways distal to the large conduct-
ing airways in respiratory disease, has been debated since
Weibel's anatomical classification of small airways as
being less than 2 mm in diameter [9,10,12-14]. More
recently, the perception of the contribution of the small
airways to overall lung resistance has shifted from a silent
or quiet zone [15,16], to a more functionally relevant tis-
sue [11,17].
To fully understand the contribution of each airway gen-
eration to airway disease we will require methods to assess
inflammatory and structural changes throughout these
airways. Similar to humans, the distribution of airway
remodeling in mice following chronic allergen exposure is
currently poorly described. We therefore felt it was pru-
dent to develop and apply objective methods of quantify-
ing airway remodeling throughout the tracheobronchial
tree in animal models of allergic airway disease.
It is our hypothesis that quantifying the extent of several
indices of airway remodeling in a range of airway calibers
will reveal distinct patterns of changes at different levels of
the tracheobronchial tree. To test this hypothesis, we
present and characterize methods for assessing allergen-
induced airway remodeling in the small and medium air-
ways of mice having been subjected to chronic allergen
exposure [7]. After optimizing these methods, we report
that following chronic allergen exposure, distinct patterns
of airway remodeling exist in different sized airways.
Materials and methods
Animals
Female BALB/c wild type mice, aged 10–12 weeks, were
purchased from Harlan Sprague Dawley (Indianapolis,
IN). All mice were housed in environmentally controlled,
specific pathogen-free conditions for a one week acclima-
tization period and throughout the duration of the stud-
ies. All procedures were approved by the Animal Research
Ethics Board at McMaster University, and conformed to
the NIH guidelines for experimental use of animals.
Sensitization and exposure
Mice were sensitized as described previously by us [7].
Briefly, all mice received intraperitoneal (IP) injections of
ovalbumin (OVA) conjugated to aluminium potassium
sulfate on Days 1 and 11 and intranasal (IN) OVA on Day
11. Following sensitization, mice were subjected to a
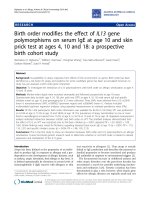
chronic allergen exposure protocol (Figure 1). Chronic
allergen exposure was comprised of six 2-day periods of
intranasal ovalbumin (IN OVA) administration (100 μg
in 25 μl saline), each separated by 12 days. Exposures
started on Days 19 and 20. Outcome measurements were
made four weeks following the final period of allergen
exposure and included (i) in vivo assessment of airway
responsiveness to methacholine, (ii) large airway mor-
phometry as described previously [18] (iii) a novel
method for assessing morphometry of small and medium
airways.
Airway responsiveness
Airway responsiveness was measured by total respiratory
system resistance (R
RS
) responses to intravenous saline
and increasing doses of methacholine (MCh) using the
FlexiVent ventilator system (n = 8 per group). Each mouse
Chronic allergen exposure protocolFigure 1
Chronic allergen exposure protocol. Sensitization was performed on Day 1 and Day 11. Six 2-day periods of allergen exposure,
each separated by 12 days, started on Days 19 and 20. Outcomes were performed 4 wks post chronic allergen exposure.
Respiratory Research 2006, 7:120 />Page 3 of 9
(page number not for citation purposes)
was anaesthetized with Avertin (2,2,2-Tribromoethanol,
Sigma, Canada) via IP injection at a dose of 240 mg/kg
and then underwent tracheostomy with a blunted 18-
gauge needle, and then connected to the FlexiVent
(SCIREQ, Montreal, Canada) computer-controlled small
animal ventilator. Animals were ventilated quasisinusoi-
dally (150 breaths/min, 10 ml/kg, inspiration/expiration
ratio of 66.7%, and a pressure limit of 30 cmH
2
O). A
script for the automated collection of data was then initi-
ated, with the PEEP level set at 2 cmH
2
O and default ven-
tilation for mice. After the mouse was stabilized on the
ventilator, the internal jugular was cannulated using a 25-
gauge needle. Paralysis was achieved using pancuronium
(0.03 mg/kg intravenously) to prevent respiratory effort
during measurement. To provide a constant volume his-
tory, data collection was preceded by a 6 sec inspiration to
TLC perturbation (peak amplitude 25 cmH
2
O). Twenty
seconds later the user was prompted to intravenously
inject saline then 10, 33, 100, and 330 mg/kg of MCh
(ACIC [Can], Brantford, ON, Canada). For each dose,
thirteen "QuickSnap-150" perturbations (single inspira-
tion/expiration of 0.4 sec duration with a volume ampli-
tude relative to weight of 10 ml/kg) were performed over
a 45 sec period, followed 10 sec later by another 6 sec TLC.
After the last dose was complete, the mouse was removed
from the ventilator and killed via terminal exsanguina-
tions and subjected to further tissue collection. Airway
responsiveness was quantified by the slope of the linear
regression between peak respiratory system resistance and
the log
10
of the MCh dose, using the data from the 10, 33,
and 100 μg/kg doses only. Heart rate and oxygen satura-
tion were monitored via infrared pulse oxymetry (Biox
3700; Ohmeda, Boulder, CO) using a standard ear probe
placed over the proximal portion of the mouse's hind
limb.
Lung histology
Following in vivo assessment of airway responsiveness,
lungs were dissected, removed, inflated with 10% forma-
lin with a pressure of 25 cm H
2
O, ligated at the trachea,
and fixed in 10% formalin for 24 hours. Following fixa-
tion, the left lung was isolated and bisected into superior
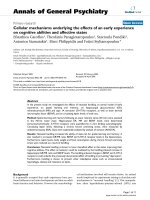
and inferior segments (Figure 2). The inferior portion of
the left lobe was embedded with the bisected face down to
obtain transverse cross sections of the primary bronchus
for large airway morphometry. The superior portion of the
left lobe was subjected to a sagittal cut and embedded
with the sagittal face down for airway morphometry of air-
ways distal to the primary bronchus (Figure 2). Both supe-
rior and inferior lung portions were embedded in the
same paraffin wax tissue block, and rough cut to expose a
smooth tissue surface. Three micron thick sections were
stained with Picrosirius Red (PSR) for assessing the pres-
ence of collagen. Further sections were immunostained
using monoclonal antibodies against α-smooth muscle
actin (α-SMA)(Clone 1A4, Dako, Denmark) and fibronec-
tin (Clone 10, BD Biosciences, Canada)
Lung morphometry
All tissue sections were viewed and images collected under
20× objective magnification light microscopy (Olympus
BX40; Carsen Group Inc., Markham Ontario). A custom-
ized digital image analysis system (Northern Eclipse, Ver-
sion 7.0; Empix Imaging Inc., Mississauga, Ontario,
Canada) with an attached digital pen and drawing tablet
was used to collect and analyze images. Airways that satis-
fied the following criteria were included for airway analy-
sis: (i) the airway needed to be completely contained in a
single microscope field of view (690 μm × 520 μm); (ii)
the ratio of the major and minor airway axes needed to be
less than 2 (maximum diameter/minimum diameter) to
ensure that the airway was not obliquely cut; (iii) the air-
way perimeter needed to be completely intact. Images of
airways that satisfied these criteria were saved as tagged
image file format files. Image collection and analysis was
performed by two separate individuals; the first individual
would collect, code, and determine the size of airways, the
second individual would be blinded and analyze the col-
lected coded images as follows. Using the custom digital
image analysis system, quantification of the area of posi-
tive stain per region of interest was performed for α-SMA,
PSR, and fibronectin stained tissues. Areas of airway wall
associated with connective tissue from neighbouring ves-
sels were excluded by drawing boundaries for analysis
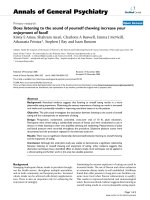
(Figure 3). While viewing the airway of interest, the basal
border of the epithelium (corresponding to the basement
membrane) was traced. The image with clearly defined
boundaries for morphometric analysis was then saved as
a new file to be used for all subsequent steps. Using the
image file with established basement membrane trace, a 5
um thick region of interest extending from the trace out
into the parenchyma was drawn using the digital pen and
tablet (Figure 3). The software then calculated the area of
stain within the region of interest based on previously
determined stain specific colour plane settings. The
amount of positive stain area was then expressed as a per-
centage of the region of interest area. The process was
repeated for each airway image captured from the same
animal, which were approximately 4 per animal. The aver-
age percent stain for all airways from the same animal was
calculated and used for statistical analysis. The analysis on
the same airway was repeated for 10, 15, 20, 25, 30, and
35 μm band depths. Medium and small airways were arbi-
trarily defined by determining the mean airway area of all
airways collected. The airways with areas below the mean
were defined as small, while airways with areas above the
mean were defined as medium. Large airways were col-
lected and analyzed as defined previously [18].
Respiratory Research 2006, 7:120 />Page 4 of 9
(page number not for citation purposes)
Statistical analysis
Summary data used in all comparisons are expressed as
mean and standard error of the mean (SEM). To deter-
mine optimum band depth for detecting airway remode-
ling changes, we calculated the sample size that would be
required to demonstrate observed allergen-induced
changes over a range of band depths. This was chosen as a
practically useful way of identifying the band depth with
optimal signal to noise characteristics. Sample sizes
required for comparing two groups were estimated based
on the difference of the means between the allergen and
control groups and the mean value of the standard devia-
tions at each given band depth. Sample size requirements
were based on a Student's t test analysis and calculated
with an assumed power of 80% (β = 0.2) and an α of 0.05.
Differences were assumed to be statistically different
when the observed p values were less than 0.05.
Results
Airway responsiveness
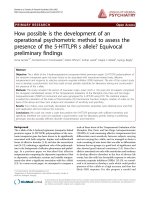
Airway function measurements were made two weeks fol-
lowing chronic allergen exposure (Figure 4A). At this time
point, significant increases in both airway reactivity and
maximum R
RS
were observed in BALB/c mice as compared
to control animals (p < 0.05; Figure 4B–C). Break point
[7] and EC
50
analysis of methacholine dose response
curves revealed no changes in airway sensitivity (data not
shown).
Airway characteristics
Large (primary bronchus) airways used for airway remod-
eling analysis ranged from 212 760 μm
2
to 418 325 μm
2
in area. The mean airway area and diameter were 311 035
μm
2
and 630 μm, respectively. The airway ratio (maxi-
mum to minimum diameter) ranged from 1.02 to 1.95.
Airways distal to the primary bronchus used for airway
remodeling analysis ranged from 12 269 μm
2
to 172 094
μm
2
in area. The mean airway area and diameter were 56
543 μm
2
and 270 μm, respectively. The airway ratio (max-
imum to minimum diameter) ranged from 1.01 to 1.98.
The airways distal to the first generation bronchus were
further divided into small (0–50 000 μm
2
) and medium
(50 000 μm
2
–175 000) airways, based on mean area, for
assessment of regional airway remodeling. The mean
Depiction of a small airway captured for analysisFigure 3
Depiction of a small airway captured for analysis. The airway
is associated with vessels, which are excluded from morpho-
metric analysis of airway walls. The sub-epithelial basement
membrane of the airway wall free from vessel association is
traced. A region of interest of defined band depth (5, 10, 15,
20, 25, 30, and 35 μm) is projected into the parenchyma
from the sub-epithelial basement membrane trace (black
lines). The stain of interest (α-SMA) is quantified by the soft-
ware as a percentage of the total band area for each band
depth.
Depiction of left lobe following inflation and fixation with for-malinFigure 2
Depiction of left lobe following inflation and fixation with for-
malin. The left lobe was bisected to produce superior and
inferior portions. The superior half of the left lobe was sub-
jected to a sagittal cut. The superior and inferior portions
were embedded in the same tissue block with extreme infe-
rior and superior sagittal faces down (thick lines) and sub-
jected to serially sectioning (fine lines).
Respiratory Research 2006, 7:120 />Page 5 of 9
(page number not for citation purposes)
small and medium airway areas for saline and allergen
exposed animals were not significantly different.
Airway remodeling can be detected in airways distal from
the primary bronchus of BALB/c mice
Chronic intranasal allergen exposure resulted in a statisti-
cally significant increase in α-SMA content in the small
and medium airways of BALB/c mice as compared to
saline controls (Figure 5A–B). In small airways, the opti-
mal band depth to detect α-SMA changes was 15 μm. This
conclusion was based on the band width requiring the
smallest sample size to detect the allergen-induced change
in α-SMA content (Table 1). In medium airways, an aller-
gen induced increase in α-SMA content was detected for
band depths ranging from 15–35 μm (Figure 5B). In
medium airways, the optimal band depth to detect α-SMA
content changes was 20 μm (Table 1).
Allergen exposure did not result in statistically significant
increases in PSR staining in the small airways (Figure 5C).
The medium airways demonstrate statistically significant
increases in PSR staining at all band depths assessed fol-
lowing chronic allergen exposure (Figure 5D). The opti-
mal band depth to detect PSR changes was 15 μm (Table
1).
Allergen exposure did not result in statistically significant
increases in fibronectin staining in the small airways (Fig-
ure 5E). Statistically significant increases in medium air-
way fibronectin content were detected following chronic
allergen exposure (Figure 5F). The optimal band depth to
detect fibronectin changes was 20 μm (Table 1).
Regional differences in the pattern of airway remodeling
are observed in BALB/c mice following chronic intranasal
allergen
The data presented above illustrates differences in airway
remodeling between small and medium airways. To fur-
ther investigate the heterogeneity of airway remodeling
we compared remodeling events between large (primary
bronchus), medium, and small airways using optimized
band depths (see above and ref [18]).
Following chronic allergen exposure the medium airways
demonstrated a 2.23 fold increase in smooth muscle con-
tent, compared to a 1.76 and 1.37 fold increase in the
small and large airways, respectively (Figure 6).
Similarly, there was a 3.31 fold increase in medium airway
collagen content, compared to 1.87 and 1.72 fold increase
in the small and large airways, respectively (Figure 7).
A 3.25 fold increase in fibronectin staining was observed
in the medium airways, compared to 1.71 and 1.44 fold
increase in the small and large airways, respectively (Fig-
ure 8).
Discussion
Here we demonstrate that regional differences in the pat-
tern of airway remodeling occur in the tracheobronchial
tree of mice following chronic allergen exposure. Our
morphometric methods for quantifying airway remode-
ling in mice is the first systematic airway remodeling anal-
ysis of the tracheobronchial tree following chronic
allergen exposure. These findings are important in dem-
onstrating that insults such as allergen can produce differ-
ential effects at different airway levels, which need to be
considered when evaluating these animals. Our data
therefore support the hypothesis that airway remodeling
is heterogeneous in this model of allergen exposure. This
emphasizes the importance of treating the tracheobron-
chial tree as being heterogeneous and argues against
approaches with limited scope (e.g. biopsies) as being
reflective of all airway generations.
It is important to emphasize that our decision to divide
airways distal to the primary bronchus into small and
A) Airway physiology responses to increasing doses of MCh measured four weeks following chronic exposure to saline (open) or OVA (closed) on FlexiVent ventilator systemFigure 4
A) Airway physiology responses to increasing doses of MCh
measured four weeks following chronic exposure to saline
(open) or OVA (closed) on FlexiVent ventilator system.
BALB/c saline (triangles), BALB/c OVA (squares). (B) Airway
reactivity and (C) maximum respiratory resistance values as
measured by MCh dose response slope and maximum resist-
ance, respectively for chronic saline (open) or OVA (closed)
BALB/c mice. Data are expressed as mean (SEM); 8 mice per
group. * significantly different from corresponding control
animals (p < 0.05).
Respiratory Research 2006, 7:120 />Page 6 of 9
(page number not for citation purposes)
Morphometric analysis of small and medium airways following chronic exposure to saline (open) or OVA (closed)Figure 5
Morphometric analysis of small and medium airways following chronic exposure to saline (open) or OVA (closed). Morpho-
metric analysis was performed at 5, 10, 15, 20, 25, 30, and 35 μm band depths. The stain of interest is expressed as a percent-
age of total band area. Open bars – saline exposed animals, Closed bars – ovalbumin exposed animals. A) Small airway α-SMA
staining. B) Medium airway α-SMA staining. C) Small airway Picrosirius Red (PSR) staining. D) Medium airway PSR staining. E)
Small airway fibronectin staining. F) Medium airway fibronectin stainingData are expressed as mean (SEM); 8 mice per group. *
significantly different from corresponding control animals (p < 0.05). ** significantly different from corresponding control ani-
mals (p < 0.01). *** significantly different from corresponding control animals (p < 0.001).
Table 1: Mean differences of percentage stain between saline and allergen exposed animals.
Band Depth (μm)
Stain 5 10 15 20 25 30 35
α-SMA
Small 9.78 (9) 13.09 (5) 13.73 (4) 12.24 (5) 10.56 (6) 9.67 (6) 8.58 (6)
Medium 4.48 (84) 18.35 (6) 26.61 (4) 28.43 (4) 28.41 (4) 26.92 (4) 25.81 (4)
PSR
Small 3.49 (44) 3.52 (34) 3.36 (20) 2.93 (18) 2.65 (14) 2.49 (12) 2.20 (11)
Medium 18.81 (3) 19.97 (3) 20.16 (3) 19.04 (3) 16.38 (3) 14.76 (3) 13.09 (3)
Fibro
Small 6.66 (26) 9.67 (10) 9.59 (8) 9.42 (8) 8.76 (7) 8.16 (7) 7.40 (7)
Medium 16.92 (5) 24.66 (3) 29.55 (3) 30.76 (3) 29.88 (4) 28.79 (4) 27.20 (4)
Numbers in each column are absolute differences between mean values of percentage stain for saline and allergen exposed animals with sample size
requirements for determining allergen induced effects in parenthesis.
α-SMA – α-smooth muscle actin stain
PSR – Picrosirius red stain
Fibro – Fibronectin stain
Respiratory Research 2006, 7:120 />Page 7 of 9
(page number not for citation purposes)
medium airways is arbitrary and that no anatomical dis-
tinction should be inferred. Our division of airways into
small, medium, and large groups is required to address
the question of heterogeneous airway remodeling. Our
findings should therefore be interpreted with this in
mind. Precisely defining the airway size/environment
required for specific remodeling events or the mechanism
underlying these phenomenon was beyond the scope of
this manuscript.
As we have previously established morphometric meth-
ods for evaluating allergen induced effects only in the
large airways[18], we felt it was necessary to extend these
techniques to smaller airways. In addition to demonstrat-
ing that significant allergen induced airway remodeling
occurs in smaller airways, we show that intranasal allergen
exposure results in distinct patterns of remodeling
throughout the entire airway tree. The medium airways
demonstrate the greatest fold increase in remodeling indi-
ces, as compared to the small and large airways. However,
whether or not this is the site of the greatest functional
consequences of airway remodeling is not known. Clearly,
studies aimed at determining the individual contribution
of small, medium, and large airways, as well as the specific
remodeling events in these airways, to airway dysfunction
are required.
We have observed distinct patterns of airway remodeling
in different airway generations. While we have clearly
demonstrated no statistically significant collagen remode-
ling in the small airways, it is likely that allergen induced
changes in fibronectin would have been statistically sig-
nificant with a greater sample size (as indicated in the
Morphometric analysis of collagen content in small, medium, and large airways following chronic exposure to saline (open) or ovalbumin (closed)Figure 7
Morphometric analysis of collagen content in small, medium,
and large airways following chronic exposure to saline (open)
or ovalbumin (closed). Morphometric analysis for small and
medium airways used 10 and 15 μm band depths, respec-
tively. Proximal airways were analyzed as described previ-
ously [18]. A) Large airway PSR staining. B) Medium airway
PSR staining. C) Small airway PSR staining. Representative
histology images for large, medium, and small airways are
located to the right of the figures. Data are expressed as
mean (SEM); 8 mice per group. * significantly different from
corresponding control animals (p < 0.05).
Morphometric analysis of smooth muscle content in small, medium, and large airways following chronic exposure to saline (open) or ovalbumin (closed)Figure 6
Morphometric analysis of smooth muscle content in small,
medium, and large airways following chronic exposure to
saline (open) or ovalbumin (closed). Morphometric analysis
for small and medium airways used 15 and 20 μm band
depths, respectively. Proximal airways were analyzed as
described previously [18]. A) Large airway α-SMA staining.
B) Medium airway α-SMA staining. C) Small airway α-SMA
staining. Representative histology images for large, medium,
and small airways are located to the right of the figures. Data
are expressed as mean (SEM); 8 mice per group. * signifi-
cantly different from corresponding control animals (p <
0.05).
Respiratory Research 2006, 7:120 />Page 8 of 9
(page number not for citation purposes)
Table). This suggests that studies should be powered
according to each of the specific remodeling indices of
interest. Failure to do this may result in Type II statistical
errors and inappropriate interpretation of results.
Animal research ethics boards require strict guidelines for
justifying the number of animals to be used in a given
study. Funding agencies are increasingly interested in
ensuring that studies are appropriately powered to detect
the primary outcome of interest a priori. Our results dem-
onstrate that distinct structural changes occur at different
generations of airways, suggesting that group analysis of
all airway sizes may mask a signal present in a particular
airway size. To appropriately power studies, investigators
should consider the sample size required for analysis of
the specific airway size of interest.
The methods presented herein use a customized digital
image analysis system, that consists of a CCD camera con-
nected to a microscope and a computer. In addition to the
hardware, software capable of detecting user defined col-
our plane settings is required. We feel that using our vali-
dation steps and producing an optimized morphometric
technique could be of importance in other research areas
including kidney fibrosis, gastrointestinal tract inflamma-
tion, and/or vascular biology.
In conclusion we demonstrate that distinct patterns of air-
way remodeling occur in the tracheobronchial tree of
mice following chronic allergen exposure. These results
demonstrate that the pathology observed in one area of
the lung may not be representative of other regions.
Clearly, future studies aimed at exploring structure-func-
tion relationships need to consider the heterogeneity of
airway remodeling throughout the lung.
Funding
Canadian Institutes for Health Research
Acknowledgements
Jennifer Wattie for technical support with animal sensitization and expo-
sure.
References
1. Boulet LP, Chakir J, Dube J, Laprise C, Boutet M, Laviolette M: Air-
way inflammation and structural changes in airway hyper-
responsiveness and asthma: an overview. Can Respir J 1998,
5:16-21.
2. Boulet LP, Turcotte H, Laviolette M, Naud F, Bernier MC, Martel S,
Chakir J: Airway hyperresponsiveness, inflammation, and sub-
epithelial collagen deposition in recently diagnosed versus
long-standing mild asthma. Influence of inhaled corticoster-
oids. Am J Respir Crit Care Med 2000, 162:1308-1313.
3. Fish JE, Peters SP: Airway remodeling and persistent airway
obstruction in asthma. J Allergy Clin Immunol 1999, 104:509-516.
4. Laprise C, Laviolette M, Boutet M, Boulet LP: Asymptomatic air-
way hyperresponsiveness: relationships with airway inflam-
mation and remodelling. Eur Respir J 1999, 14:63-73.
5. Wiggs BR, Bosken C, Pare PD, James A, Hogg JC: A model of air-
way narrowing in asthma and in chronic obstructive pulmo-
nary disease. Am Rev Respir Dis 1992, 145:1251-1258.
6. Jeffery PK, Wardlaw AJ, Nelson FC, Collins JV, Kay AB: Bronchial
biopsies in asthma. An ultrastructural, quantitative study
and correlation with hyperreactivity. Am Rev Respir Dis 1989,
140:1745-1753.
7. Leigh R, Ellis R, Wattie J, Southam DS, De Hoogh M, Gauldie J,
O'Byrne PM, Inman MD: Dysfunction and remodeling of the
mouse airway persist after resolution of acute allergen-
induced airway inflammation. Am J Respir Cell Mol Biol 2002,
27:526-535.
8. Palmans E, Kips JC, Pauwels RA: Prolonged allergen exposure
induces structural airway changes in sensitized rats. Am J
Respir Crit Care Med 2000, 161:627-635.
9. Kraft M: The distal airways: are they important in asthma? Eur
Respir J 1999, 14:1403-1417.
10. Tulic MK, Hamid Q: The role of the distal lung in asthma. Semin
Respir Crit Care Med 2002, 23:347-359.
11. Wagner EM, Bleecker ER, Permutt S, Liu MC: Direct assessment
of small airways reactivity in human subjects. Am J Respir Crit
Care Med 1998, 157:447-452.
12. Weibel ER: Morphometry of the Human Lung. Berlin:, Springer-Verlag.;
1963.
13. Hamid QA: Peripheral inflammation is more important than
central inflammation. Respir Med 1997, 91 Suppl A:11-12.
Morphometric analysis of fibronectin content in small, medium, and large airways following chronic exposure to saline (open) or ovalbumin (closed)Figure 8
Morphometric analysis of fibronectin content in small,
medium, and large airways following chronic exposure to
saline (open) or ovalbumin (closed). Morphometric analysis
for small and medium airways used 10 and 20 μm band
depths, respectively. Proximal airways were analyzed as
described previously [18]. A) Large airway fibronectin stain-
ing. B) Medium airway fibronectin staining. C) Small airway
fibronectin staining. Representative histology images for
large, medium, and small airways are located to the right of
the figures. Data are expressed as mean (SEM); 8 mice per
group. * significantly different from corresponding control
animals (p < 0.05).
Publish with BioMed Central and every
scientist can read your work free of charge
"BioMed Central will be the most significant development for
disseminating the results of biomedical research in our lifetime."
Sir Paul Nurse, Cancer Research UK
Your research papers will be:
available free of charge to the entire biomedical community
peer reviewed and published immediately upon acceptance
cited in PubMed and archived on PubMed Central
yours — you keep the copyright
Submit your manuscript here:
/>BioMedcentral
Respiratory Research 2006, 7:120 />Page 9 of 9
(page number not for citation purposes)
14. Poutler LW: Central inflammation is more important than
peripheral inflammation. Respir Med 1997, 91 Suppl A:9-10.
15. Mead J: The lung's "quiet zone". N Engl J Med 1970,
282:1318-1319.
16. Woolcock AJ, Vincent NJ, Macklem PT: Frequency dependence of
compliance as a test for obstruction in the small airways. J
Clin Invest 1969, 48:1097-1106.
17. Van Brabandt H, Cauberghs M, Verbeken E, Moerman P, Lauweryns
JM, Van de Woestijne KP: Partitioning of pulmonary impedance
in excised human and canine lungs. J Appl Physiol 1983,
55:1733-1742.
18. Ellis R, Leigh R, Southam D, O'Byrne PM, Inman MD: Morphometric
analysis of mouse airways after chronic allergen challenge.
Lab Invest 2003, 83:1285-1291.