Foundations of ASP.NET AJAX phần 10 doc
Bạn đang xem bản rút gọn của tài liệu. Xem và tải ngay bản đầy đủ của tài liệu tại đây (6.61 MB, 35 trang )
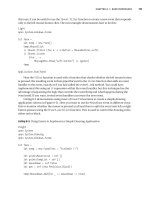
Figure 10-6. Specifying the WSDL
The Company Information web service is used in the application to present the
name of the company as well as the current price information. Now there needs to be a
method called
GetCompanyInfo in which we write the code to use a few of the properties
to get the actual company data. After that, this information needs to be assigned to the
lblQuote control as shown in the following code snippet:
private void GetCompanyInfo(string strTicker)
{
companyInfo.CompanyInfoService service = new
companyInfo.CompanyInfoService();
companyInfo.CompanyInfoResult result = service.doCompanyInfo("anything",
"anything", strTicker);
lblQuote.Text = result.company + "<BR>Current Price: " + result.lastPrice
+ "<BR>Change: " +result.change;
}
This function updates the company information pane as well as the price history text
and graphs. Also, because this is the one piece of information that does not reside within
the tabs, it should be rendered and updated without the user clicking on the individual
tabs. Furthermore, the user should be able to enter a new stock ticker in the main
CHAPTER 10 ■ BUILDING A SAMPLE APPLICATION USING ASP.NET AJAX234
828-8 CH10.qxd 10/11/07 10:47 AM Page 234
TextBox and have the data updated. So to address these points, we need to first call the
GetCompanyInfo method during the Page_Load event and then create a Timer control. In the
control’s
Tick event handler, we call the method shown here:
protected void Page_Load(object sender, EventArgs e)
{
if (!Page.IsPostBack)
{
GetCompanyInfo(txtTicker.Text.Trim());
//Default to first tab
Update(0);
}
}
This way, the ticker information is updated in regular intervals, and if the user enters
a new stock ticker, the changes are reflected as soon as the
GetCompanyInfo method is
called again (in 5 seconds).
To create a timer for this page, drag and drop the ASP.NET AJAX
Timer control from
the Toolbox onto the page, and set its
Interval property to 5000ms, so that the page
updates every 5 seconds. Also, don’t forget to set the event handler for the
Tick event as
shown here:
<asp:Timer ID="Timer1" runat="server" Interval="5000" OnTick=➥
"Timer1_Tick"></asp:Timer>
Lastly, for the timer functionality to work properly, you must call the GetCompanyInfo
method in the Timer1_Tick event handler as such:
protected void Timer1_Tick(object sender, EventArgs e)
{
GetCompanyInfo(txtTicker.Text.Trim());
}
You can view the company information and Quote section on the top of the page for
a specific stock ticker such as MSFT for Microsoft Corporation (see Figure 10-7).
Figure 10-7. The company name and current price information
CHAPTER 10 ■ BUILDING A SAMPLE APPLICATION USING ASP.NET AJAX 235
828-8 CH10.qxd 10/11/07 10:47 AM Page 235
With the brief quote information on top of the page, we need to create the more
extended quote information in the first tab. This extended price information includes the
bid and ask prices. These are, respectively, the current price that is being bid on the stock
by prospective buyers and the one that is being asked for by sellers. When you make a
purchase at the current market price, it is usually between these two values, provided you
are buying a large amount of shares in the stock. It also provides the opening price for the
day, as well as the year’s (52 weeks) high and low.
Now let’s take a look at the code that implements this. First, create a new
TabPanel
control with one ASP.NET Label control in the <ContentTemplate> section. The following
code snippet shows the markup for that section:
<cc1:TabPanel ID="TabPanel1" runat="server" HeaderText="TabPanel1">
<HeaderTemplate>
Basic Quote
</HeaderTemplate>
<ContentTemplate>
<asp:Label ID="lblBasicQuote" runat="server"></asp:Label>
</ContentTemplate>
</cc1:TabPanel>
As you can imagine, much of the implementation logic is going to be in content
generation for the
lblBasicQuote Label control because that is where all the quote infor-
mation will reside. To do this, we have a method with a similar signature to the
GetCompanyInfo method called GetBasicCode, which calls the CompanyInfoService web
service to provide data for this
Label control. Here’s the code for that method:
private string GetBasicQuote(string strTicker)
{
companyInfo.CompanyInfoService service = new
companyInfo.CompanyInfoService();
companyInfo.CompanyInfoResult result =
service.doCompanyInfo("UID", "PWD", strTicker);
StringBuilder theHTML = new StringBuilder();
theHTML.Append("<table width='100%' cellspacing='0'
cellpadding='0' style='border-width: 0'>");
theHTML.Append("<tr><td width='40%'>");
theHTML.Append("Bid ");
theHTML.Append("</td><td width='40%'>");
theHTML.Append(result.bid);
theHTML.Append("</td></tr>");
theHTML.Append("<tr><td width='40%'>");
theHTML.Append("Ask ");
theHTML.Append("</td><td width='40%'>");
CHAPTER 10 ■ BUILDING A SAMPLE APPLICATION USING ASP.NET AJAX236
828-8 CH10.qxd 10/11/07 10:47 AM Page 236
theHTML.Append(result.ask);
theHTML.Append("</td></tr>");
theHTML.Append("<tr><td width='40%'>");
theHTML.Append("Open ");
theHTML.Append("</td><td width='40%'>");
theHTML.Append(result.open);
theHTML.Append("</td></tr>");
theHTML.Append("<tr><td width='40%'>");
theHTML.Append("Year High ");
theHTML.Append("</td><td width='40%'>");
theHTML.Append(result.yearHigh);
theHTML.Append("</td></tr>");
theHTML.Append("<tr><td width='40%'>");
theHTML.Append("Year Low ");
theHTML.Append("</td><td width='40%'>");
theHTML.Append(result.yearLow);
theHTML.Append("</td></tr>");
theHTML.Append("</table>");
return theHTML.ToString();
}
This function is similar to what you saw earlier in that it creates an instance of the
proxy to the
Flash-db.com web service and an instance of the object type that contains the
results to the
doCompanyInfo() web method call. It then generates HTML for a table using
a
StringBuilder and places this HTML into the Text property of the Label control. Obvi-
ously, populating a
Label control is not the most ideal way to represent some data on the
screen, but it suffices just fine for the purposes of this sample. In such scenarios, it’s best
to bind a typed data structure to one of the more sophisticated ASP.NET data-bound con-
trols, such as
GridView or DataList.
The proxy to the
Flash-db.com web service is called CompanyInfoService. An instance
of this proxy is first created, called
svc. This exposes an object of type CompanyInfoResult,
which is used to store the returned information from the service. The second line creates
an instance of this type, called
rslt, into which the results of a doCompanyInfo web method
call are loaded. This web method takes three parameters; the first two are username and
password. The web service is open, so you can put anything in for the username and
password parameters. The third parameter is the ticker for which you are seeking the
company information.
The company name
(result.company) is then appended to a string containing text
(Current Price:), which in turn is appended to the last traded price for the stock
(result.lastPrice). You can see this in Figure 10-8.
CHAPTER 10 ■ BUILDING A SAMPLE APPLICATION USING ASP.NET AJAX 237
828-8 CH10.qxd 10/11/07 10:47 AM Page 237
Figure 10-8. Extended quote information in the first tab pane
Creating the Price History Pane
The price history pane renders the 20-day price history (the closing price for the stock over
the past 20 days) in a simple text table. Of course, the number 20 is completely an arbitrary
number. You could really configure it to be any number of days you want so long as histori-
cal data is available for that particular ticker. After we get the data for this period, a
GridView
control is used to display the information. You can see this in Figure 10-9.
Figure 10-9. The price history pane
CHAPTER 10 ■ BUILDING A SAMPLE APPLICATION USING ASP.NET AJAX238
828-8 CH10.qxd 10/11/07 10:47 AM Page 238
This information is ultimately sourced from Yahoo! as CSV over HTTP. This CSV file is
returned from a call to the iFinance server at Yahoo! using a URL call similar this:
/>&e=4&f=2007&g=d&a=2&b=1&c=2006&ignore=.csv
This returns a CSV file with the following format:
Date,Open,High,Low,Close,Volume,Adj. Close*
3-Mar-06,26.81,27.16,26.74,26.93,45218800,26.93
2-Mar-06,27.02,27.10,26.90,26.97,41850300,26.97
1-Mar-06,26.98,27.20,26.95,27.14,53061200,27.14
Each data item is separated by a comma, and each line is separated by a carriage
return. To make this data easier to consume by the data retrieval and business logic tiers,
a web service consumes this HTTP service and exposes it as a structured
DataTable. You’ll
see this in the next section.
Creating the Wrapper Web Service
This web service provides a web method that makes a call to the Yahoo! iFinance server
on your behalf, takes the CSV that is returned from it, and serializes it as a
DataTable. It is
designed to be consumed by a .NET-based client, so using a
DataTable object works
nicely. If you want to expose a web service that is easily interoperable with other plat-
forms, you should serialize the returned data using straight XML that can be parsed on
the client side. To do that, we have a web method called
GetFullPriceHistory, which takes
in a stock ticker and an integer value representing the number of days. Here is the code
for this web method:
[WebMethod]
public DataTable GetFullPriceHistory(string strTicker, int nDays)
{
WebClient client = new WebClient();
StringBuilder strURI = new
StringBuilder(" />strURI.Append(strTicker);
strURI.Append("&d=1&e=22&f=2007&g=d&a=8&b=28&c=1997&ignore=.csv");
Stream data = client.OpenRead(strURI.ToString());
StreamReader reader = new StreamReader(data);
string s = reader.ReadToEnd();
CHAPTER 10 ■ BUILDING A SAMPLE APPLICATION USING ASP.NET AJAX 239
828-8 CH10.qxd 10/11/07 10:47 AM Page 239
DataTable theTable = CsvParser.Parse(s);
if (nDays > 0)
{
int i = nDays + 1;
while (theTable.Rows.Count > i)
{
theTable.Rows.RemoveAt(i);
}
}
data.Close();
reader.Close();
return theTable;
}
This makes the connection to the Yahoo! server to fetch historical data of about 10
years by using an object derived from the
WebClient class, which is defined in the
System.Net namespace. To use this, you use its OpenRead method, which is pointed at a
URI. This returns a stream, which can be read by a
StreamReader. The contents of this can
be parsed into a string using a
CsvParser abstract helper class.
This helper class provides the parsing functionality that reads the CSV information
and returns it as a
DataTable. The Source Code/Download area of the Apress web site
(
www.apress.com) includes a version of this class that was derived from one published in
the excellent blog from Andreas Knab at
/>The call to the Yahoo! iFinance server provides the entire price history for the stock,
which can be thousands of days’ worth of information. It provides an additional layer
that allows you to crop this data to the specified number of days by iterating through the
DataTable and removing rows beyond what you are interested in. So if you want to pull 10
days’ worth of data, you can modify the query to Yahoo! iFinance accordingly or simply
remove all rows beyond number 10.
That’s about it. This web method is present in a web service called
DataTier.
Consuming the Web Service
As mentioned earlier, an ASP.NET GridView control will be used to display the historical
price data. So, in the
<ContentTemplate> section of the second TabPanel, add a GridView
control named grdPriceHistory, and change a few properties as shown in the following
markup:
<asp:GridView ShowHeader=False ID="grdPriceHistory" runat="server" BackColor=➥
"White" BorderColor="#CCCCCC" BorderStyle="None" BorderWidth="1px" CellPadding="3"
Height="119px" Width="470px" Font-Size="9pt">
<RowStyle ForeColor="#000066" />
CHAPTER 10 ■ BUILDING A SAMPLE APPLICATION USING ASP.NET AJAX240
828-8 CH10.qxd 10/11/07 10:47 AM Page 240
<SelectedRowStyle BackColor="#669999" Font-Bold="True" ForeColor="White" />
<PagerStyle BackColor="White" ForeColor="#000066" HorizontalAlign="Left" />
</asp:GridView>
Figure 10-10 shows the design for the price history pane.
Figure 10-10. Designing the price history pane
With the
GridView control in place, we need a helper method to populate the GridView
with the historical price information obtained from the web service. So similarly to previ-
ous methods on this page, create a method called
GetPriceHistory as shown here:
private void GetPriceHistory(string strTicker)
{
DataTier data = new DataTier();
DataTable priceData = data.GetFullPriceHistory(strTicker, 20);
grdPriceHistory.DataSource = priceData;
grdPriceHistory.DataBind();
}
Here we just instantiate the data tier and invoke the GetFullPriceHistory web
method, passing the stock ticker and the number of days for which we would like price
history. After that, the
DataSource and DataBind properties of the GridView are used to
display the data.
Creating the Charts & Analytics Pane
You are no doubt familiar with seeing price history graphs on business TV shows on CNN
or the Bloomberg channel. Figure 10-11 and Figure 10-12 show the price history charts
for companies such as Microsoft (MSFT) and Starbucks (SBUX) for the past 100 days.
CHAPTER 10 ■ BUILDING A SAMPLE APPLICATION USING ASP.NET AJAX 241
828-8 CH10.qxd 10/11/07 10:47 AM Page 241
Figure 10-11. The 100-day price history for MSFT
Figure 10-12. The 100-day price history for SBUX
CHAPTER 10 ■ BUILDING A SAMPLE APPLICATION USING ASP.NET AJAX242
828-8 CH10.qxd 10/11/07 10:47 AM Page 242
These charts are useful in determining where a stock is going, its recent trends, and
its long-time trends. Many stocks move between high values and low values in what
sometimes looks like a sine wave; this is typically called its trading envelope. This is
apparent in Figure 10-11, which shows a cycle from 26 to 28 indicating that March 2007
had been a good point to purchase the stock on a short-term basis because it is at the
lower end of the trading envelope. This is no guarantee that the stock will not break from
the trading envelope and fall far below 26. Also, typically when a stock breaks from its
trading envelope, it tends to move quickly outside the trading range, which can lead to
the stock rocketing either upward or downward. A more reliable methodology for using
price history analysis is to use the Bollinger band method, which you’ll see a bit later.
But, let’s get back to the technology—how is this implemented?
The resource and data retrieval tiers are the same as for the text-based price history
pane you saw previously. If you’ve skipped ahead, you should return to the “Creating the
Price History Pane” section, which describes the
DataTier web service and how you can
use it to retrieve the price history of a stock.
To implement the charts, the example uses the ZedGraph open source library.
Using the ZedGraph Library Charting Engine
ZedGraph () is an open source set of classes, written in C#, that enable
the creation of various 2D graphs of arbitrary datasets. Because the set is class-based, it has
a high degree of programmatic flexibility, and you can modify almost every aspect of a
graph, including features such as scale ranges, scale types, step sizes, and so on, to be over-
ridden from their defaults. It also allows for multirange, multitype, multiaxis graphs to be
overlaid in a single chart. See Figure 10-13 for an example of a single chart that includes
stacked bars, transparent overlays, filled lines, legends, and annotations.
Figure 10-13. Sample ZedGraph chart
CHAPTER 10 ■ BUILDING A SAMPLE APPLICATION USING ASP.NET AJAX 243
828-8 CH10.qxd 10/11/07 10:47 AM Page 243
As such, ZedGraph makes an excellent choice for use in an ASP.NET AJAX-based proj-
ect and is easy to implement in your applications. You simply make a reference to the
ZedGraph.DLL in your solution and add the ZedGraph tools to your Toolbox in the stan-
dard way.
Drawing the Price History Graph with ZedGraph
To implement the price history graph, you can use a new web form. The Source
Code/Download area on the Apress web site (
www.apress.com) contains the web form
in a file called PH.aspx. This web form contains a single
ZedGraph control.
When you place a
ZedGraph control from your Toolbox onto a web form, it draws the
default chart you saw in Figure 10-13. You can see the PH.aspx page in the web form
designer in Figure 10-14.
Figure 10-14. Placing the
ZedGraph on a web form
The
ZedGraph control fires an event upon rendering, which occurs when the page is
loaded or refreshed. This event is called
RenderGraph.
In this case, the page is going to take two parameters, one for the ticker of the stock
to be rendered and the other for the number of days to render. These are used to make a
call to the
DataTier web service to get the DataTable back. The DataTable then loads the
graph with the appropriate data.
CHAPTER 10 ■ BUILDING A SAMPLE APPLICATION USING ASP.NET AJAX244
828-8 CH10.qxd 10/11/07 10:47 AM Page 244
The following code segment shows the full code for the ZedGraphWeb1_RenderGraph
event handler:
protected void ZedGraphWeb1_RenderGraph(
System.Drawing.Graphics g, ZedGraph.MasterPane mPane)
{
int nDays = 0;
int nRows = 0;
GraphPane pane = mPane[0];
PointPairList pt = new PointPairList();
double nx;
double ny;
string days = (string)Page.Request.Params["days"];
string ticker = (string)Page.Request.Params["ticker"];
if (ticker != null)
{
ticker = ticker.Trim();
DataTier theDataTier = new DataTier();
if (days == null)
nDays = 0;
else
nDays = Convert.ToInt32(days);
DataTable dtTable =
theDataTier.GetFullPriceHistory(ticker,nDays);
nRows = dtTable.Rows.Count;
for (int i = 1; i < nRows; i++)
{
ny = Convert.ToDouble(dtTable.Rows[i].ItemArray[1]);
XDate tmpDate = new XDate(
Convert.ToDateTime(dtTable.Rows[i].ItemArray[0]));
nx = (double)tmpDate;
pt.Add(nx, ny);
}
pane.XAxis.Type = AxisType.Date;
pane.XAxis.GridDashOff = 0;
LineItem priceCurve = pane.AddCurve(
"Closing Price", pt, Color.SlateBlue,
CHAPTER 10 ■ BUILDING A SAMPLE APPLICATION USING ASP.NET AJAX 245
828-8 CH10.qxd 10/11/07 10:47 AM Page 245
SymbolType.None);
priceCurve.Line.Width = 2.0F;
pane.AxisFill = new Fill(Color.White, Color.AntiqueWhite);
pane.XAxis.MinGrace = 0;
pane.XAxis.MaxGrace = 0;
pane.YAxis.MinGrace = 0;
pane.YAxis.MaxGrace = 0;
pane.AxisChange(g);
}
}
This event handler takes two parameters. The first is the base System.Drawing.
Graphics object. To render the graph, right at the bottom of the event handler, the
System.Drawing.Graphics object is passed to the AxisChange method of a ZedGraph pane
to refresh and redraw the graph. The second parameter is a reference to the ZedGraph
master pane, which is the collection of drawing surfaces that the ZedGraph exposes.
Check out the ZedGraph documentation for information about how to use the panes to
create different drawing surfaces. This graph is a simple line chart that uses only one
pane, which is the one at the zero index of this collection.
You refer to the pane with this line:
GraphPane pane = mPane[0];
The subsequent graphical operations are then performed on this pane object.
To draw a line curve, you should use the
PointPairList collection that the ZedGraph
library provides. This allows you to create a single collection of data items that corre-
spond to the
X and Y values of a chart. The PointPairList supports many data types,
including dates, so it’s perfect for the example’s needs.
After the input parameters (ticker and days) have been read in and sanitized, the
DataTier service is called to return a DataTable containing the results of the query for that
stock and the number of days of price history you want for it.
You then iterate through the
DataTable and pull this information out like this:
for (int i = 1; i < nRows; i++)
{
ny = Convert.ToDouble(dtTable.Rows[i].ItemArray[1]);
XDate tmpDate = new XDate(
Convert.ToDateTime(dtTable.Rows[i].ItemArray[0]));
nx = (double)tmpDate;
pt.Add(nx, ny);
}
CHAPTER 10 ■ BUILDING A SAMPLE APPLICATION USING ASP.NET AJAX246
828-8 CH10.qxd 10/11/07 10:47 AM Page 246
The closing price for the stock should go on the y axis, so it comes from .ItemArray[1]
and is converted to a Double value. The original source from Yahoo! and the column on
the
DataTable encode the value as a string. This is retrieved and loaded into the ny
variable.
The date for the closing price should go onto the x axis. This uses the
XDate class (also
part of the ZedGraph library), which is the data type used by ZedGraph to store dates in
a chart and automatically generate axes from them. When using a
PointPairList, you
encode the
XDate into a Double. You can see this being encoded in the variable nx.
Finally, you add the values for
nx and ny to the PointPairList (called pt).
To finalize drawing the chart, you load the
PointPairList, set the visual configuration
of the chart, and call the
AxisChange method, which refreshes it. First set the XAxis to be
date encoded so that it recognizes the
Doubles as dates:
pane.XAxis.Type = AxisType.Date;
Then load the PointPairList onto the chart. You do this using the AddCurve method
of the pane. This method takes four parameters. The first is a string with the name of the
data range. In this case, it is
Closing Price. If you were superimposing data ranges on the
chart (as shown later in Figure 10-15), you would give them their distinct names here.
The second parameter is the
PointPairList. The third is the color for this range, which in
this case is
Color.SlateBlue, and the final parameter is the SymbolType used to indicate a
point on the line. If you refer to Figure 10-14, you’ll see that some points are indicated
with triangles or diamonds. You specify these here. Because the graph has a lot of points
that would cause it to look cluttered, you won’t use a symbol type for this example.
LineItem priceCurve =
pane.AddCurve("Closing Price", pt,
Color.SlateBlue, SymbolType.None);
Next, set the line width to 2 pixels to make the chart stand out a little more clearly,
and fill the background for the pane with a graded fill between white and antique white:
priceCurve.Line.Width = 2.0F;
pane.AxisFill = new Fill(Color.White, Color.AntiqueWhite);
Finally, call the AxisChange event to render the graph:
pane.AxisChange(g);
CHAPTER 10 ■ BUILDING A SAMPLE APPLICATION USING ASP.NET AJAX 247
828-8 CH10.qxd 10/11/07 10:47 AM Page 247
Rendering the Charts within the TabPanel
For rendering the chart, we simply create a server side ASP.NET Image control,
imgPriceHistory within the <ContentTemplate> of the third TabPanel, and set the ImageUrl
property of the Image control to the corresponding PH.aspx page. This should all be done
in an asynchronous manner because all these controls reside within an
UpdatePanel con-
trol (as discussed later). Here’s the markup:
<cc1:TabPanel ID="TabPanel3" runat="server" HeaderText="TabPanel3">
<HeaderTemplate>
Charts & Analytics
</HeaderTemplate>
<ContentTemplate>
<table width="400" cellspacing="0" cellpadding="0" style="border-
width: 0">
<tr>
<td style="background-color: #1077ad"><span class="style2">
Price History Graph</span></td>
</tr>
<tr>
<td><asp:Image ID="imgPriceHistory" Width="800px" Height="400px"➥
runat="server" />
</td>
</tr>
</table>
</ContentTemplate>
< /cc1:TabPanel >
The graph is then generated by the PH.aspx page and set as the source of the
imgPriceHistory Image control to be rendered within the body of the TabPanel. Also to
ensure a consistent image size, dimensions of 800 x 400 are specified for the image. As
expected, another helper method is needed to programmatically do just that; we can call
this one
GetAnalytics and have the same signature as the previous helper methods used
here. Here’s the code for that method:
private void GetAnalytics(string strTicker)
{
imgPriceHistory.ImageUrl = "PH.aspx?ticker=" + strTicker + "&days=100";
}
Once again, this just sets the source of the Image control here to the image generated
from PH.aspx. This includes the ticker that had been entered in the text box, and the
CHAPTER 10 ■ BUILDING A SAMPLE APPLICATION USING ASP.NET AJAX248
828-8 CH10.qxd 10/11/07 10:47 AM Page 248
“days=100” are also passed onto the PH.aspx page, which results in the price history chart
you saw earlier in Figure 10-11 and Figure 10-12.
Generating an Analytics Graph
A methodology for determining good buy and sell prices for a stock comes from a techni-
cal analysis of the stock’s trading envelope through the use of Bollinger bands. These
bands are based on a calculation of the moving average of the stock—the moving average
being the average price of the stock over a number of periods preceding the current one.
For example, a 30-day moving average on any day is the average of closing prices for the
stock over the previous 30-day period. Thus, today’s average is slightly different from yes-
terday’s, which is slightly different from the day before; hence, it’s called a moving
average.
Bollinger bands are calculated from this value. The “upper” band is the average over
the preceding period plus two times the standard deviation. The “lower” band is the aver-
age over the preceding period minus two times the standard deviation. Figure 10-15 and
Figure 10-16 show the price history overlaid with Bollinger bands for MSFT and SBUX.
Figure 10-15. Bollinger bands for MSFT over 100 days
CHAPTER 10 ■ BUILDING A SAMPLE APPLICATION USING ASP.NET AJAX 249
828-8 CH10.qxd 10/11/07 10:47 AM Page 249
Figure 10-16. Bollinger bands for SBUX over 100 days
These bands are sometimes used to predict the value of a stock based on a projection
of its future value based on its past behavior. A typical rule is to buy the stock when it
penetrates the lower band moving upward or when it “bounces off” the lower band, and
to sell it when it penetrates the upper band moving downward or when it bounces off the
upper band.
Using Bollinger bands is considered a useful analytical methodology for assessing
the value of a stock, and as such this application includes a Bollinger band graph.
As for implementation, it’s identical to that used for the price history graph. A web
form called PHBB.aspx hosts a ZedGraph control. This form accepts the stock ticker and
number of days parameters in the same manner as earlier. Instead of adding a single
curve to the chart, you add three curves: the price history, the upper Bollinger band,
and the lower Bollinger band. Here’s the code that generates the Bollinger bands:
protected void ZedGraphWeb1_RenderGraph(System.Drawing.Graphics g,
ZedGraph.MasterPane mPane)
{
int nDays = 0;
int nRows = 0;
GraphPane pane = mPane[0];
string days = (string)Page.Request.Params["days"];
string ticker = (string)Page.Request.Params["ticker"];
CHAPTER 10 ■ BUILDING A SAMPLE APPLICATION USING ASP.NET AJAX250
828-8 CH10.qxd 10/11/07 10:47 AM Page 250
if (ticker != null)
{
ticker = ticker.Trim();
DataTier theDataTier = new DataTier();
if (days == null)
nDays = 0;
else
nDays = Convert.ToInt32(days);
DataTable dtTable = theDataTier.GetFullPriceHistory(ticker, nDays);
nRows = dtTable.Rows.Count;
double[] nx = new double[nRows-1];
double[] ny = new double[nRows-1];
double[] bbh = new double[nRows-1];
double[] bbl = new double[nRows-1];
double[] pht = new double[20];
int nIndex = 0;
for (int i = nRows-1; i > 0; i )
{
ny[nIndex] = Convert.ToDouble(dtTable.Rows[i].ItemArray[1]);
XDate tmpDate = new
XDate(Convert.ToDateTime(dtTable.Rows[i].ItemArray[0]));
nx[nIndex] = (double)tmpDate;
if (nIndex > 20)
{
int x = 0;
for (int n = nIndex - 20; n < nIndex; n++)
{
pht[x] = ny[n];
x++;
}
bbh[nIndex] = GetAverage(pht)
+ (2 * GetStandardDeviation(pht));
bbl[nIndex] = GetAverage(pht)
- (2 * GetStandardDeviation(pht));
}
else
{
bbh[nIndex] = ny[nIndex];
bbl[nIndex] = ny[nIndex];
}
CHAPTER 10 ■ BUILDING A SAMPLE APPLICATION USING ASP.NET AJAX 251
828-8 CH10.qxd 10/11/07 10:47 AM Page 251
nIndex++;
}
pane.XAxis.Type = AxisType.Date;
pane.XAxis.GridDashOff = 0;
pane.AddCurve("Closing Price", nx,
ny, Color.SlateBlue, SymbolType.None);
pane.AddCurve("High BB", nx,
bbh, Color.Red, SymbolType.None);
pane.AddCurve("Low BB", nx,
bbl, Color.Red, SymbolType.None);
pane.AxisFill = new Fill(Color.White, Color.AntiqueWhite);
Axis.Default.MinGrace = 0;
Axis.Default.MaxGrace = 0;
pane.AxisChange(g);
}
The GetAverage and GetStandardDeviation helper functions that the application uses
are as follows:
public double GetAverage(double[] num)
{
double sum = 0.0;
for (int i = 0; i < num.Length; i++)
{
sum += num[i];
}
double avg = sum / System.Convert.ToDouble(num.Length);
return avg;
}
public double GetStandardDeviation(double[] num)
{
double Sum = 0.0, SumOfSqrs = 0.0;
for (int i = 0; i < num.Length; i++)
{
Sum += num[i];
SumOfSqrs += Math.Pow(num[i], 2);
}
CHAPTER 10 ■ BUILDING A SAMPLE APPLICATION USING ASP.NET AJAX252
828-8 CH10.qxd 10/11/07 10:47 AM Page 252
double topSum = (num.Length * SumOfSqrs) - (Math.Pow(Sum, 2));
double n = (double)num.Length;
return Math.Sqrt(topSum / (n * (n - 1)));
}
To display this in the Analytics pane directly below the price history chart, an exten-
sion is made to the
<ContentTemplate> of the third TabPanel with the following markup:
<table width="400" cellspacing="0" cellpadding="0" style="border-width: 0">
<tr>
<td style="background-color: #1077AD; height: 5px;">➥
<span class="style2">Bollinger Band Analytics➥
</span></td>
</tr>
<tr>
<td>
<asp:Image ID="imgAnalyticGraph" Width="800px" Height="400px"
runat="server" />
</td>
</tr>
</table>
Nothing new here, just like the previous chart, an ASP.NET Image control,
imgAnalyticGraph, is created to act as a placeholder for the Bollinger band chart generated
by the PHBB.aspx page. This
Image control must be accompanied by an additional line of
C# code in the
GetAnalytics method in the code behind:
imgAnalyticGraph.ImageUrl = "PHBB.aspx?ticker=" + strTicker + "&days=100";
And with that, the Bollinger band is integrated into the Analytics pane just like the
price history chart. Lastly, let’s looks at the most important and yet simple part of this
sample, AJAXifying the form so that all updates occur without doing any page refresh.
Applying ASP.NET AJAX
By now, you know that the easiest and fastest way to add AJAX functionality to an existing
ASP.NET application is to use the ASP.NET AJAX server controls, mainly the
UpdatePanel.
For the purposes of this chapter, we assume that the project itself has already been
ASP.NET AJAX-enabled, and the appropriate changes have been made to the Web.Config
file as shown in the earlier chapters.
As you know all too well, if you have not created an AJAX-enabled ASP.NET web
site/project, the very first step before the addition of any ASP.NET AJAX server controls is
CHAPTER 10 ■ BUILDING A SAMPLE APPLICATION USING ASP.NET AJAX 253
828-8 CH10.qxd 10/11/07 10:47 AM Page 253
to add a ScriptManager component to the page, which you can do by either dragging and
dropping the component from the Toolbox or simply adding the markup to the page:
<asp:ScriptManager ID="ScriptManager1" runat="server"> </asp:ScriptManager>
Because most of the markup for this project resides in the TabContainer control,
we can easily encapsulate almost the entire application in the
ContentTemplate of the
UpdatePanel control without even having to create manual triggers. To do so, create an
UpdatePanel control right before the markup for the Timer control. This would also be
before the stock ticker
TextBox.
<asp:UpdatePanel ID="UpdatePanel1" runat="server">
<ContentTemplate>
<asp:Timer ID="Timer1" runat="server" Interval="5000" OnTick=➥
"Timer1_Tick"></asp:Timer>
<table width="100%" cellpadding="2" style="border-width: 0">
<tr>
<td style="width: 117px" class="style1"><b>Stock Ticker</b></td>
<td style="width: 133px">
<asp:TextBox ID="txtTicker" runat="server" MaxLength="4" >➥
MSFT</asp:TextBox>
</ContentTemplate>
</asp:UpdatePanel>
With that simple addition, we have added AJAX capabilities to this application, and
the page will not blink as it obtains data and renders the updates.
You can see that there is no explicit coding for a partial-page update for all content,
including price information and analytic charts. Everything is handled under the hood
by the ASP.NET AJAX runtime. You concentrate on building your application, and by
wrapping standard ASP.NET controls with an
UpdatePanel, you can enable the asynchro-
nous functionality.
One last item to complete is a way of notifying the user when the page is being
updated. Because all updates are done asynchronously with no page refresh, the user
may be confused at times during page updates when nothing is happening. Just like an
UpdatePanel, you can create this either from the left Toolbox or by manually typing the
markup as shown here:
<asp:UpdateProgress runat="server" ID="prog1" DisplayAfter="300"➥
AssociatedUpdatePanelID="UpdatePanel1">
<ProgressTemplate>
<span style="color: #ffff00; background-color: #3300ff">
Loading </span>
</ProgressTemplate>
</asp:UpdateProgress>
CHAPTER 10 ■ BUILDING A SAMPLE APPLICATION USING ASP.NET AJAX254
828-8 CH10.qxd 10/11/07 10:47 AM Page 254
This can be placed just about anywhere within the page, but in this case, we have it
as one of the first elements in the
UpdatePanel. The DisplayAfter property is set to 300 so
that the
UpdateProgress renders 300 milliseconds after a postback. Because we have only
one
UpdatePanel on this page, setting the AssociatedUpdatePanelID property isn’t required
but is usually a good practice to do so anyway as done here. Also quite often, a circular
animating GIF image is used to show updates taking place as used in some of the earlier
chapters. In this case, however, we are simply specifying “Loading…” with bright yellow
colors and a blue background. Figure 10-17 shows
UpdateProgress in action.
Figure 10-17.
UpdateProgress used to notify users during asynchronous updates
Summary
This chapter covered a typical real-world ASP.NET application and showed how you
could drastically enhance it using the ASP.NET AJAX server and client libraries. It demon-
strated a logical n-tier architecture, with diverse resource tiers exposed via web services;
a data retrieval layer that abstracted the complexity of talking to the resources; a business
logic tier that applied business logic such as the calculation of financial analytics; and a
presentation tier that implemented the presentation logic. The code that was written to
implement this functionality was straight ASP.NET and C#.
You then enhanced this application using ASP.NET AJAX server-side controls. You
used
UpdatePanel controls to wrap the various page panes that get updated to provide
partial asynchronous page updates. A button on the page provided a drill down into
some more advanced analytics of the historical stock ticker data, which demonstrated
how you could add an update to the page without triggering a full-page refresh and the
associated “blink.”
CHAPTER 10 ■ BUILDING A SAMPLE APPLICATION USING ASP.NET AJAX 255
828-8 CH10.qxd 10/11/07 10:47 AM Page 255
The example showed how to embed graphics—generated using a third-party control,
the open source
ZedGraph—within the page by hosting them on external pages and gener-
ating the HTML markup that would reference them on the main page. This HTML was
embedded within an
UpdatePanel, so again it didn’t cause a full-page refresh when the
graphic was downloaded and rendered on the page.
The example implemented two graphics: first, a basic line graph containing the price
history of the stock, and second, a compound line graph containing three lines (the price
history, the lower Bollinger band, and the upper Bollinger band).
With that, this book comes to an end. I hope you have enjoyed learning about the
Foundations of ASP.NET AJAX, including a tour of some of the basic principles in devel-
oping AJAX-style applications and the unique and powerful approach to this that
ASP.NET AJAX gives you. You looked through how JavaScript has become object oriented
when using ASP.NET AJAX client libraries; how to use server-side controls that empower
asynchronous functionality with as little intrusion on your existing code as possible; and
how to use the various value-added controls and extensions in the ASP.NET AJAX Control
Toolkit for a better UI. You also learned how to use the Virtual Earth SDK to add powerful
AJAX style mapping functionality to your web applications. Finally, in this chapter, you
looked at a real-world application and how you would implement it as an AJAX applica-
tion quickly, simply, and powerfully using ASP.NET AJAX.
CHAPTER 10 ■ BUILDING A SAMPLE APPLICATION USING ASP.NET AJAX256
828-8 CH10.qxd 10/11/07 10:47 AM Page 256
<%@ WebService %> attribute, 53
4WD property, 43
A
abstractMethod property, 46
AcceptAMPM property
MaskedEdit extender, 175
MaskedEditValidator control, 177
AcceptNegative property, 175
Accordion control, 133–135
AccordionPane control, 133–135
<AccordionPane> tag, 134
ActiveTabChanged event, 230, 231
ActiveTabChanged property, 202
ActiveTabIndex property, 202
add method, 56
Add Reference button, 233
addComponent method, 69
AddControl method, 208
addCssClass method, 72
AddCurve method, 247
addHandler method, 75, 77
$addHandler shortcut, 77
addHandlers method, 75
$addHandlers shortcut, 77
AddPin function, 223
AddPolygon method, 208
AddPolyline method, 208
AddPushpin method, 208
AddPushPin method, 223
addRange method, 56
AddShape method, 208
Aerial(a) type, 219
AJAX, 1, 16–17, 29
applications
coding, 40–41
creating, 32–34
running, 40–41
ASP.NET 2.0, 23
AJAX Extensions, 28–29
server controls, 17
JSON, 28
Microsoft AJAX Library
overview, 26–27
web services, 27
overview, 7–10
Script Manager server control, 37–38
synchronous versus asynchronous
web applications, 24
XMLHttpRequest object, 10–11
AJAX core classes, 41
AJAX Library. See Microsoft AJAX Library
AJAXBook namespace, 36, 41, 44
AJAXBook.Car object, 43
AJAXBook.Car.registerClass method, 43
AJAXBook.IStickShift.isImplementedBy( )
method, 49
AJAXBook.js, 35
AJAXBook.SUV class, 44
AjaxControlToolkit.dll, 132
AjaxToolKit, 132
AllowPaging property, 120
AllowReorder property, 192
AllowSorting property, 120
altKey parameter, 76
AlwaysVisibleControlExtender control,
135–136
animation
discrete, 144
fade, 138–140
length, 140–142
Animation control, 137
AnimationExtender control, 137–144
discrete animation, 144
fade animation, 138–140
length animation, 140–142
AnimationTarget property, 141
App_Data folder, 32
append method, 79
appendLine method, 79
Application class, 67, 68
ApplicationLoadEventArgs class, 67
argument method, 60
argumentNull method, 60
argumentOutOfRange method, 60
argumentType method, 60
argumentUndefined method, 60
Array extension, 55–58
.asmx file, 53
<asp:AsyncPostBackTrigger> trigger, 111,
120
<asp:BoundField> tag, 120
<asp:Calendar> tag, 21
Index
257
828-8 Index.qxd 10/14/07 12:25 PM Page 257
<asp:CheckBoxField> tag, 120
<asp:CommandField> tag, 120
<asp:Image> control, 141
ASP.NET 2.0
AJAX Extension 1.0
downloading, 32
installing, 32
AJAX Extensions, 28–29
server controls, 17–23
ASP.NET AJAX. See also ASP.NET AJAX
client libraries
architecture, 25–29
Extensions, 28–29
JSON, 28
Microsoft AJAX Library, 26–27
financial research application, 225–256
application architecture, 226–228
applying ASP.NET AJAX, 253–255
charts & analytics pane, 241–253
company and quote information,
232–237
price history pane, 238–241
server controls, 81–109, 129
ScriptManager control, 83–89
ScriptManagerProxy control, 90–95
task list managers, 115–129
Timer control, 105–107, 109–115
UpdatePanel control, 95, 102,
109–115
UpdateProgress control, 102–105,
109–115
using in Visual Studio 2005, 81–82
ASP.NET AJAX client libraries, 55–80
global shortcuts, 77
JavaScript type extensions, 55–66
Array extension, 55–58
Boolean extension, 55–58
Date extensions, 58–59
Error extensions, 59–61
Number extension, 61–63
Object extension, 63–64
String extension, 64–66
overview, 55
Sys namespace, 66–71
Sys.Application class, 67–69
Sys.Component class, 70–71
System.ComponentModel.Compo
nent class, 70–71
Sys.UI namespace, 71–77
Sys.UI.DomElement class, 72–74
Sys.UI.DomEvent, 75–77
ASP.NET AJAX Control ToolKit, 131–163,
165–204
Accordion control, 133–135
AccordionPane control, 133–135
AlwaysVisibleControlExtender control,
135–136
AnimationExtender control, 137–144
discrete animation, 144
fade animation, 138–140
length animation, 140–142
AutoCompleteExtender control,
144–146
CalendarExtender control, 147–149
CascadingDropDown control, 149–153
CollapsiblePanelExtender control,
154–156
ConfirmButtonExtender control,
157–158
DragPanelExtender control, 159–161
DropDownExtender control, 161–163
DropShadow extender, 165–167
DynamicPopulate extender, 168–170
FilteredTextBox extender, 171–172
HoverMenu extender, 172–174
installing, 131–133
MaskedEdit extender, 174–177
MaskedEditValidator extender,
174–177
ModalPopup extender, 177–180
NoBot extender, 180–182
NumericUpDown extender, 182–185
PasswordStrength extender, 185–188
PopupControl extender, 188–190
Rating control, 190–191
ReorderList control, 192–194
ResizableConrol extender, 195–196
RoundedCorners extender, 167
Slider extender, 197–198
SlideShow extender, 198–201
TabContainer control, 201–203
TabPanel control, 201–203
<asp:ObjectDataSource> tag, 126
asp:ScriptManager tag, 52
<asp:ServiceReference> tag, 49, 52
<asp:UpdateProgress> tag, 119
.aspx page, 134
AssociatedUpdatePanelID property, 255
Asynchronous JavaScript, 7
asynchronous web applications, 24
AsyncPostBackError event, 89
AsyncPostBackErrorMessage property, 89
AsyncPostBackTrigger trigger, 101, 107
Atlas, 205
AttachEvent method, 208
AutoCollapse property, 154
AutoComplete property, 175
■INDEX258
828-8 Index.qxd 10/14/07 12:25 PM Page 258