Báo cáo sinh học: "PhyloScan: identification of transcription factor binding sites using cross-species evidence" ppsx
Bạn đang xem bản rút gọn của tài liệu. Xem và tải ngay bản đầy đủ của tài liệu tại đây (639.42 KB, 17 trang )
BioMed Central
Page 1 of 17
(page number not for citation purposes)
Algorithms for Molecular Biology
Open Access
Research
PhyloScan: identification of transcription factor binding sites using
cross-species evidence
C Steven Carmack
1
, Lee Ann McCue
1,2
, Lee A Newberg*
1,3
and
Charles E Lawrence
1,4
Address:
1
The Wadsworth Center, New York State Department of Health, Albany, NY 12201, USA,
2
Pacific Northwest National Laboratory,
Richland, WA 99352, USA,
3
Departrnent of Computer Science, Rensselaer Polytechnic Institute, Troy, NY 12180, USA and
4
Division of Applied
Mathematics, Brown University, Providence, RI 02912, USA
Email: C Steven Carmack - ; Lee Ann McCue - ;
Lee A Newberg* - ; Charles E Lawrence -
* Corresponding author
Abstract
Background: When transcription factor binding sites are known for a particular transcription
factor, it is possible to construct a motif model that can be used to scan sequences for additional
sites. However, few statistically significant sites are revealed when a transcription factor binding site
motif model is used to scan a genome-scale database.
Methods: We have developed a scanning algorithm, PhyloScan, which combines evidence from
matching sites found in orthologous data from several related species with evidence from multiple
sites within an intergenic region, to better detect regulons. The orthologous sequence data may be
multiply aligned, unaligned, or a combination of aligned and unaligned. In aligned data, PhyloScan
statistically accounts for the phylogenetic dependence of the species contributing data to the
alignment and, in unaligned data, the evidence for sites is combined assuming phylogenetic
independence of the species. The statistical significance of the gene predictions is calculated
directly, without employing training sets.
Results: In a test of our methodology on synthetic data modeled on seven Enterobacteriales, four
Vibrionales, and three Pasteurellales species, PhyloScan produces better sensitivity and specificity
than MONKEY, an advanced scanning approach that also searches a genome for transcription
factor binding sites using phylogenetic information. The application of the algorithm to real
sequence data from seven Enterobacteriales species identifies novel Crp and PurR transcription
factor binding sites, thus providing several new potential sites for these transcription factors. These
sites enable targeted experimental validation and thus further delineation of the Crp and PurR
regulons in E. coli.
Conclusion: Better sensitivity and specificity can be achieved through a combination of (1) using
mixed alignable and non-alignable sequence data and (2) combining evidence from multiple sites
within an intergenic region.
Published: 23 January 2007
Algorithms for Molecular Biology 2007, 2:1 doi:10.1186/1748-7188-2-1
Received: 10 July 2006
Accepted: 23 January 2007
This article is available from: />© 2007 Carmack et al; licensee BioMed Central Ltd.
This is an Open Access article distributed under the terms of the Creative Commons Attribution License ( />),
which permits unrestricted use, distribution, and reproduction in any medium, provided the original work is properly cited.
Algorithms for Molecular Biology 2007, 2:1 />Page 2 of 17
(page number not for citation purposes)
Background
Alteration of the frequency of transcription from DNA to
messenger RNA is the primary means by which an organ-
ism controls gene expression. Transcription initiation is
controlled primarily through the binding of transcription
factors (proteins) to cognate sites on a chromosome (tran-
scription factor binding sites). For a given transcription
factor and an experimentally identified set of transcrip-
tion factor binding sites, or a set of co-regulated promot-
ers, computational methods can be applied to identify the
DNA sequence pattern that is recognized by the transcrip-
tion factor. Such a sequence pattern is commonly referred
to as a motif, which is a conceptual extension of a single
sequence, in which each position is characterized not by a
single nucleotide, but rather by a column vector represent-
ing the probability with which each of the four nucle-
otides contributes to the pattern at that position.
The prediction of additional transcription factor binding
sites by comparison of a motif to the promoter regions of
an entire genome is a vexing problem, due to the large
database size (approximately one half million intergenic
base pairs for a typical prokaryote, and several hundred
million base pairs for a mammal) and the relatively small
width of a typical transcription factor binding site (6–30
bp). In such a large search space, chance alone results in
the identification of many sites that match the motif. The
problem is further compounded by variability among the
transcription factor binding sites that are recognized by a
transcription factor; such variability permits differences in
the level of regulation, due to the altered intrinsic affini-
ties for the transcription factor [1].
Programs that use a motif to search (i.e., scan) a sequence
database for matches (i.e., predicted transcription factor
binding sites) fall into two general categories. One
approach is to employ a training set of transcription factor
binding sites and a scoring scheme to evaluate predictions
[2-8]. The scoring scheme is often based on information
theory [9], and the training set is used to empirically deter-
mine a score threshold for reporting of the predicted tran-
scription factor binding sites. The second method relies
on a rigorous statistical analysis of the predictions, based
upon modeled assumptions. Briefly, the statistical signifi-
cance of a sequence match to a motif can be assessed
through the determination of type I error (p-value): the
probability of observing a match with a score as good or
better in a randomly generated search space of identical
size and nucleotide composition. The smaller the p-value,
the less likely that the match is due to chance alone. Sta-
den [10] presented an efficient method that exactly calcu-
lates this probability, and Neuwald et al. [11] described an
implementation of this method.
When either of the two types of method is used to scan an
entire genome, or the promoter regions of a genome,
there is a difficult trade-off between sensitivity and specif-
icity. If the threshold for a prediction (sites above a chosen
information measure cutoff, or below a chosen p-value
level) is chosen so as to reflect a reasonably low false pos-
itive rate (i.e., high specificity), it is frequently difficult to
recover many of the known transcription factor binding
sites that were used in the construction of the motif. Con-
versely, the choice of a threshold for prediction that finds
many of the known transcription factor binding sites (i.e.,
high sensitivity) invariably leads to an overwhelming
number of additional predicted sites, most of which are
likely false positives. (Generally, we do not know where a
transcription factor might bind in a way that does not
affect transcription and thus, in this latter case, the func-
tional interpretation of these "false positives" is somewhat
subtle.)
The goal of the present study has been to increase the sta-
tistical power, when scanning a genome sequence data-
base with a regulatory motif, by taking advantage of
additional sequence data from related species and from
multiple sites within an intergenic region. We have
extended Staden's method [10] to allow scanning of
orthologous sequence data that are either multiply
aligned, unaligned, or a combination of aligned and una-
ligned. Our new algorithm, PhyloScan, an extension of
Staden's method, statistically accounts for the phyloge-
netic dependence of the species contributing data to the
alignment and calculates a p-value for the sequence match
in the aligned data set. This approach is similar to the
MONKEY method [12]; however, there are several key dif-
ferences between the two.
MONKEY requires that all sequences be multiply aligned.
However, this requirement is too restrictive for many tran-
scription factors of interest that are conserved across a
broad phylogenetic range. That is, there are many cases in
which distantly related species contain orthologous tran-
scription factors and binding sites, even though general
sequence alignments are not feasible (e.g., between eubac-
teria and archaea [13-15]). Thus, we have developed a
scanning approach that will find sites in mixed data that
can include one or more clades of sequences (each of
which can be aligned reliably) as well as sequences which
cannot be aligned reliably to any other sequences.
Furthermore, regulatory modules often include multiple
sites, none of which alone would be statistically signifi-
cant in a genome-scale scan. Our procedure addresses this
important case. In addition, our procedure permits use of
a wide range of nucleotide substitution models, and it
reports q-values [16], the fraction of intergenic regions of
a given strength or better that are expected to be false,
Algorithms for Molecular Biology 2007, 2:1 />Page 3 of 17
(page number not for citation purposes)
whereas MONKEY reports p-values, the fraction of false
sites expected to show a given strength or better.
Results
We evaluated PhyloScan on both real and synthetic data.
For the real data, we chose the Escherichia coli Crp and
PurR motifs, and we gathered genome sequence data for
several gamma-proteobacteria. We and others have previ-
ously demonstrated that a comparative genomic
approach is effective in the prediction of transcription fac-
tor binding sites within this phylogenetic group [17-26].
Among the species chosen for this study (E. coli, Salmo-
nella enterica serovar Typhi (S. typhi), Yersinia pestis, Hae-
mophilus influenzae, Vibrio cholerae, Shewanella oneidensis,
and Pseudomonas aeruginosa), only E. coli and S. typhi
exhibit sufficient homology in the promoter regions [26].
Thus, we aligned orthologous intergenic regions for these
two species, and we combined the statistical evidence
from the scanning of the aligned E. coli and S. typhi data
with the statistical evidence from the scanning of una-
ligned orthologous intergenic regions from the remaining
five, more distantly related, species. (Approaches in which
the S. typhi sequence data is considered independent of
the E. coli sequence data were considered in earlier work
[26].)
Synthetic sequence data
While of interest for comparison with previous studies,
this set of species is not representative of the problem of
incorporating phylogeny into scanning methods. Further-
more, evaluation of scanning algorithms using real
sequence data is difficult, because of the presence of tran-
scription factor binding sites that are likely real, but unre-
ported. That is, because they have not yet been
experimentally verified, some predicted sites reported as
false positives may, in fact, be true positives. Thus, we gen-
erated synthetic data in which we controlled the binding
site content. Specifically, as a typical example, we gener-
ated four sets of sequence data modeled on the phyloge-
netic relationship of fourteen prokaryotic species: seven
Enterobacteriales (E. coli, S. typhi, Klebsiella pneumoniae, Sal-
monella bongori, Citrobacter rodentium, Shigella flexneri, &
Proteus mirabilis), four Vibrionales (Vibrio cholerae, Vibrio
parahaemolyticus, Vibrio vulnificus, & Vibrio fischeri), and
three Pasteurellales (Haemophilus influenzae, Haemophilus
somnus, & Haemophilus ducreyi).
The first synthetic data set consists of 140,000 simulated
intergenic regions representing the orthologous promoter
regions of 10,000 genes from the fourteen species, where
each sequence is of length 500 bp, with two planted Crp
sites, generated from the Crp motif model (Figure 1A).
The second data set is the same but with "1/2-strength
Crp" sites, where the average number of bits of informa-
tion across the positions of a Crp motif is cut in half. The
third data set contains "1/3-strength Crp" sites. The fourth
data set is a negative control and contains no planted tran-
scription factor binding sites. See the Methods and Figure
1 for more information.
With each simulated gene, the sequences were generated
respecting the phylogenetic tree shown in Figure 2, using
the nucleotide evolution model of Halpern & Bruno
(1998) [28] for transcription factor binding sites and the
model of Kimura (1980) [29] (with a transition to trans-
version ratio of 3.0) for background positions, and with-
out the introduction of sequence gaps. The phylogenetic
tree was generated from aligned (using MUSCLE [30]) 16S
rRNA gene data via PHYLIP [31] and tree branch lengths
were scaled up by a factor of 13.5 so that the tree would
represent evolution at neutral sequence positions rather
than at the somewhat conserved 16S rRNA gene sequence
positions. Although the factor of 13.5 reflects our previous
experience (unpublished), it is not rigorously chosen; for
this and other reasons, although this tree is realistic, it
should not be considered definitive.
Based upon the distances in the phylogenetic tree we par-
titioned the fourteen species into four clades, the Vibrion-
ales clade, the Pasteurellales clade, P. mirabilis (by itself),
and the remaining Enterobacteriales (henceforth, the
Enterobacteriales clade). To evaluate the trade-off between
sensitivity and specificity, we ran PhyloScan using the full-
strength Crp motif; we scanned the full-strength-Crp-sites
sequence data (positive data) and the no-sites sequence
data (negative data). Likewise, we ran PhyloScan using the
1/2-strength Crp motif, scanning the 1/2-strength
sequence data (positive data) and the no-sites sequence
data (negative data); we also ran PhyloScan using the 1/3-
strength Crp motif, scanning the 1/3-strength sequence
data (positive data) and the no-sites sequence data (nega-
tive data).
Additionally, we ran PhyloScan with some of its features
disabled. In three pairs of runs, one for each motif
strength, as above, we ran PhyloScan on the four clades of
sequence data, but by disabling its Neuwald-Green calcu-
lation (see Methods) we did not permit PhyloScan to sta-
tistically incorporate any sites other than the best found
binding site in each intergenic region. In another three
pairs of runs we ran PhyloScan, permitting it to consider
multiple sites within an intergenic region, but by disa-
bling its Bailey-Gribskov calculation (see Methods) Phy-
loScan could not consider more than one clade, and we
gave it only the sequence data from the Enterobacteriales
clade. Finally, we ran MONKEY (which incorporates nei-
ther the Neuwald-Green nor the Bailey-Gribskov calcula-
tion) on the Enterobacteriales clade sequence data, in a
final three pairs of runs.
Algorithms for Molecular Biology 2007, 2:1 />Page 4 of 17
(page number not for citation purposes)
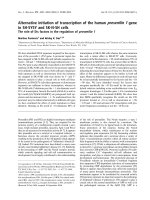
Crp Binding Site Motif and Generation of Weaker VersionsFigure 1
Crp Binding Site Motif and Generation of Weaker Versions. The logo in panel A indicates the Crp motif used to scan
for Crp binding sites. It is also used to generate a pair of full-strength Crp sites in the synthetic sequence data. The binding site
equilibria were calculated from sequence data aligned by the Gibbs Recursive Sampler [49], and were plotted using publicly
available software [27]. The logo in panel B indicates the motif used to generate 1/2-strength Crp sites. It was generated by
raising each probability of a nucleotide to its 0.637
th
power, with subsequent scaling so that the probabilities of the four nucle-
otides for any motif column sum to 1.0. The exponent was chosen so that the average information content (i.e., "bits") would
be half that value for the full-strength sites. The logo in panel C is the 1/3-strength Crp motif, generated with an exponent of
0.507 so that average information content would be one-third of the full-strength value.
A
G
T
G
weblogo.berkeley.edu
0
1
2
bits
1
C
G
T
A
2
G
T
A
3
G
T
A
4
G
A
C
T
5
C
A
T
6
G
A
C
7
A
T
8
T
G
C
9
10
11
12
13
14
15
A
C
G
T
16
T
A
C
17
C
T
G
A
18
G
T
A
C
19
C
T
G
A
20
C
A
T
21
C
A
T
22
G
C
A
T
weblogo.berkeley.edu
0
1
2
bits
1
C
G
T
A
2
C
G
T
A
3
G
T
A
4
G
A
C
T
5
C
A
T
G
6
G
A
C
T
7
C
A
T
G
8
T
G
C
A
9
10
11
12
13
14
15
A
C
G
T
16
G
T
A
C
17
C
T
G
A
18
G
T
A
C
19
C
T
G
A
20
C
A
T
21
G
C
A
T
22
G
C
A
T
weblogo.berkeley.edu
0
1
2
bits
1
C
G
T
A
2
C
G
T
A
3
G
T
A
4
G
A
C
T
5
C
A
T
G
6
G
A
C
T
7
C
A
T
G
8
T
G
C
A
9
10
11
12
13
14
15
A
C
G
T
16
G
T
A
C
17
C
T
G
A
18
G
T
A
C
19
C
T
G
A
20
C
A
T
21
G
C
A
T
22
G
C
A
T
A
B
C
Algorithms for Molecular Biology 2007, 2:1 />Page 5 of 17
(page number not for citation purposes)
Each of these twelve pairs of runs – four algorithms times
three motif strengths – produced p-values for each of
10,000 synthetic orthologous intergenic regions with sites
and for each of 10,000 synthetic orthologous intergenic
regions without sites. When any of the algorithms is used,
it is desirable to set a p-value cutoff so that, in the positive
data, the number of intergenic regions that have values
below this cutoff is large and, in the negative data, the
number of the intergenic regions that have values below
the cutoff is small. Because the relative importances of the
former (sensitivity) and the latter (type I error) depend
upon the particular experiment and the parameters of that
experiment, it is common to plot a Receiver Operating
Characteristic (ROC) curve of sensitivity vs. type I error, to
show what is achievable from differing cutoff levels.
Figure 3 shows the ROC curves for nine of the twelve
cases; for our synthetic sequence data, the disabling of the
Neuwald-Green calculation had negligible effect, and
these three ROC curves are omitted. In all cases the disa-
bling of both the Neuwald-Green and Bailey-Gribskov
calculations significantly affected performance. (See Fig-
ure 3 and its legend for more information.)
Real sequence data
To evaluate the statistical power provided by different fac-
ets of the PhyloScan approach in real sequence data, we
measured the increase in sensitivity originating from three
sources: a reduction in database size, the use of aligned
sequence data only, and the use of non-alignable ortholog
data.
As a stripped-down baseline, we applied PhyloScan in a
scan of the full E. coli sequence database, ignoring all
other sequence data; this baseline is equivalent to the orig-
inal Staden method, and thus has the same statistical
power.
We compared the baseline to the results achievable from
a reduced database. When orthologous sequences are
aligned between closely related species, gaps may be intro-
duced, and there are often portions of the sequence that
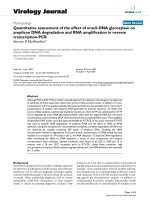
Phylogenetic Tree of Fourteen ProkaryotesFigure 2
Phylogenetic Tree of Fourteen Prokaryotes. This tree of fourteen prokaryotes specifies the phylogenetic relationship of
the species in our simulated sequence data. The tree is realistic, but approximate. The branch lengths represent the number of
substitutions (including subsequent substitutions at a given sequence position) expected for each 10,000 nucleotides not sub-
ject to selection pressures.
2426
9531
2564 H. ducreyi
2654
5931 H. somnus
4948 H. influenzae
5192
3756 V. cholerae
2761
2325
1219 V. parahaemolyticus
2543 V. vulnificus
3819 V. fischeri
3137
1336 K. pneumoniae
1304
917
235 S. typhi
895
582 S. bongori
1952 C. rodentium
1606
1150 S. flexneri
351 E. coli
5391 P. mirabilis
Algorithms for Molecular Biology 2007, 2:1 />Page 6 of 17
(page number not for citation purposes)
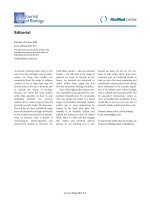
ROC Curves for PhyloScan and MONKEYFigure 3
ROC Curves for PhyloScan and MONKEY. Shown are Receiver Operating Characteristic (ROC) curves for algorithms
applied to intergenic regions containing a pair of full-strength Crp sites, a pair of 1/2-strength sites, and a pair of 1/3-strength
sites. The simulated sequence data is for fourteen prokaryotic species organized into four clades; the orthologous intergenic
sequences are 500 bp and are multiply-aligned within each clade but not between clades. ROC curves are shown for fully ena-
bled PhyloScan and MONKEY. Additionally, ROC curves for PhyloScan applied to only the Enterobacteriales clade are shown.
The ROC curves for PhyloScan with its multiple-clades capability enabled but its multiple-sites capability disabled are not
shown because they are nearly indistinguishable from the fully enabled PhyloScan. A comparison of the "PhyloScan (1 clade)"
curves to the "MONKEY (1 clade)" curves shows that there is value in combining evidence from multiple sites within an inter-
genic region using the Neuwald-Green calculation. A comparison of the "PhyloScan (4 clades)" curves to the "PhyloScan (1
clade)" curves indicates that there is additional value in considering data from multiple clades. For instance, if p-value cutoffs are
chosen so that type I error is 0.1% (i.e., the specificity is 99.9%) then PhyloScan correctly classifies 99.85% of the full-strength-
Crp intergenic regions, 72.68% of the 1/2-strength regions, and 32.64% of the 1/3-strength regions. The corresponding num-
bers for "PhyloScan (1 clade)" are 96.98%, 33.01%, and 10.11%. The corresponding numbers for MONKEY are 79.02%, 21.66%,
and 6.33%. It is possible that sensitivities for the four-clades curves would have been even stronger if we had not prohibited the
non-Enterobacteriales clades from rescuing intergenic regions in the Enterobacteriales clade that had failed to pass our 0.05 p-
value cutoff.
0%
10%
20%
30%
40%
50%
60%
70%
80%
90%
100%
0.0% 0.2% 0.4% 0.6% 0.8% 1.0% 1.2% 1.4% 1.6% 1.8% 2.0%
Type I Error
Sensitivity
PhyloScan (full-strength / 4 clades)
PhyloScan (full-strength / 1 clade)
MONKEY (full-strength / 1 clade)
PhyloScan (half-strength / 4 clades)
PhyloScan (half-strength / 1 clade)
MONKEY (half-strength / 1 clade)
PhyloScan (1/3-strength / 4 clades)
PhyloScan (1/3-strength / 1 clade)
MONKEY (1/3-strength / 1 clade)
Algorithms for Molecular Biology 2007, 2:1 />Page 7 of 17
(page number not for citation purposes)
do not align; thus, the overall feasible search space for
transcription factor binding sites is reduced. A search of
such a reduced database in and of itself will allow the
detection of more statistically significant transcription fac-
tor binding sites than will a search of a full set of inter-
genic regions from a single species. Therefore, the
scanning results from a database reduced in size, yet con-
taining data from only one species, will provide a measure
of the increase in sensitivity to the baseline scan that is
due simply to a reduction in search space.
We compared the baseline and reduced-database results
to those obtained by scanning a database of aligned E.
coli-S. typhi sequences, in order to measure the increase in
sensitivity provided by the use of this aligned sequence
data.
To test these sources of statistical power, we generated
databases of promoter-containing E. coli intergenic
regions, aligned E. coli-S. typhi intergenic regions, and
motif models based on known Crp and PurR sites (see
Methods). Specifically, the three databases contained: (1)
the set of all E. coli intergenic regions, (2) the E. coli
sequences extracted from the alignments of E. coli-S. typhi
orthologous intergenic regions, and (3) the E. coli-S. typhi
aligned intergenic regions data. Relative to the original
method of Staden, our results show large improvement in
the number of predicted transcription factor binding sites
due to the alignment of two somewhat closely related spe-
cies (Table 1 and Figures 4 and 5). Specifically, with a q-
value cutoff of 0.001 (see Methods) the scanning of the set
of all E. coli intergenic sequences results in only one Crp-
significant intergenic region (with two predicted Crp
sites), and one PurR-significant intergenic region (with
one PurR site). No improvement was obtained in the
reduced database of E. coli intergenic sequences. However,
when the set of E. coli-S. typhi aligned sequences was
scanned, 10 Crp-significant intergenic regions (with 13
Crp sites total), and 12 PurR-significant intergenic regions
(with 13 PurR sites total) were predicted.
Furthermore, in each of the tests described above (using
the baseline, the reduced-database, or the aligned
sequence data) we can incorporate non-alignable orthol-
ogous sequence data to measure the impact of these addi-
tional data on sensitivity. Thus, to determine the extent to
which additional, more distantly related, species could
provide evidence to support a particular candidate tran-
scription factor binding site upstream of a particular gene
in the target species, we used PhyloScan to scan the
orthologous intergenic regions for that candidate gene
from the additional species (clades), assuming phyloge-
netic independence between clades. The p-value repre-
senting the combined evidence supporting a transcription
factor binding site prediction was then calculated using
the method of Bailey and Gribskov [32], as described in
the Methods.
To demonstrate this approach with the E. coli Crp and
PurR examples, we employed orthologous data from the
five additional gamma-proteobacterial species listed
above. We used PhyloScan to identify potential Crp and
Table 1: Summary of PhyloScan Predictions
C1 C2 C3 C4 C5 C6
E. coli Sequence Data Full
a
Full
a
Red.
b
Red.
b
Red. & Aligned
c
Red. & Aligned
c
Indep. Species No Yes No Yes No Yes
Crp Known
d
1(2) 7(10) 1(2) 8(12) 4(6) 11(16)
Crp Novel
d
0(0) 16(20) 0(0) 16(18) 6(7) 18(21)
PurR Known
d
1(1) 9(9) 1(1) 11(11) 9(9) 12(12)
PurR Novel
d
0(0) 4(5) 0(0) 4(5) 3(4) 6(7)
This table shows the number of E. coli intergenic regions predicted by PhyloScan to contain Crp or PurR binding sites, with the total number of sites
predicted within parentheses. Column C1 is for a scan of the full set of E. coli intergenic sequence data (excluding the S. typhi sequence data and the
sequence data from the other, independent clades). Column C3 is for a scan of only that E. coli sequence that is alignable with S. typhi; the S. typhi
sequence data continue to be excluded. Column C5 is for a scan of the aligned E. coli-S. typhi sequence data. Columns C2, C4, and C6, are like
Columns C1, C3, and C5, respectively, but the sequence data from the independent clades are also incorporated. Observing the lack of
improvement of Column C3 over Column C1 (or the meager improvement of C4 over C2), we conclude that there is minimal gain in sensitivity
from considering only E. coli sequence that is alignable with S. typhi, when not actually using the aligned S. typhi sequence data. Observing the modest
improvement of C5 over C3 (or C6 over C4), we conclude that incorporating the aligned S. typhi sequence gives a moderate gain in sensitivity.
Observing the large improvement of C2 over C1 (or C4 over C3, or C6 over C5), we conclude that incorporating the data from species that are
not alignable with E. coli gives a significant gain in sensitivity. Notes:
a
Database of 2379 intergenic sequences from E. coli [see Additional file 2].
b
Database of E. coli sequences (reduced search space) extracted from the E. coli-S. typhi database (see Real Sequence Data in Results).
c
Database of
E. coli-S. typhi aligned intergenic sequences (see Real Sequence Data in Results).
d
The number of E. coli intergenic regions predicted by PhyloScan to
contain Crp or PurR binding sites, where the total number of binding sites detected is in parentheses and those sites that correspond to known,
experimentally verified transcription factor binding sites and those sites that are novel (not yet verified) are indicated.
Algorithms for Molecular Biology 2007, 2:1 />Page 8 of 17
(page number not for citation purposes)
PurR-Significant Intergenic Regions FoundFigure 5
PurR-Significant Intergenic Regions Found. The results for PurR are similar to those for Crp. See the caption of Figure 4.
E.coli “reduced” E.coli E.coli - S.typhi
number of intergenic regioins
0
2
4
6
8
10
12
14
16
18
20
PurR, known
PurR, novel
Crp-Significant Intergenic Regions FoundFigure 4
Crp-Significant Intergenic Regions Found. When counting Crp-significant intergenic regions, comparison of the bars
labeled "+" (with the unalignable sequences) relative to those labeled "-" (without the unalignable sequences) indicates that the
largest gain in sensitivity comes from the use of unalignable, evolutionarily distant sequences. The left part of this figure shows
the sensitivity for the scan of E. coli data only. The center part of this figure shows the sensitivity from the scan of only those E.
coli sequence data that are alignable with S. typhi. The right part of this figure shows the sensitivity from the scan of E. coli-S.
typhi aligned sequence data.
Crp, novel
Crp, known
number of intergenic regions
0
5
10
15
20
25
30
35
E.coli “reduced” E.coli E.coli - S.typhi
Algorithms for Molecular Biology 2007, 2:1 />Page 9 of 17
(page number not for citation purposes)
PurR transcription factor binding sites in the E. coli-only
and E. coli-S. typhi aligned data sets, using a P
intergenic
≤ 0.05
cutoff to select candidate intergenic regions for examina-
tion in the other five species. As summarized in Table 1,
depicted in Figures 4 and 5, and described below, we
observed a considerable increase in the number of pre-
dicted transcription factor binding sites at the q-value ≤
0.001 level, when the evidence from the five additional
gamma-proteobacterial species was included by combin-
ing p-values.
For example, PhyloScan identified a total of 10 Crp-signif-
icant intergenic regions in the E. coli-S. typhi aligned data,
but after combination of the evidence from the remaining
five species, a total of 29 Crp-significant intergenic regions
were predicted, a near tripling. Compared to a simple
search of the raw E. coli intergenic sequences (one Crp-sig-
nificant intergenic region), this represents a tremendous
increase in sensitivity. The results with the PurR model
were also dramatic: the use of data from S. typhi, Y. pestis,
H. influenzae, and V. cholerae provided a 50% increase in
the number of PurR-significant intergenic regions (to 18
from 12), compared to the scanning of E. coli-S. typhi
aligned intergenic sequences only. In the E. coli sequence
alone there was only a single PurR-significant intergenic
region. In the Supplementary Materials are tables listing
the located sites for Crp [see Additional file 3] and PurR
[see Additional file 4], as well as captions for these tables
[see Additional file 1].
We also examined the best 20 reported intergenic regions
for each of the six approaches shown in Table 1. We see
several differences, not only in the reported q-values, but
also in the order and appearance of predicted binding
sites in intergenic regions; see the caption of Table 2 for
more details.
It is worth noting here that the non-alignable species were
selected for combination of p-values based upon the pres-
ence or absence of the transcription factor under study. All
gamma-proteobacteria used in this study encode
orthologs to Crp; hence, data for all species were included
when p-values were combined from scans with the Crp
motif. In contrast, because S. oneidensis and P. aeruginosa
do not encode PurR orthologs, these species were not con-
sidered when we scanned for PurR binding sites.
Discussion
Key features of PhyloScan
We are able to increase the flexibility and sensitivity of
scanning, without increasing the false positive rate, by
incorporating the following three key features into Phylo-
Scan:
1. We allow a mixture of alignable and unalignable
sequence data. Specifically, sequences that can be reliably
multiply aligned should be grouped and aligned. These
clades of multiply-aligned sequences, including each
"degenerate clade" of one sequence that cannot be relia-
bly aligned with any other sequence, are used by PhyloS-
can. A phylogenetic tree relating the sequences within a
clade, a user-specified nucleotide substitution model, and
an extension to Staden's precise p-value calculation that is
phylogenetically aware are all employed by PhyloScan to
increase the statistical power of Staden's original method.
(See Methods.)
2. We combine evidence from multiple sites within an
intergenic region to produce a better sensitivity than could
be achieved by simply examining the strongest site within
an intergenic region. Specifically, a group of weak sites,
none of which is statistically significant in isolation, is
detected by the fact that for some value i, the ith weakest
of the sites is surprisingly strong given that it is the ith
weakest. (See Methods.)
3. We report our findings in terms of q-values [16] instead
of p-values. For each intergenic region we report the prob-
ability that a region of its significance or better will be a
false prediction, instead of reporting the probability that a
negative control will appear at this significance or better.
Applicability of PhyloScan
The test cases described here reflect our past and present
research interests in proteobacterial gene regulation,
while simultaneously emphasizing PhyloScan's ability to
handle multiple weak binding sites as well as mixed
aligned and unaligned sequence data. However, the fea-
tures of our data set are not unique; there are many exam-
ples where multiple binding sites are common (e.g., flies
[33] and humans [34]) or where transcription factors and
their cognate binding sites are conserved across diverse
species for which multiple sequence alignments are not
feasible (e.g., between eubacteria and archaea [13-15]).
PhyloScan will have clear advantages in such contexts.
However, it is important to note that in situations where
orthologous regions are usually alignable and for which
the multiple-weak-sites scenario is unlikely, PhyloScan
will not perform better than existing approaches such as
MONKEY. In another direction, in cases where sequences
cannot be aligned, PhyloScan will not perform better than
existing approaches that handle "independent species."
Here we have demonstrated significant improvement of
scan results through the use of sequences from evolution-
ary distant species that have orthologous transcription fac-
tors. This is not unexpected, given results of a more
theoretical nature that quantify the extent of such
improvement [35].
Algorithms for Molecular Biology 2007, 2:1 />Page 10 of 17
(page number not for citation purposes)
PhyloScan evaluates significance at the level of the
intergenic region
A key focus of this work has been to combine evidence
across transcription factor binding sites within an inter-
genic region and across orthologous regions in order to
correctly identify intergenic regions that are likely to con-
tain transcription factor binding sites, even when each of
the identified transcription factor binding sites, consid-
ered in isolation, may not be sufficiently strong to be sta-
tistically significant. Accordingly, the individual sites
included in our predictions are not necessarily statistically
significant and individual site predictions may be false
positives even within true-positive intergenic sequences.
For instance, in the collection of 10,000 synthetic data sets
in which we planted two full-strength Crp transcription
factor binding sites per intergenic region, we have 9,985
true positive intergenic regions at the 99.9% specificity
level (see Figure 3). Of these true positives, in 6,287 of the
E. coli intergenic regions two sites were predicted and the
sites exactly coincided with the two planted sites. In 24 E.
coli intergenic regions two sites were predicted and one of
the two sites exactly coincided with a planted site. In
3,672 of these regions one site was predicted and it exactly
coincided with one of the two planted sites, and in 2 of
the E. coli intergenic regions, one site was predicted that
did not exactly coincide with a planted site.
Key user-selectable parameters in PhyloScan
Focus on a target species or clade
In running PhyloScan, the user must specify two cutoff
values, and can optionally specify additional parameters
Table 2: Top 20 Predictions by PhyloScan
C1 C2 C3 C4 C5 C6
E. coli Sequence Full
a
Full
a
Reduced
b
Reduced
b
Reduced & Aligned
c
Reduced & Aligned
c
Indep. Species No Yes No Yes No Yes
Rank Gene log(q)Genelog(q)Genelog(q)Genelog(q)Gene log(q)Genelog(q)
1 yibI -4.65 cdd -9.28 mtlA -5.14 mtlA -9.76 mtlA -7.66 mtlA -12.15
2 yqcE -2.86 glpT -7.21 ygcW -2.89 cdd -9.60 yjcB -4.55 glpA -9.19
3 b1904 -2.61 mglB -6.01 yjcB -2.62 glpA -8.31 gcd -3.99 cdd -9.16
4 fucA -2.51 yibI -5.26 yjiY -2.60 mglB -6.53 b2146 -3.97 mglB -7.60
5 deaD -2.51 yjiY -4.57 b2146 -2.53 gapA -5.21 fucA -3.93 udp -6.26
6 yjiY -2.42 hemC -4.38 fucA -2.51 udp -5.17 ygcW -3.42 gapA -6.02
7 cdd -2.29 deaD -4.35 deaD -2.47 yjiY -4.79 flhD -3.03 yjcB -5.09
8 yeaA -2.22 ysgA -4.33 cdd -2.31 cyaA -4.70 gapA -3.03 cyaA -5.04
9 yhcR -2.06 yhcR -3.99 gapA -2.22 deaD -4.37 ycdZ -3.01 malE -4.83
10 ycdZ -1.96 yqcE -3.56 qseA -2.03 malE -4.29 udp -2.78 ycdZ -4.69
11 b2736 -1.87 adhE -3.47 ycdZ -1.98 ygcW -3.63 b2248 -2.76 adhE -4.56
12 uxaC -1.81 ycdZ -3.45 mglB -1.90 adhE -3.58 glpA -2.76 b2146 -4.53
13 ysgA -1.77 yeaA -3.44 udp -1.86 ycdZ -3.52 mglB -2.73 fucA -4.46
14 glpT -1.75 mlc -3.37 uxaC -1.85 mlc -3.48 qseA -2.68 pckA -4.09
15 mglB -1.63 b1904 -3.31 glpA -1.84 fucA -3.32 pckA -2.36 aer -3.97
16 pckA -1.39 fucA -3.23 pckA -1.45 yjcB -3.32 adhE -2.14 ygcW -3.78
17 serA -1.23 b2736 -3.18 malE -1.36 pckA -3.23 aer -2.13 gcd -3.67
18 aer -1.23 pckA -3.17 aer -1.32 aer -3.17 cdd -2.10 deaD -3.65
19 adhE -1.22 aer -3.08 serA -1.32 qseA -3.07 deaD -2.04 serA -3.62
20 mlc -1.01 yjeG -3.05 adhE -1.28 uxaC -3.07 uxaC -2.02 mlc -3.62
# Diffs from C6 10 11 3 3 4 0
Because it is sometimes instructive to examine a fixed number of top hits regardless of the reported q-values, in this table we compare the six
approaches' best 20 intergenic regions for Crp. By comparing each column to Column C6, which is the best approach we employed, we see that the
C1-C5 approaches give significantly different q-values for, and orderings of, the predicted regulated genes. As indicated in the bottom row, the C1-
C5 approaches miss several of the top-20 genes reported in C6, replacing them with genes that did not make the C6 top-20 list. In particular,
although it uses all of the sequence data except S. typhi, C2 is significantly different from C6. Furthermore, although C3 has few differences from C6
in the set of genes indicated, the q-values of C3 are considerably worse and the gene order is substantially rearranged. These data suggest that the
ability to simultaneously handle both aligned and unaligned data is important in obtaining accurate predictions. Notes:
abc
See the caption notes for
Table 1. Also see the Table 1 caption for descriptions of Columns C1-C6.
Algorithms for Molecular Biology 2007, 2:1 />Page 11 of 17
(page number not for citation purposes)
describing the expected multiplicity of binding sites
upstream of a regulated gene. The first cutoff is a p-value
cutoff, calculated on a per intergenic-sequence basis for
the clade that includes the species of primary interest. We
chose a default value of 0.05, so that weak intergenic
regions in the target species' clade will not be considered,
even when strong intergenic regions are located in orthol-
ogous regions in more-distantly related species. The
choice of a larger value would reduce the focus on the tar-
get species, allowing strong sites in other species to rescue
weak sites in the target species. The choice of a smaller
value would increase the focus on the target species; the
choice of a very small value would effectively cancel out
the information available from the related species, since
any intergenic region that looks extremely promising in
the target species will almost surely continue to look
promising when additional data are included.
Quality of reported sites
The second cutoff that our approach requires is the q-value
cutoff that specifies which sites will be reported. We chose
a default value of 0.001, meaning that according to our
model, at most 0.1% of the intergenic sequences that we
report as binding the transcription factor are chance false
positives. While we have incorporated a fairly accurate
phylogenetic model, we have not incorporated into this
model such effects as the non-independence of the posi-
tions in a site (e.g., the effect of di- or tri-nucleotide energy
terms, also known as stacking energies), nor effects from
the cooperative binding of multiple transcription factors
on the ability of a factor to bind to a DNA site. Because our
model does not capture these and other features, the
actual rate of false positives is likely to be higher than
0.1%.
On the other hand, in calculating the q-value, we have
assumed that the vast majority of intergenic sequences in
a genome will likely not contain a transcription factor
binding site for the particular transcription factor under
study, i.e., we are looking for rare events. Under this
assumption, the proportion of all intergenic sequences
that are truly null will approach 1.0 in Storey and Tib-
shirani's q-value calculation (the term of [16]), and so
does not appear in our q-value equation (see Methods). In
a case where this assumption does not hold, the q-values
provided by our approach will be overly conservative.
Note that the scan technology, first described by Staden
[10] and employed here, is a frequentist hypothesis test-
ing approach. A Bayesian approach presents an alternative
through the use of Bayesian posterior probabilities for
each site. Such an approach would require the specifica-
tion of a model from which alternative sequences are
drawn as well as null sequences. When a large number of
observations are available the approach of Efron et al. [36]
provides a compromise that yields local false discovery
rates through the use of empirical Bayesian methods.
The number of sites per intergenic region
The number of potential sites to consider in each inter-
genic region, and their respective weights, are additional
parameters that can be set by the user to best capture the
underlying biology in the system under study. Generally
speaking, for i ≥ 1, the algorithm detects that an intergenic
region with sites is significant when its ith best site is sur-
prisingly strong given its rank as the ith best site. The
weight w
i
should be chosen in proportion to the number
of such intergenic regions that are expected to have i as the
first/lowest rank that appears strong by this test. We have
set the default to have weights (w
1
, w
2
) = (0.9, 0.1) under
the assumption that approximately 90% of intergenic
regions with sites will have a strong site; among the
remaining intergenic regions with sites, nearly all will
have a site that is surprisingly strong given its rank as sec-
ond strongest. (See the Methods.)
Divergently transcribed genes
The presence of divergently transcribed genes, that is, the
circumstance in which an intergenic region is upstream of,
and contains the promoters for, both of a given pair of
neighboring genes, is quite common in prokaryotes, and
also occurs in eukaryotes, albeit much less frequently.
Divergently transcribed genes occur frequently in the E.
coli genome (644 pairs of divergently transcribed genes),
and their presence has raised the question of which
orthologous data should be used when we combine p-val-
ues. In the present implementation of PhyloScan, the
choice was made randomly. Thus, in such cases, we were
as likely to make a "correct" choice as to make an "incor-
rect" choice, if only one of the E. coli genes flanking an
intergenic region containing candidate transcription fac-
tor binding sites is regulated by the transcription factor of
interest. However, in cases where gene synteny is con-
served across several species, this choice becomes irrele-
vant. That is, when synteny is conserved, the same
intergenic regions from each species will be examined
regardless of the gene chosen; inspection of the output
and, ultimately, experimental validation become neces-
sary in order to evaluate whether a predicted site is associ-
ated with the chosen gene, with the divergently
transcribed gene, or with both. Implementation of a sys-
tematic or informed choice in these situations will be a
topic for the future development of PhyloScan.
Conclusion
We have used PhyloScan to combine evidence from
matching sites found in orthologous data from several
related bacterial species. In simulated sequence data, we
demonstrate good sensitivity at high specificity levels. In
ˆ
π
0
Algorithms for Molecular Biology 2007, 2:1 />Page 12 of 17
(page number not for citation purposes)
real sequence data we are able to rediscover many of the
known Crp and PurR transcription factor binding sites in
E. coli, and we predict several novel Crp-significant inter-
genic regions and several novel PurR-significant intergenic
regions in E. coli; specifically, over half of the Crp sites and
one-third of the PurR sites are not experimentally vali-
dated by DNase I or electrophoretic mobility shift assays.
Accordingly, our results have provided several new poten-
tial binding sites for these transcription factors, that
require validation, to enable further delineation of these
regulons in E. coli.
Through its capability of using cross-species data, PhyloS-
can improves the sensitivity of motif scanning; because
the approach permits the use of both aligned and una-
ligned data, from both evolutionarily near and somewhat
more distant species, it is our hope that researchers will
find it useful in a wide variety of settings.
PhyloScan is available on request from the authors via
, and a Web interface for the
software is available [37].
Methods
Like the MONKEY method [12], PhyloScan uses the phy-
logenetic model of Neyman [38] and the efficient algo-
rithm of Felsenstein [39] to evaluate the probability that a
site in observed multiply-aligned sequence data is consist-
ent with a transcription factor's motif model. With either
MONKEY or PhyloScan, each position of the motif is eval-
uated, and the computed probabilities for the motif posi-
tions are then multiplied together to give the strength of
the site. Via the approach of Staden [10], the probability
that such strength would arise by chance is precisely com-
puted.
PhyloScan goes beyond MONKEY in several key ways.
First, PhyloScan combines the information from multiple
sites within an intergenic region, so that evidence from
weak sites that would not be significant in isolation is
combined, to identify a statistically significant find. Sec-
ond, information from more-distant sequences, both
non-alignable isolated sequences and clades of alignable
sequences, is incorporated so as to further increase sensi-
tivity, without an accompanying increase in false predic-
tions. Third, we signify strength of a find by reporting its
q-value, the fraction of predictions of this probability or
better that are expected to be false, rather than its p-value,
the fraction of false sites that are expected to demonstrate
this probability or better.
Descriptions of the three main differences between the
two algorithms are provided below.
Combining evidence across sites within an intergenic
region
PhyloScan combines information from multiple predic-
tions via a weighted Bonferroni test in a manner similar to
that of Neuwald and Green [40]. Specifically, for a user-
supplied value k, which defaults to 2, and user-supplied
weights (w
1
, , w
k
), which default to (0.9, 0.1), PhyloScan
conservatively computes an intergenic region's p-value as
where the weights (w
1
, , w
k
) are nonnegative and sum to
one, and p
i
is the probability that a randomly generated,
intergenic sequence alignment of the same size would
have its ith best site as good as or better than the ith best
site in the intergenic sequence data under consideration.
The calculation is conservative because the underlying
events whose probabilities are (p
1
, , p
k
) are not statisti-
cally disjoint [40].
Thus, an intergenic region with a strong site will make its
presence known via a strong (i.e., low) value for the p
1
/w
1
term, and an intergenic region that does not have a strong
site, but that does have an ith best site that is surprisingly
strong (given its rank as ith best), will be detected through
a strong value for the p
i
/w
i
term. This enables us to detect
both transcription factors that tend to bind strongly but in
isolation and transcription factors that tend to bind mul-
tiply but weakly.
An alternate approach for combining the contributions of
multiple binding sites, that of seeking the p-value of the
sum of their log-likelihoods [41], is not employed by Phy-
loScan.
Combining evidence from more-distant sequences
As described above, a P
intergenic
p-value is generated for
each sequence alignment of an intergenic region, but a
true site's value may still be too weak to distinguish that
site from the false positives in a vast genome. To address
this problem, we combine this p-value with the p-values
for the same intergenic region that come from sequence
alignments of more distantly-related species. That is, we
partition the input sequences for orthologous promoters
into clades such that each clade is either an isolated
sequence or contains sequences that can be reliably, mul-
tiply aligned; we compute the P
intergenic
value for each
clade as above; and we combine these p-values using the
formula of Bailey and Gribskov [32]. When there are n
such clades whose P
intergenic
values are P
1
, P
2
, , P
n
then we
compute:
P
p
w
p
w
p
w
k
k
intergenic
=
min , , , ,1
1
1
2
2
Algorithms for Molecular Biology 2007, 2:1 />Page 13 of 17
(page number not for citation purposes)
This formula precisely computes the p-value for the prod-
uct of n values drawn randomly from the interval [0, 1].
An example of this calculation is available in the Supple-
mentary Materials [see Additional file 1].
PhyloScan allows a p-value cutoff
α
, which defaults to
0.05, such that sites in a user-specified clade of interest
that are worse than this cutoff are not permitted to be
strengthened by data from the other species via the com-
bination process. This feature allows the user to concen-
trate on a single clade or species rather than the entire tree
of species. Because of this cutoff, it is appropriate to mod-
ify the above formula for sites that survive the cutoff:
Utility of q-value over p-value
The p-value, the probability that a negative control would
appear positive, must be used with great care because
genomes are vast relative to regulatory sequence elements.
For instance, in many other situations a p-value of 10
-6
is
considered excellent, but when there are on the order of
10
9
places where a transcription factor binding site is not
likely to bind, such a "strong" p-value can leave us with
1,000 false positives – or even more, in the usual case that
some of the biology has not been incorporated into the
statistical model. Thus, to properly interpret a p-value, the
researcher must be on guard to quantify the number of
negative cases.
The q-value (or False Discovery Rate [16]) explicitly incor-
porates the vastness of the genome in the calculation. The
q-value of a transcription factor binding site tells us the
proportion of sites of that strength or better that we expect
to be false positives. Under ideal circumstances, the
researcher who chooses a q-value threshold of 0.001
expects only one in 1,000 of the reported sites to be a false
positive regardless of the genome size. (However, because
we do not pretend to have statistically modeled all the rel-
evant biology, the false discovery rate will generally be
higher than the specified threshold.)
Real data inputs
The collection of orthologous intergenic regions, the divi-
sion of species into clades, the multiple alignments, the
phylogenetic trees, and the motif models needed as input
to PhyloScan (or other similar algorithms) can be difficult
to construct, and are unique to an individual's research
interests and applications. We discuss our approaches in
the following. The flowchart in Figure 6 depicts a high-
level view of the intergenic sequence database generation
and the application of PhyloScan to these data.
It is our belief that PhyloScan (and, e.g., MONKEY) are
fairly robust to typical levels of error in these inputs,
though further exploration is required to substantiate this
claim.
Locating orthologous sequences
Genome sequence data and annotations were down-
loaded from the NCBI RefSeq database [42]: Escherichia
coli K12 (NC_000913.1), Salmonella enterica serovar Typhi
(S. typhi)(NC_003198), Yersinia pestis CO92
(NC_003143), Haemophilus influenzae Rd (NC_000907),
Vibrio cholerae El Tor (NC_002505 and NC_002506),
Shewanella oneidensis MR-1 (NC_004347 and
NC_004349), and Pseudomonas aeruginosa PA01
(NC_002516). Orthologs for each of the annotated E. coli
genes were identified in each of the remaining six species,
using INPARANOID v.1.35 [43]. This program uses
BLAST [44] to compare the complete set of predicted pro-
tein sequences from one genome with that of another,
and identifies the reciprocal best hits. We set the parame-
ters to use the BLOSUM62 matrix and a minimum bit
score of 30, and we required that the alignment cover at
least 50% of both proteins.
In the examples presented in this study, E. coli was the pri-
mary species of interest; we therefore identified a set of E.
coli promoter-containing sequences by identifying each E.
coli protein-coding gene (excluding 111 genes encoded on
transposons or prophage elements) that has at least 20 bp
of upstream intergenic sequence. By these criteria, there
are 2379 E. coli intergenic regions of interest. Orthologous
upstream intergenic-sequence data files were then gener-
ated for this set of 2379 E. coli regions, using the results
from INPARANOID to identify orthologs, and the seven
genome annotations to define intergenic boundaries. In
the Supplementary Materials are a table with these data
[see Additional file 2] and a caption for the table [see
Additional file 1].
Designating clades
Among the species included in this study, only E. coli and
S. typhi exhibit extensive homology (70% identity on aver-
age) in the promoter regions [26]. The phylogenetic dis-
tance of two sequences that share this level of homology
is 0.384, assuming the nucleotide substitution model of
Jukes & Cantor [45] (and the value would be similar
under a variety of more current models); thus, we
PP
PP
P
i
c
c
n
i
i
n
product
combined product
product
=
=
−
=
=
−
∏
1
0
(ln( ))
!
.
11
∑
PP
P
i
i
i
n
combined product
product
=
−
=
−
∑
ln
!
.
α
0
1
Algorithms for Molecular Biology 2007, 2:1 />Page 14 of 17
(page number not for citation purposes)
Data Processing Flow Chart for PhyloScanFigure 6
Data Processing Flow Chart for PhyloScan. An overview of the steps taken to locate Crp and PurR transcription factor
binding sites in E. coli intergenic regions. The species examined were Escherichia coli (EC), Salmonella enterica serovar Typhi (S.
typhi) (ST), Yersinia pestis (YP), Haemophilus influenzae (HI), Vibrio cholerae (VC), Shewanella oneidensis (SO), and Pseudomonas
aeruginosa (PA).
E. coli genome &
annotation
INPARANOID
genomes of
ST
,
YP
,
HI
,
VC
,
SO
,
PA
2379 E. coli intergenic
regions ( 20 bp)
extraction of E. coli intergenic regions of interest
exclude:
1341 genes with < 20 bp upstream sequence
111 genes in transposons, prophages
115 RNA-encoding genes
target species clade:
1662 E. coli – S. typhi aligned pairs
836 unaligned E. coli sequences
BestFit
S. typhi orthologous
intergenic regions
independent clades:
YP, HI, VC, SO, PA
orthologous intergenic regions
PhyloScan
candidates with
p
intergenic
0.05
product of p-values
calculation
report intergenic regions
q-value 0.001
transcription factor
motif model
Phylogenetic
tree
PhyloScan
q-values
calculation
Algorithms for Molecular Biology 2007, 2:1 />Page 15 of 17
(page number not for citation purposes)
assumed this phylogenetic distance between E. coli and S.
typhi, and data from these two species are taken to form
one clade for PhyloScan. Each of the remaining species
formed a separate clade of unaligned sequence data, since
these species do not exhibit sequence identity with E. coli
or with each other [26].
Generally, we would combine sequences into a single
clade if their pairwise phylogenetic distances were compa-
rable to that between E. coli and S. typhi, or nearer.
Constructing multiple alignments
With only two closely related species in our set, we chose
the Smith-Waterman [46] pairwise, gapped local align-
ment algorithm (implemented as BestFit in the Wisconsin
Package Version 10.3, Accelrys Inc., San Diego, CA) to
align their orthologous intergenic regions, using default
parameters (match = 10.000; mismatch = -9.000; gap cre-
ation penalty = 50; gap extension penalty = 3). The align-
ment of E. coli and S. typhi orthologous upstream
intergenic sequences resulted in 1662 unique aligned
sequence pairs. The upstream intergenic sequences for an
additional 836 E. coli genes that did not have orthologs in
S. typhi remained. The combination of these two datasets
(1662 + 836 = 2498) does not equal the above number of
E. coli intergenic regions of interest (2379 sequences), due
to the complication of divergently transcribed genes. Spe-
cifically, we observed that for some divergently tran-
scribed genes in E. coli, the orthologous genes in S. typhi
are not syntenic, thus S. typhi provided two separate inter-
genic regions for alignment to a single intergenic region of
E. coli.
To perform the real-data tests, three databases represent-
ing the reference species clade were generated for scan-
ning: (1) a database containing the 2379 E. coli intergenic
regions of interest, (2) a database containing only E. coli
data ("E. coli reduced"), where 1662 E. coli intergenic
regions have been reduced in sequence space by align-
ment with S. typhi orthologous data plus an additional
836 E. coli sequences for which there was no orthologous
S. typhi data, and (3) a database containing 1662 E. coli-S.
typhi aligned orthologous intergenic regions plus an addi-
tional 836 E. coli sequences for which there was no orthol-
ogous S. typhi data.
Producing a phylogenetic tree
We constructed the phylogenetic tree for the more compli-
cated, synthetic sequence data set using 16S rRNA gene
data via MUSCLE [30] and PHYLIP [31], scaling tree
branch lengths up by a factor of 13.5, as described above
– see Synthetic Sequence Data in the Results section. A tree
constructed in this manner is not definitive but should be
sufficient for use with PhyloScan.
Obtaining binding site motif models
E. coli Crp and PurR binding sites that have been experi-
mentally identified by DNase I footprinting were
extracted from the literature and available databases, Reg-
ulonDB [47] and DPInteract [48]. The 87 Crp sites (from
65 E. coli intergenic regions) and 22 PurR sites (from 20 E.
coli intergenic regions), were aligned using the Gibbs
Recursive Sampler [49] specifying palindromic models
(total width of 16–24 bp), to generate a PurR motif (Fig-
ure 7) and a Crp motif (Figure 1). These figures show both
the nucleotide equilibrium and the information content
for each position of the motif [9].
Generation of the weak synthetic sequence data
To test the sensitivity and specificity of PhyloScan when
seeking binding sites that are weaker than E. coli Crp bind-
ing sites, we generated "1/2-strength" and "1/3-strength"
Crp sites. The 1/2-strength Crp motif was designed to have
an average information content per column that is half
PurR Binding Site MotifFigure 7
PurR Binding Site Motif. Shown is the PurR motif used to scan for PurR binding sites. The binding site equilibria were calcu-
lated from sequence data aligned by the Gibbs Recursive Sampler [49], and were plotted using publicly available software [27].
weblogo.berkeley.edu
0
1
2
bits
5′
1
T
G
A
2
T
A
G
C
3
C
A
G
4
T
A
C
5
G
C
A
6
C
A
7
T
C
A
8
C
9
G
10
G
A
T
11
G
T
12
G
C
T
13
A
T
G
14
T
G
C
15
A
T
C
G
16
A
C
T
3′
Algorithms for Molecular Biology 2007, 2:1 />Page 16 of 17
(page number not for citation purposes)
the average information content of the full-strength Crp
motif; we did this by raising each probability of a nucle-
otide to its 0.637
th
power, with subsequent scaling so that
the probabilities of the four nucleotides for any motif col-
umn sum to 1.0. Likewise, the 1/3-strength Crp sites were
generated from a 1/3-strength Crp motif to give one-third
the average information content, using an exponent of
0.507. See Figure 1 and its legend for more information.
Competing interests
The authors declare that they have no competing interests.
Authors' contributions
CSC implemented the Perl portions of the algorithm,
managed the input data, and collected the output data.
LAN designed and implemented the PhyloScan algorithm
in C++. LAM chose the specific transcription factors to
address, identified relevant input data and interpreted the
algorithm output. CEL conceived the study, and partici-
pated in its design and coordination. All authors contrib-
uted to and approved the final manuscript.
Additional material
Acknowledgements
We thank the Computational Molecular Biology and Statistics Core Facility
at the Wadsworth Center, and William Thompson and Sean Conlan for
helpful comments on the manuscript as well as throughout this project.
This research was supported by Department of Energy grants DE-FG02-
01ER63204 and DE-FG02-04ER63942 to GEL and LAM and by NIH grant
5K25HG003291 to LAN.
References
1. Stormo GD: DNA Binding Sites: Representation and Discov-
ery. Bioinformatics 2000, 16(1):16-23.
2. Quandt K, Frech K, Karas H, Wingender E, Werner T: MatInd and
MatInspector: New Fast and Versatile Tools for Detection of
Consensus Matches in Nucleotide Sequence Data. Nucleic
Acids Res 1995, 23(23):4878-4884.
3. Hertz GZ, Hartzell GW 3rd, Stormo GD: Identification of Con-
sensus Patterns in Unaligned DNA Sequences Known to be
Functionally Related. Comput Appl Biosci 1990, 6(2):81-92.
4. Chen QK, Hertz GZ, Stormo GD: MATRIX SEARCH 1.0: A
Computer Program that Scans DNA Sequences for Tran-
scriptional Elements using a Database of Weight Matrices.
Comput Appl Biosci 1995, 11(5):563-566.
5. Prestridge DS: SIGNAL SCAN 4.0: Additional Databases and
Sequence Formats. Comput Appl Biosci 1996, 12(2):157-160.
6. Kim JT, Gewehr JE, Martinetz T: Binding Matrix: A Novel
Approach for Binding Site Recognition. J Bioinform Comput Biol
2004, 2(2):289-307.
7. Yellaboina S, Seshadri J, Kumar MS, Ranjan A: PredictRegulon: A
Web Server for the Prediction of the Regulatory Protein
Binding Sites and Operons in Prokaryote Genomes. Nucleic
Acids Res 2004, 32:W318-320.
8. Osada R, Zaslavsky E, Singh M: Comparative Analysis of Methods
for Representing and Searching for Transcription Factor
Binding Sites. Bioinformatics 2004, 20(18):3516-3525.
9. Schneider TD, Stormo GD, Gold L, Ehrenfeucht A: Information
Content of Binding Sites on Nucleotide Sequences. J Mol Biol
1986, 188(3):415-431.
10. Staden R: Methods for Calculating the Probabilities of Finding
Patterns in Sequences. Comput Appl Biosci 1989, 5(2):89-96.
11. Neuwald AF, Liu JS, Lawrence CE: Gibbs Motif Sampling: Detec-
tion of Bacterial Outer Membrane Protein Repeats. Protein
Sci 1995, 4(8):1618-1632.
12. Moses AM, Chiang DY, Pollard DA, Iyer VN, Eisen MB: MONKEY:
Identifying Conserved Transcription-Factor Binding Sites in
Multiple Alignments Using a Binding Site-Specific Evolution-
ary Model. Genome Biol 2004, 5(12):R98. [PubMed 15575972].
13. Bell SD, Cairns SS, Robson RL, Jackson SP: Transcriptional Regu-
lation of an Archaeal Operon In Vivo and In Vitro. Mol Cell
1999, 4(6):971-982.
14. Rodionov DA, Mironov AA, Gelfand MS: Conservation of the
Biotin Regulon and the BirA Regulatory Signal in Eubacteria
and Archaea. Genome Res 2002, 12(10):1507-1516.
15. Studholme DJ, Pau RN: A DNA Element Recognised by the
Molybdenum-Responsive Transcription Factor ModE is Con-
served in Proteobacteria, Green Sulphur Bacteria and
Archaea. BMC Microbiol 2003, 3:24.
16. Storey JD, Tibshirani R: Statistical Significance for Genomewide
Studies. Proc Natl Acad Sci USA 2003, 100(16):9440-9445.
17. Mironov AA, Koonin EV, Roytberg MA, Gelfand MS: Computer
Analysis of Transcription Regulatory Patterns in Completely
Sequenced Bacterial Genomes. Nucleic Acids Res 1999,
27(14):2981-2989.
18. Panina EM, Mironov AA, Gelfand MS: Comparative Analysis of
FUR Regulons in Gamma-Proteobacteria. Nucleic Acids Res
2001, 29(24):5195-5206.
19. Panina EM, Vitreschak AG, Mironov AA, Gelfand MS: Regulation of
Aromatic Amino Acid Biosynthesis in Gamma-Proteobacte-
ria. J Mol Microbiol Biotechnol 2001, 3(4):529-543.
20. Rodionov DA, Mironov AA, Rakhmaninova AB, Gelfand MS: Tran-
scriptional Regulation of Transport and Utilization Systems
for Hexuronides, Hexuronates and Hexonates in Gamma
Purple Bacteria. Mol Microbiol 2000, 38(4):673-683.
21. Rodionov DA, Gelfand MS, Mironov AA, Rakhmaninova AB: Com-
parative Approach to Analysis of Regulation in Complete
Genomes: Multidrug Resistance Systems in Gamma-Proteo-
bacteria. J Mol Microbiol Biotechnol 2001, 3(2):319-324.
22. Laikova ON, Mironov AA, Gelfand MS: Computational analysis of
the transcriptional regulation of pentose utilization systems
Additional file 1
Additional Information. This file includes legends for Supplementary
Tables 2–4, which are included as additional files (see below). It includes
samples of calculations described in Methods.
Click here for file
[ />7188-2-1-S1.doc]
Additional file 3
Supplementary Table 3. This table lists the sites and the q-values for each
of the Crp binding site prediction experiments in Table 1 of the text.
Click here for file
[ />7188-2-1-S3.xls]
Additional file 4
Supplementary Table 4. This table lists the sites and the q-values for each
of the PurR binding site prediction experiments in Table 1 of the text.
Click here for file
[ />7188-2-1-S4.xls]
Additional file 2
Supplementary Table 2. This table lists the orthologs and the orthologous
intergenic regions used in this study.
Click here for file
[ />7188-2-1-S2.xls]
Publish with Bio Med Central and every
scientist can read your work free of charge
"BioMed Central will be the most significant development for
disseminating the results of biomedical research in our lifetime."
Sir Paul Nurse, Cancer Research UK
Your research papers will be:
available free of charge to the entire biomedical community
peer reviewed and published immediately upon acceptance
cited in PubMed and archived on PubMed Central
yours — you keep the copyright
Submit your manuscript here:
/>BioMedcentral
Algorithms for Molecular Biology 2007, 2:1 />Page 17 of 17
(page number not for citation purposes)
in the gamma subdivision of Proteobacteria. FEMS Microbiol
Lett 2001, 205(2):315-322.
23. Rajewsky N, Socci ND, Zapotocky M, Siggia ED: The Evolution of
DNA Regulatory Regions for Proteo-Gamma Bacteria by
Interspecies Comparisons. Genome Res 2002, 12(2):298-308.
24. Tan K, Moreno-Hagelsieb G, Collado-Vides J, Stormo GD: A Com-
parative Genomics Approach to Prediction of New Mem-
bers of Regulons. Genome Res 2001, 11(4):566-584.
25. McCue LA, Thompson W, Carmack CS, Ryan MP, Liu JS, Derbyshire
V, Lawrence CE: Phylogenetic Footprinting of Transcription
Factor Binding Sites in Proteobacterial Genomes. Nucleic
Acids Res 2001, 29(3):774-782.
26. McCue LA, Thompson W, Carmack CS, Lawrence CE: Factors
Influencing the Identification of Transcription Factor Bind-
ing Sites by Cross-Species Comparison. Genome Res 2002,
12(10):1523-1532.
27. About WebLogo [ />]
28. Halpern AL, Bruno WJ: Evolutionary Distances for Protein-
Coding Sequences: Modeling Site-Specific Residue Frequen-
cies. Mol Biol Evol 1998, 15(7):910-917.
29. Kimura M: A Simple Method for Estimating Evolutionary
Rates of Base Substitutions through Comparative Studies of
Nucleotide Sequences. J Mol Evol 1980, 16(2):111-120.
30. Edgar RC: MUSCLE: multiple sequence alignment with high
accuracy and high throughput. Nucleic Acids Res 2004,
32(5):1792-1797.
31. Felsenstein J: PHYLIP (Phylogeny Interface Package) 3.5c 1993 [http://
evolution.genetics.washington.edu/phylip.html]. Seattle, WA: Depart-
ment of Genetics, University of Washington
32. Bailey TL, Gribskov M: Methods and Statistics for Combining
Motif Match Scores. J Comput Biol 1998, 5(2):211-221.
33. Berman BP, Nibu Y, Pfeiffer BD, Tomancak P, Celniker SE, Levine M,
Rubin GM, Eisen MB: Exploiting Transcription Factor Binding
Site Clustering to Identify Cis-Regulatory Modules Involved
in Pattern Formation in the Drosophila Genome. Proc Natl
Acad Sci USA 2002, 99(2):757-762.
34. Li SL, Valente AJ, Qiang M, Schlegel W, Gamez M, Clark RA: Multiple
PU.l Sites Cooperate in the Regulation of p40(phox) Tran-
scription During Granulocytic Differentiation of Myeloid
Cells. Blood 2002, 99(12):4578-4587.
35. Newberg LA, Lawrence CE: Mammalian genomes ease location
of human DNA functional segments but not their descrip-
tion. Stat Appl Genet Mol Biol 2004, 3:Article23.
36. Efron B, Tibshirani R, Storey JD, Tusher V: Empirical Bayes Anal-
ysis of a Microarray Experiment. J Am Stat Assoc 2001,
96(456):1151-1160.
37. The PhyloScan Hompage [ />loScan]
38. Neyman J: Molecular Studies of Evolution: A Source of Novel
Statistical Problems. In Statistical Decision Theory and Related Topics
Edited by: Gupta SS, Yackel J. New York, NY: Academic Press;
1971:1-27.
39. Felsenstein J: Evolutionary Trees from DNA Sequences: A
Maximum Likelihood Approach. J Mol Evol 1981, 17(6):368-376.
40. Neuwald AF, Green P: Detecting Patterns in Protein
Sequences. J Mol Biol 1994, 239(5):698-712.
41. Frith MC, Spouge JL, Hansen U, Weng Z: Statistical Significance
of Clusters of Motifs Represented by Position Specific Scor-
ing Matrices in Nucleotide Sequences. Nucleic Acids Res 2002,
30(14):3214-3224.
42. Pruitt KD, Maglott DR: RefSeq and LocusLink: NCBI Gene-
Centered Resources. Nucleic Acids Res 2001, 29:137-140.
43. Remm M, Storm CE, Sonnhammer EL: Automatic clustering of
orthologs and in-paralogs from pairwise species compari-
sons. J Mol Biol 2001, 314(5):1041-1052.
44. Altschul SF, Madden TL, Schaffer AA, Zhang J, Zhang Z, Miller W, Lip-
man DJ: Gapped BLAST and PSI-BLAST: A New Generation
of Protein Database Search Programs. Nucleic Acids Res 1997,
25(17):3389-3402.
45. Jukes TH, Cantor C: Evolution of Protein Molecules. In Mamma-
lian Protein Metabolism Volume 3. Edited by: Munro HM. New York,
NY: Academic Press; 1969:21-132.
46. Smith TF, Waterman MS: Comparison of biosequences. Adv Appl
Math 1981, 2:482-489.
47. Salgado H, Gama-Castro S, Martinez-Antonio A, Diaz-Peredo E,
Sanchez-Solano F, Peralta-Gil M, Garcia-Alonso D, Jimenez-Jacinto V,
Santos-Zavaleta A, Bonavides-Martinez C, Collado-Vides J: Regu-
lonDB (Version 4.0): Transcriptional Regulation, Operon
Organization and Growth Conditions in Escherichia coli K-
12. Nucleic Acids Res 2004, 32(Database Issue):D303-D306.
[PubMed 14681419].
48. Robison K, McGuire AM, Church GM: A Comprehensive Library
of DNA-Binding Site Matrices for 55 Proteins Applied to the
Complete Escherichia coli K-12 Genome. J Mol Biol 1998,
284(2):241-254.
49. Thompson W, Rouchka EC, Lawrence CE: Gibbs Recursive Sam-
pler: Finding Transcription Factor Binding Sites. Nucleic Acids
Res 2003, 31(13):3580-3585.