Báo cáo sinh học: "Noisy: Identification of problematic columns in multiple sequence alignments" pps
Bạn đang xem bản rút gọn của tài liệu. Xem và tải ngay bản đầy đủ của tài liệu tại đây (342.27 KB, 10 trang )
BioMed Central
Page 1 of 10
(page number not for citation purposes)
Algorithms for Molecular Biology
Open Access
Software article
Noisy: Identification of problematic columns in multiple sequence
alignments
Andreas WM Dress
1,2
, Christoph Flamm
3
, Guido Fritzsch
4,5
,
Stefan Grünewald
1,2
, Matthias Kruspe
5
, Sonja J Prohaska*
3,6,7
and
Peter F Stadler
8,5,9,3,6
Address:
1
Department of Combinatorics and Geometry (DCG), MPG/CAS Partner Institute for Computational Biology (PICB), Shanghai Institutes
for Biological Sciences (SIBS), Shanghai, PR China,
2
Max Planck Institute for Mathematics in the Sciences, Inselstrasse 22 -26, D 04103 Leipzig,
Germany,
3
Institut für Theoretische Chemie und Molekulare Strukturbiologie Universität Wien, Währingerstraße 17, A-1090 Wien, Austria,
4
Institute of Biology II: Zoologie, Molekulare Evolution und Systematik der Tiere, University of Leipzig, Talstrasse 33, D-04103 Leipzig, Germany,
5
Interdisciplinary Center for Bioinformatics, Universität Leipzig, Härtelstraße 16-18, D-04107 Leipzig, Germany,
6
Santa Fe Institute, 1399 Hyde
Park Rd., Santa Fe NM 87501, USA,
7
Biomedical Informatics, Arizona State University, PO-Box 878809, Tempe, AZ 85287, USA,
8
Bioinformatics
Group, Department of Computer Science, Universität Leipzig, Härtelstraße 16-18, D-04107 Leipzig, Germany and
9
RNomics Group, Fraunhofer
Institut for Cell Therapy and Immunology (IZI), Perlickstraße 1, D-04103 Leipzig, Germany
Email: Andreas WM Dress - ; Christoph Flamm - ; Guido Fritzsch - ;
Stefan Grünewald - ; Matthias Kruspe - ; Sonja J Prohaska* - ;
Peter F Stadler -
* Corresponding author
Abstract
Motivation: Sequence-based methods for phylogenetic reconstruction from (nucleic acid)
sequence data are notoriously plagued by two effects: homoplasies and alignment errors. Large
evolutionary distances imply a large number of homoplastic sites. As most protein-coding genes
show dramatic variations in substitution rates that are not uncorrelated across the sequence, this
often leads to a patchwork pattern of (i) phylogenetically informative and (ii) effectively randomized
regions. In highly variable regions, furthermore, alignment errors accumulate resulting in
sometimes misleading signals in phylogenetic reconstruction.
Results: We present here a method that, based on assessing the distribution of character states
along a cyclic ordering of the taxa, allows the identification of phylogenetically uninformative
homoplastic sites in a multiple sequence alignment. Removal of these sites appears to improve the
performance of phylogenetic reconstruction algorithms as measured by various indices of "tree
quality". In particular, we obtain more stable trees due to the exclusion of phylogenetically
incompatible sites that most likely represent strongly randomized characters.
Software: The computer program noisy implements this approach. It can be employed to
improving phylogenetic reconstruction capability with quite a considerable success rate whenever
(1) the average bootstrap support obtained from the original alignment is low, and (2) there are
sufficiently many taxa in the data set – at least, say, 12 to 15 taxa. The software can be obtained
under the GNU Public License from />Published: 24 June 2008
Algorithms for Molecular Biology 2008, 3:7 doi:10.1186/1748-7188-3-7
Received: 8 April 2008
Accepted: 24 June 2008
This article is available from: />© 2008 Dress et al; licensee BioMed Central Ltd.
This is an Open Access article distributed under the terms of the Creative Commons Attribution License ( />),
which permits unrestricted use, distribution, and reproduction in any medium, provided the original work is properly cited.
Algorithms for Molecular Biology 2008, 3:7 />Page 2 of 10
(page number not for citation purposes)
Introduction
Sequence conservation in real data often varies dramati-
cally along multiple sequence alignments ranging from
constant sites to sequence positions that have effectively
been randomized. In the context of phylogenetic recon-
struction, homoplastic sites – i.e., those in which the same
character appears in two distinct sequences by conver-
gence (back- and parallel-mutation) rather than by com-
mon ancestry – pose a well-known problem. Depending
on the method, in the worst case they present a mislead-
ing signal (as in the case of parsimony methods), at best
they increase the noise in the data (as in most distance-
based methods). In addition, alignment errors producing
effectively "homoplastic sites" are known from simula-
tion studies to decrease the accuracy of the reconstruction
of tree topologies [1]. For real data, ref. [2] showed that
alignment errors can change the result of a phylogenetic
analysis significantly.
Consequently, one may try to improve the accuracy of tree
reconstruction by eliminating all putative homoplastic or
otherwise corrupted sites, e.g., all third-codon positions of
protein-coding genes. However, since the quality of tree
reconstruction decreases with decreasing sequence length,
it is important not to remove too many sites from an
alignment. For example, while certain first- and second-
codon positions may be essentially constant (and there-
fore phylogenetically useless) or hyper-variable (and
hence even misleading), third-codon positions of protein-
coding genes can well be informative and should not be
just discarded as such [3]. There is no consensus in the lit-
erature regarding the tolerance of phylogenetic methods
to multiple substitutions [4,5].
Given any alignment, it is therefore of interest to detect
clearly homoplastic or otherwise corrupted sites from
putative phylogenetically informative sites so that they –
and no others – can be excluded or down-weighted. The
complication with such an endeavor, however, is that, for-
mally, homoplasy is defined relative to a given phyloge-
netic tree while it is exactly a phylogenetic tree that
molecular phylogenetics is attempting to derive from an
alignment. Thus, care has to be taken that homoplasy
detection does not implicitly presuppose a phylogenetic
tree later to be derived from the same data.
Character compatibility [6] can be used to identify fast
evolving sites [7,8]. Two alignment columns are compati-
ble if there is a phylogenetic tree for which both columns
are homoplasy-free. Fast-evolving sites are expected to be
incompatible with more columns than slowly evolving
ones. Consequently, sites that have more incompatibili-
ties than random sites are removed from the alignment
[9]. If there are conflicting signals in the data, sites sup-
porting the weaker one tend to be removed. Several meth-
ods simply delete the most highly variable alignment
columns [10,11], the S-F approach [12] presupposes well-
established groups and evaluates within-group variation
relative to between-groups variation.
In this contribution, we present a new method for deter-
mining "noisy" sites in an alignment that is not a priori
restricted to tree-like data. It is based on the observation
that distances derived from pairwise sequence compari-
sons give rise to fairly robust circular split systems [13]
which, in turn, are consistent with a large number of pos-
sible tree topologies [14,15]. We only use the cyclic order-
ing of the taxa which some methods constructing circular
split systems compute in their first step, not a recon-
structed tree, to assess the degree to which an alignment
site is randomized. A computer program, called noisy,
implements this approach.
Trees, metrics, and weighted split systems
Let X denote a finite set of n taxa. A split S = A| = |A
is a bipartition of the set X of taxa, i.e., a partition of X into
two disjoint, non-empty subsets A and . Two such splits
A
1
| and A
2
| of X are called compatible if one of the
four intersections A
1
∩ A
2
, A
1
∩ , ∩ A
2
and ∩
is empty. A split system is compatible if every pair of
splits is compatible.
It is a well known result that compatible split systems on
X are in 1-1 correspondence with the so-called X-trees
[16], i.e., finite trees T = (V, E) with vertex set V and edge
set E endowed with a map from X into V whose image
contains (at least) all vertices of degree less than 3.
More specifically, this correspondence is given by associ-
ating
(i) to any edge e ∈ E of such a tree T, the bipartition S
e
of
X into those two subsets of X that are mapped into the
(exactly) two distinct connected components of the graph
obtained from T by deleting the edge e,
(ii) and to T the collection (T) := {S
e
: e ∈ E} of all such
splits.
Associating a positive weight
α
S
to any such split S = A|
(e.g., the length of the edge e in case every edge in the tree
is endowed with some predefined positive length and S =
S
e
holds), one can define the associated metric d on X by
associating, to any two taxa x, y in X, the term
A
A
A
A
1
A
2
A
2
A
1
A
1
A
2
A
Algorithms for Molecular Biology 2008, 3:7 />Page 3 of 10
(page number not for citation purposes)
where one puts, for any split S = A| ∈ (T) and all x, y
∈ X,
δ
S
(x, y) := 0 if x, y ∈ A or x, y ∈ holds, and
δ
S
(x,
y) := 1 otherwise (i.e., if x and y are separated by the split
S) implying that d(x, y) is the total length of the unique
path from (the image of) x to (the image of) y relative to
the given family of split weights .
It is our goal to detect homoplasy without first determin-
ing a tree; thus we have to admit more general split sys-
tems. We use circular split systems which we will
introduce next.
Noise detection using circular orderings
A split system is circular if the points in X (i.e., the taxa)
can be arranged on a circle so that each split S ∈ is
induced by a division of that circle into two arcs by delet-
ing two of its (unlabeled) points. In this case, the circular
ordering is said to represent the split system.
It is easy to verify that compatible split systems are circular
(actually, every planar drawing of an X-tree provides such
a circular ordering), and that circular split systems are
weakly compatible – i.e., A
1
∩ A
2
∩ A
3
, A
1
∩ ∩ ,
∩ A
2
∩ or ∩ ∩ A
3
is empty for any three splits
A
1
|, A
2
|, A
3
| in a circular split system, cf. [13].
Any distance constructed from a weighted circular split
system is called a "circular" (or Kalmanson) metric.
It has been observed that phylogenetic distance data are
often circular or at most mildly non-circular [14,17,18].
Starting from a suitable distance measure, we can con-
struct a circular split system from an alignment without
significantly prejudicing later tree constructions since the
circular split system still represents essentially unfiltered
data.
Prescribing a circular order C, of course, restricts the pos-
sible phylogenetic trees. Indeed, the fraction of
fully resolved trees compatible with a given ordering goes
to zero with the number n of leaves going to infinity. On
the other hand, given any circular ordering, there are quite
a few - more precisely, there are exactly - fully
resolved trees that are compatible with it [15]. Further-
more, if the true phylgenetic tree T is not compatible with
the pre-supposed circular order C, we can still expect that
T will be compatible with a circular order C' that differs
from C by only a small number of breakpoints – after all,
we will compute C from the data that have evolved
according to T . Hence, characters that are informative for
T (and thus for C
'
) can be expected not to "look random"
when arranged according to C instead of C
'
. Thus, circular
orders appear to offer a robust way to assess the "phyloge-
netic information content" of characters (alignment col-
umns) without strongly prejudicing the subsequent tree
construction. Circular split systems can be obtained in
various ways. The computationally most straightforward
approach is the Neighbor-Net algorithm [19] that starts
from a distance matrix. It computes the circular splits
using an agglomerative procedure.
An alternative approach starts from weighted quartets. To
this end, one first computes a weight for each quartet, i.e.,
each pair of two pairs of taxa, {{a, b} {c, d}}. This quartet
weight is interpreted as the support for the hypothesis that
{a, b} and {c, d} are separated by an edge in the correct
phylogenetic tree. Quartet weights can be obtained in var-
ious ways. In the quartet-mapping approach [20] for exam-
ple, one starts with an alignment of four sequences and
defines the weight of a given quartet to be the fraction of
alignment sites (columns) in which a = b ≠ c = d. One may
modify this score by adding 1/2 for every additional col-
umn in which a = b ≠ c, d or c = d ≠ a, b holds. Quartet
weights can also be derived directly from distances
(although, in this case, it seems preferably to use the faster
Neighbor-Net approach). A more sophisticated weighting
scheme uses "expected branch lengths", i.e. the product of
the posterior likelihood and the maximum likelihood
branch length of the interior edge of the corresponding
quartet tree.
The quartet {{a, b} {c, d}} is said to be realized by a cyclic
ordering of X if the straight line connecting a and b and
the straight line connecting c and d do not intersect in the
interior of the circle. There is a circular split system repre-
sented by a given cyclic ordering that contains a split that
separates a and b from c and d if and only if {{a, b} {c, d}}
is realized by that cyclic ordering. Hence, to ensure that as
much quartet information as possible is represented,
QNet [21] tries to find a cyclic ordering such that the sum
of the weights of all realized quartets is maximal.
Both, Neighbor-Net and QNet, use the same agglomera-
tion process to construct a cyclic ordering. While Neigh-
bor-Net tries to group those taxa close to each other that
have a small distance, QNet tries to construct a cyclic
ordering that maximizes the sum of the weights of the
dxy xy
SS
ST
(,): (,)
()
=
∈
∑
αδ
A
A
()
()
α
SS T∈
A
2
A
3
A
1
A
3
A
1
A
2
A
1
A
2
A
3
2
2
1
n
n
−
−()!
1
1
24
2
n
n
n
−
−
−
⎛
⎝
⎜
⎞
⎠
⎟
Algorithms for Molecular Biology 2008, 3:7 />Page 4 of 10
(page number not for citation purposes)
quartets it realizes. Hence, both methods construct cyclic
orderings with the property that groups of phylogeneti-
cally closely related taxa tend to assemble along an arc.
Neighbor-Net and QNet are both consistent, i.e., if the dis-
tances or quartet weights correspond to a circular split sys-
tem, then they find a cyclic ordering that represents that
split system [22,23].
For our purpose, the important property of the circular
orderings computed by Neighbor-Net and Qnet is that
phylogenetically more closely related taxa are preferen-
tially placed closer together in the cyclic ordering. Thus, if
a character
χ
=
χ
i
(defined by some alignment site i in a
given alignment) is phylogenetically "useful", its character
states will appear "clustered" along the cyclic ordering,
independent of the details of the branching order in indi-
vidual subtrees. In contrast, if a character is completely
randomized, we will observe that character states are ran-
domly arranged along the cycle. The amount of clustering
can be easily quantified by the number
ν
=
ν
(C,
χ
) of
adjacent distinct character states along the cycle C. We
have
ν
= 0 for constant sites, and
ν
≥ 2 for all non-constant
sites. This number has to be compared with the numbers
expected for a random distribution of character values
along the cycle, given the overall distribution of the char-
acter values of
χ
. It is in principle possible to compute this
distribution.
For two-state characters, a formula for the number of
options to putting v ones and n - v zeros on a cycle of
length n such that there are 2k ≤ min{2v, 2(n - v)} break-
points (an odd number of breakpoints is impossible) is
easy to derive: There are such options.
The explicit evaluation of such expressions is relatively
expensive, however. Alternatively, very large tables would
need to be pre-computed and stored to accomodate large
numbers of sequences and/or character states.
Therefore, we opted for a shuffling procedure instead: we
randomly generate a cyclic ordering C' of the same charac-
ter states (and their respective frequencies) as those in C
and compute the fraction q = q(C,
χ
) of randomized sam-
ples with
ν
(C',
χ
) >
ν
(C,
χ
). Hence we can interpret q as a
reliability measure for the phylogenetic information con-
tained in the alignment site (relative to C). Note that we
obtain q = 0 for constant and singleton sites, which are
phylogenetically uninformative and q 0.5 for effectively
randomized sites. Sites with q << 0.5 are "worse" then ran-
dom and contradict the given cyclic ordering while sup-
port for the ordering is found in sites with q Ŭ 0.5.
The program noisy executes the following commands:
1. Compute the cyclic ordering C from the input data
using either Qnet or NeighborNet.
2. For each character
χ
• Compute the number
ν
(C,
χ
) of break points.
• Compute N random cyclic orderings C'.
• For each cyclic ordering compute
ν
(C',
χ
).
• Compute the fraction q(C,
χ
) of random orderings with
ν
(C',
χ
) >
ν
(C,
χ
).
3. If q(C,
χ
) is smaller than a given threshold, then remove
the character
χ
.
The program noisy is implemented in ISO C++ and the
source code is available for download from http://
www.bioinf.uni-leipzig.de/Software/noisy/. In a first
phase, a cyclic ordering of the taxa set is computed. For
this purpose, noisy includes the corresponding subset of
routines from the NeighborNet [19] and the QNet [21]
packages. Subsequently, a reliability score q for each char-
acter is calculated. The number of character-state altera-
tions is counted and compared to the observed count in
random shufflings. The uniform pseudo-random number
generator Mersenne Twister [24] is used to generate the
random shufflings.
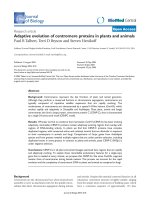
In order to assess whether the cyclic orderings obtained
using QNet and NeighborNet reduce the fraction of unin-
terpretable variation, we performed the following rand-
omization experiment. Given an alignment, we generated
all possible cyclic orderings and computed the fraction r
of sites with q > 0.8 among all variable sites in the align-
ment. As shown in Fig. 1, QNet and NeighborNet nearly
minimize the fraction of "noisy" alignment sites for the 10
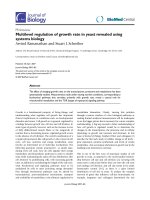
squamate mitochondria. The program noisy exports a
Postscript file, visualizing the quality of the sites of the
reordered input alignment (see Fig. 2), recording their
reliability score as xy-data, and containing a modified
alignment for further analysis in which sites with reliabil-
ity q <q
cutoff
are removed. Fig. 2 shows typical examples for
the distribution of alignment sites with low and high reli-
ability scores q.
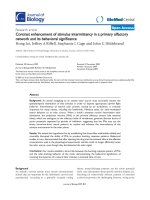
Computational results
As an example for the effect of removing "noisy" sites, we
consider a data set of combined 28S rRNA, 16S rRNA, and
mitochondrial COI sequences of spatangoid sea urchins
that was reported to have a high level of homoplasy [25].
The "raw" sequence alignments lead to phylogenetic trees
that differ significantly for different methods and disagree
substantially with morphology-based results. As discussed
n
k
v
k
nv
k
−
−
⎛
⎝
⎜
⎞
⎠
⎟
−−
−
⎛
⎝
⎜
⎞
⎠
⎟
1
1
1
1
Algorithms for Molecular Biology 2008, 3:7 />Page 5 of 10
(page number not for citation purposes)
in the original paper [25], manual removal of homoplas-
tic sites improved the trees considerably. The application
of noisy with cutoff q
cutoff
= 0.8, on the other hand, leads
to consistent results for all methods including MP (Maxi-
mum Parsimony) that agree with the best trees reported in
[25]. In Fig. 3 we present the MP trees for the unedited and
the noisy-reduced alignments.
In order to assess to what extent the removal of unreliable
sites from real and simulated alignments affects the com-
monly used measures of tree stability, we consider the q
cut-
off
-dependency of the most common indices for tree
quality. Phylogenies were computed using maximum par-
simony and neighbor joining (Kimura 2-parameter
model) as implemented in PAUP 4.0b10 [26]. Scaled log-
likelihood score (i.e., the log likelihood divided by the
length of the alignment), homoplasy index (HI) [27],
rescaled consistency index (RC) [28], and average boot-
strap support (over all internal vertices) were used to
assess the tree stability while topological changes were
described by split distance [29]. Data sets are available for
download as part of the Electronic supplement [30].
Fig. 4 summarizes the data for alignments of mitochon-
drial protein-coding genes. The other data sets show the
same qualitative behavior. Table 1 shows that the fraction
of effectively randomized sites varies considerably (from
26% to 37%) between different proteins even in the rela-
tively benign case of mitochondrial genomes [31]. As
expected, the homoplasy index is significantly reduced
while the rescaled consistency index and the scaled log-
likelihood values increases with increasing values of q
cut-
off
. While the tree-stability indices improve consistently
indicating that the reconstructions become more stable,
the absolute values of the quality indices nevertheless
depend strongly on the size and quality of the input align-
ments.
Ref. [32] suggested another way to estimate the phyloge-
netic information content of an alignment. To this end,
they determined the skewness-test statistics g
1
of the corre-
sponding tree-length distribution. We analyzed the data
with the random-tree option implemented in PAUP
4.0b10 [26]. For the data matrices, we estimated 100.000
trees at random from all possible tree topologies (replace-
ments allowed). The results are consistent with the tree
statistics discussed above. As expected, we observe that g
1
becomes more negative with increasing values of q
cutoff
, at
least as long as one does not start to remove too many
informative sites (data not shown).
Number of cyclic orderings of a set 10 complete mitochondrial genomes with a prescribed fraction of "noisy" characters, i.e., q(C,
χ
) ≤ 0.8)Figure 1
Number of cyclic orderings of a set 10 complete mitochondrial genomes with a prescribed fraction of "noisy"
characters, i.e., q(C,
χ
) ≤ 0.8). The cyclic orderings computed by NeighborNet or QNet indeed essentially minimize the
fraction of putative randomized alignment sites. At least in this example, QNet with quartet-mapping-derived quartet weights
performs best. "ClustalW" refers to the circular ordering implicitly constructed by ClustalW from its guide tree which deter-
mines the order in which sequences and profiles are combined to yield the final alignment.
Fraction of noisy positions
Number of circular orderings
0.64 0.66 0.68 0.70 0.72 0.74
0
5000 10000 15000 20000
NeighborNet
ClustalW
QNet/QM
Algorithms for Molecular Biology 2008, 3:7 />Page 6 of 10
(page number not for citation purposes)
An alternative measure for the stability of a phylogenetic
reconstruction is the bootstrap support for trees – result-
ing, in our case, from neighbor joining [33]. In some
cases, the improvement can be substantial, as in the case
of a Dytiscus data set provided in the supplement, where
the average bootstrap support increases from 47 to 68
(neighbor-joining trees computed using PAUP 4.0b10
and 2000 bootstrap replicates [34,35]). In benign data
sets, however, the changes are typically small.
In order to study the effect of removing putative homo-
plastic sites in a more systematic way, we generated artifi-
cial data sets for caterpillar and balanced trees with 4 to 29
taxa using dawg [36]. Fig. 5 shows the variation of the
bootstrap support relative to the cutoff value q. Pairs of
caterpillar and balanced trees with the same number of
taxa were constructed such that (a) all leaves have the
same evolutionary distance from the root and (b) all inter-
nal edges as well as all edges leading to leaves with maxi-
mal depth (maximal number of internal nodes on the
path to the root) have the same "unit length". This unit
length is set to 0.4 substitutions per site for the balanced
trees. In the caterpillar trees the "unit length" is scaled
such that the total length equals that of the balanced tree
with the same number of species. For each tree, we then
used dawg to generate 100 independent alignments using
the following parameters: alignment length 800 nt, GTR
model with
γ
= 0.5 and
ι
= 0.1, and dawg's default substi-
Distribution of homoplastic sites for the mitochondrial atp6 gene of squamata (2047 positions, above) and for 18S RNA of Coleoptera from an analysis of [37] (684 positions, below)Figure 2
Distribution of homoplastic sites for the mitochondrial atp6 gene of squamata (2047 positions, above) and for 18S RNA of
Coleoptera from an analysis of [37] (684 positions, below). In terms of quality, the two data sets are very different. While the
majority of sites in atp6 are parsimony informative and approximately one third of the sites have a reliability score above q
cutoff
= 0.8, this is clearly not the case for the data set by [37] where most of the sites are constant or unreliable. The black bar
below the alignment indicates whether the q-value of the corresponding position is above (upper half) or below (lower half)
the cutoff value. Note that only green positions have a chance to having q-value above the cutoff value.
missing data constant site singleton site parsimony informative site
50
100
150
200
250
300
350
400
450
500
550
600
650
100
200
300
400
500
600
700
800
900
1000
1100
1200
1300
1400
1500
1600
1700
1800
1900
2000
Algorithms for Molecular Biology 2008, 3:7 />Page 7 of 10
(page number not for citation purposes)
tution matrix for the GTR model. We observe a pro-
nounced maximum of bootstrap support whose position
and height, however, depends strongly on both, the
number of taxa and the topology of the tree. For small val-
ues of q
cutoff
, alignment stability increases because only
the most "noisy" sites are removed. (In contrast, tree sta-
MP trees of spatangoid sea urchins from combined 28S rRNA, 16S rRNA, and mitochondrial COI sequences [25]Figure 3
MP trees of spatangoid sea urchins from combined 28S rRNA, 16S rRNA, and mitochondrial COI sequences [25]. L.h.s. from
original data, r.h.s. from a reduced alignment with cutoff q = 0.8. The latter tree matches the biological expectation and fits very
well with those reported in [25] that were obtained from a manually reduced alignment. In particular, the noisy-reduced MP
tree correctly shows Brissopsis and Allobrissus as sister groups and it correctly identifies the large monophyletic clade consisting
of the Linopneustes/Metalia and Lovenia/Spatangus groups to the exclusion of Meoma and Archeopneustes. These major improve-
ments are marked with a bullet. The included table compares the stability indices (HI = homoplasy index, RC = rescaled con-
sistency index, RI = retention index) between the complete (unprocessed), Stockley's manually improved, and the noisy-
reduced alignment.
2528
543
0.54
0.41
0.19
raw
2227
465
0.59
0.44
0.20
noisy
2076
260
0.50
0.56
0.28RC
RI
HI
PI−sites
length
Stockley
Conolampas sigsbei
Echinoneus cyclostomus
Paraster doederleini
Archeopneustes hystrix
Spantagus matheyi
Spantagus raschi
Paramaretia multituerculata
Echinocardia laevigaster
Lovenia cordiformis
Allobrissus agassizii
Metalia spatagus
Plagiobrissus grandis
Linopneustes longispinus
Meoma ventricosa
Brissopsis atlantica
Paleopneustes cristatus
Brisaster fragilis
Amphipneustes lorioli
Abatus cavernosus
Amphipneustes lorioli
Abatus cavernosus
Brisaster fragilis
Paleopneustes cristatus
Allobrissus agassizii
Brissopsis atlantica
Meoma ventricosa
Linopneustes longispinus
Plagiobrissus grandis
Metalia spatagus
Lovenia cordiformis
Echinocardia laevigaster
Paramaretia multituerculata
Spantagus raschi
Spantagus matheyi
Archeopneustes hystrix
Paraster doederleini
Echinoneus cyclostomus
Conolampas sigsbei
Dependency of tree-quality indices on the cut-off value q
cutoff
for the protein-coding mitochondrial genes from all 31 currently available squamataFigure 4
Dependency of tree-quality indices on the cut-off value q
cutoff
for the protein-coding mitochondrial genes from
all 31 currently available squamata. The stability of the trees is measured by the scaled log likelihood (ln L)/n, the homo-
plasy index (HI) [27], and the rescaled consistency index (RC) [28] as computed by PAUP 4.0b10 [26]. Data sets are alignments
(supplied in the electronic supplement) of individual mitochondrial protein-coding genes. They vary in size (from about 170 to
1800 nt) and randomization.
0.0 0.2 0.4 0.6 0.8 1.0
q
cutoff
-30
-25
-20
-15
-10
(ln L)/n
0.0 0.2 0.4 0.6 0.8 1.0
q
cutoff
0.05
0.10
0.15
0.20
0.25
Rescaled consistency (RC)
0.0 0.2 0.4 0.6 0.8 1.0
q
cutoff
0.64
0.66
0.68
0.70
0.72
0.74
0.76
Homoplasy index (HI)
ND1
ND2
ND6
ND3
COX2
ATP8
ND5
CYTB
ATP6
ND4
ND4L
COX1
COX3
Algorithms for Molecular Biology 2008, 3:7 />Page 8 of 10
(page number not for citation purposes)
bility decreases immediately when randomly chosen
alignment columns are removed; data not shown). For
large values of q
cutoff
, tree stability starts to decrease again
because noisy starts to remove too many informative sites.
Empirically, we found for large data sets that q
cutoff
≈ 0.8 is
a good compromise between these two effects. In princi-
ple, an optimal cut-off value could be estimated, provided
a well-curated training set was available. For small data
sets, with less than 15 taxa, we found no improvements
except for rather small q
cutoff
values reflecting the fact that,
for small data sets, there are not too many possibilities for
the values of
ν
(C,
χ
) implying that noisy should be used
only for at least moderately large data sets.
In general, the caterpillar trees admit larger improvements
in bootstrap support than the balanced ones. We remark
that the balanced trees are almost correctly reconstructed
while the caterpillar trees are poorly reconstructed, in par-
ticular at the deep nodes (data not shown).
A systematic analysis of the effects of tree shape and
branch length distributions will be given elsewhere. We
will also discuss in that note how our algorithm can be
used to deal with the alignment problems addressed in
[2].
Discussion
It has been argued repeatedly that saturated – homoplas-
tic – characters are detrimental to phylogeny reconstruc-
tion and, thus, should be removed from multiple
Table 1: Randomized sites (at q
cutoff
= 0.8) in the 13 different
individual protein-coding genes within the 31 currently available
complete mitochondrial genomes of squamata. sngl: number of
singleton positions, %rnd: percentage of randomized variable
sites.
Gene length sngl q ≥ 0.8 %rnd
atp6 684 42 405 34.65
atp8 171 7 108 32.75
cox1 1536 88 1008 28.65
cox2 672 34 443 29.02
cox3 786 45 516 28.63
cytb 1131 74 676 33.69
nd1 942 44 589 32.80
nd2 1032 63 626 33.24
nd3 345 11 222 32.46
nd4 1371 65 831 34.65
nd4l 288 16 183 30.90
nd5 1803 103 1040 36.61
nd6 540 25 373 26.30
The relative average bootstrap support of phylogenetic trees is computed as the ratio of the average bootstrap support for the modified alignments divided by the bootstrap support obtained from the original alignmentFigure 5
The relative average bootstrap support of phylogenetic trees is computed as the ratio of the average boot-
strap support for the modified alignments divided by the bootstrap support obtained from the original align-
ment. Values larger than 1 indicate an increase in tree robustness. The curves show a distinct maximum that depends on the
number of taxa and the topology of the tree. The maximum improvement increases with the number of taxa (indicated on the
right margin of both panels for the highlighted curves). For clarity, error bars obtained from 100 replicates are shown only for
N = 10 and N = 25 taxa. The tree topologies, caterpillar trees on the left and balanced trees on the right, are depicted by the
insets.
0.0 0.2 0.4 0.6 0.8 1.0
q cutoff
0.60
0.80
1.00
1.20
1.40
relative average bootstrap support
8
10
15
20
25
0.0 0.2 0.4 0.6 0.8 1
.0
q cutoff
0.80
0.90
1.00
1.10
relative average bootstrap support
10
15
20
25
Algorithms for Molecular Biology 2008, 3:7 />Page 9 of 10
(page number not for citation purposes)
sequence alignments [5]. Since homoplasy is defined rel-
ative to the unknown true tree, it is not obvious, however,
how to reliably identify the homoplastic characters with-
out prior knowledge of that tree. In this note, we show
that cyclic orderings that can be obtained robustly, e.g.,
from pairwise distance data, without detailed knowledge
of the correct phylogenetic relationships can be employed
for this task. Given a circular ordering that is consistent
with the phylogeny, the variation of character states of a
given site along the circle is used to determine the (puta-
tive) degree of its randomization. This information can
then be used to prune the sequence alignment. The com-
puter program noisy that is publicly available from the
authors' website implements this procedure.
High rates of substitutions not equally distributed among
sites in the sequences caused, e.g., by sequence constraints
due to environmental pressure can produce a considera-
ble amount of phylogenetic noise in the data and so-
called "bad" and phylogenetically misleading alignments.
Such alignments can be improved by increasing the sig-
nal-to-noise ratio through exclusion of noisy sites. Align-
ment modifications like concatenation of conserved
blocks, known to improve phylogenetic analysis and car-
ried out manually, are common practice. However, man-
ual improvements are almost impossible for large-size
alignments, and typically make it hard to reproduce the
results later on. Furthermore, they are not immune to the
effects of wishful thinking. On the other hand, a method
such as noisy provides an essentially deterministic and
unbiased solution.
It is important to note that "good" alignments cannot be
further improved by the reduction of alignment length.
While especially distance-based methods for phylogenetic
reconstruction are fairly robust and can tolerate a good
fraction of phylogenetically uninformative sites (see in
particular [1]), a high absolute number of informative
sites is necessary to obtain reliable trees.
The analysis of artificial data sets allows us to propose a
set of simple rules that allow the user to decide under
which conditions it makes sense to use noisy to process
multiple sequence alignments prior to using them for
phylogenetic reconstruction:
(1) If the original alignment already yields trees with very
high average bootstrap support, there is nothing to be
gained from our method.
(2) Data-sets with less than about 10 taxa are unlikely to
improve.
(3) The cutoff value of q depends on the tree topology and
in particular on the number of taxa. It pays to determine
the maximum of the gain as a function of q and to use the
corresponding optimal cutoff value.
The analysis of several published data sets shows that
removal of randomized sites consistently leads to more
stable trees, irrespective of the method used for phylogeny
reconstruction (neighbor joining, maximum parsimony,
or maximum likelihood). While in benign data sets, the
effects on consistency indices, likelihood score, or boot-
strap support are typically small and we do not observe
changes in the reconstructed tree topologies, the effects of
removing homoplastic sites can become dramatic for
poor data sets, as the example of the Cox1 genes of Dytis-
cus demonstrates. More importantly, in some cases, the
reconstructed tree topologies can be improved as well, see
e.g. the example of the sea urchin phylogeny in Fig. 3.
Our approach removes randomized sites from a pre-com-
puted alignment. In contrast to manual manipulation of
alignments, reducing data sets using noisy is transparent
and easy to reproduce. Assuming that randomized sites
are, at best, phylogenetically uninformative or, in the
worst case, just misleading, we propose a new way of phy-
logenetic reconstruction that is based on minimizing the
number of randomized sites. Detecting homoplastic char-
acters using circular orderings allows us to explore a two-
stage approach: In the first step, one would construct a cir-
cular ordering that minimizes the fraction of "noisy" sites
(as in Fig. 1). In the second step, one would then construct
the tree implied by the alignment obtained after elimina-
tion of all sites that appear to be highly randomized rela-
tive to that circular ordering.
Competing interests
The authors declare that they have no competing interests.
Authors' contributions
GF and SJP initiated this study and performed the compu-
tations, SG provided a prototype of Qnet, AWMD and PFS
suggested the algorithmic approach, CF and MK imple-
mented noisy, and all authors closely collaborated on the
interpretation of the results and the preparation of the
manuscript.
Acknowledgements
Partial financial support by the German DFG Bioinformatics Initiative, BIZ-
6/1-2, DFG SPP 1174 "Deep Metazoan Phylogeny", the Chinese Academy
of Sciences, the German BMBF, and grants from Arizona State University is
gratefully acknowledged. We also are grateful to Bill Martin for bringing [2]
to our attention.
An extended abstract of this contribution was presented at the ICMSB'08
in Diliman, Feb 25–28, 2008.
References
1. Ogden TH, Rosenberg M: Multiple Sequence Alignment Accu-
racy and Phylogenetic Inference. Syst Biol 2006, 55:314-328.
Publish with BioMed Central and every
scientist can read your work free of charge
"BioMed Central will be the most significant development for
disseminating the results of biomedical research in our lifetime."
Sir Paul Nurse, Cancer Research UK
Your research papers will be:
available free of charge to the entire biomedical community
peer reviewed and published immediately upon acceptance
cited in PubMed and archived on PubMed Central
yours — you keep the copyright
Submit your manuscript here:
/>BioMedcentral
Algorithms for Molecular Biology 2008, 3:7 />Page 10 of 10
(page number not for citation purposes)
2. Landan G, Graur D: Heads or tails: a simple reliability check for
multiple sequence alignments. Mol Biol Evol 2007, 24:1380-1383.
3. Björklund M: Are Third Positions Really That Bad? A Test
Using Vertebrate Cytochrome b. Cladistics 1999, 15:91-97.
4. Yang Z: On the best evolutionary rate for phylogenetic analy-
sis. Syst Biol 1998, 47:125-133.
5. Wägele JW: Foundations of Phylogenetic Systematics Munich, Germany:
Verlag Dr Friedrich Pfeil; 2005.
6. Le Quesne WJ: A method of selection of characters in numer-
ical taxonomy. Syst Zool 1969, 18:201-205.
7. Wilkinson M: Consensus compatibility and missing data in
phylogenetic inference. In PhD thesis University of Bristol, UK;
1992.
8. Meachem CA: Phylogenetic relationships at the basal radia-
tion of angiosperms: further study by probability of charac-
ter compatibility. Syst Bot 1994, 19:506-522.
9. Pisani D: Identifying and removing fast-evolving sites using
compatibility analysis: an example from the arthropoda. Syst
Biol 2004, 53:978-989.
10. Yang Z: Maximum likelihood phylogenetic estimation from
DNA sequences with variable rates over sites: approximate
methods. J Mol Evol 1994, 39:306-314.
11. Hansmann S, Martin W: Phylogeny of 33 ribosomal and six
other proteins encoded in an ancient gene cluster that is
conserved across prokaryotic genomes: influence of exclud-
ing poorly alignable sites from analysis. Int J Syst Evol Microbiol
2000, 50:1655-1663.
12. Brinkmann H, Philippe H: Archaea sister group of Bacteria? Indi-
cations from tree reconstruction artifacts in ancient phylog-
enies. Mol Biol Evol 1999, 16:817-825.
13. Bandelt HJ, Dress AWM: A Canonical Decomposition Theory
for Metrics on a Finite Set.
Adv Math 1992, 92:47-105.
14. Huson DH: SplitsTree: analyzing and visualizing evolutionary
data. Bioinformatics 1998, 14:68-73.
15. Semple C, Steel M: Cyclic permutations and evolutionary trees.
Adv Appl Math 2004, 32:669-680.
16. Buneman P: The Recovery of Trees from Measures of Dissim-
ilarity. In Mathematics and the Archeological and Historical Sciences
Edited by: Hodson FR, Kendall DG, Tautu P. Edinburgh, UK: Edin-
burgh University Press; 1971:387-395.
17. Bandelt HJ, Dress AWM: Split Decomposition: A New and Use-
ful Approach to Phylogenetic Analysis of Distance Data. Mol
Phylogenet Evol 1992, 1(3):242-252.
18. Wetzel R: Zur Visualisierung abstrakter Ähnlichkeitsbezie-
hungen. In PhD thesis Bielefeld University, Germany; 1995.
19. Bryant D, Moulton V: Neighbor-Net: An Agglomerative
Method for the Construction of Phylogenetic Networks. Mol
Biol Evol 2004, 21:255-265.
20. Nieselt-Struwe K, von Haeseler A: Quartet-Mapping, a generali-
zation of the likelihood mapping procedure. Mol Biol Evol 2001,
18:1204-1219.
21. Grünewald S, Forslund K, Dress AWM, Moulton V: QNet: an
agglomerative method for the construction of phylogenetic
networks from weighted quartets. Mol Biol Evol 2007,
24:532-538.
22. Bryant D, Moulton V: Consistency of Neighbor-Net. Alg Mol Biol
2007, 2:8.
23. Grünewald S, Moulton V, Spillner A: Consistency of the QNet
algorithm for generating planar split networks from
weighted quartets. Disc Appl Math 2007. to appear
24. Matsumoto M: Mersenne Twister: A 623-dimensionally equid-
istributed uniform pseudorandom number generator. ACM
Trans Modeling Comp Simulation 1998, 8:3-30.
25. Stockley B, Smith AB, Littlewood T, Lessios HA, Mackenzie-Dodds
JA: Phylogenetic relationships of spatangoid sea urchins
(Echinoidea): taxon sampling density and congruence
between morphological and molecular estimates. Zool Scripta
2005, 34:447-468.
26. Swofford DL: PAUP*: Phylogenetic Analysis Using Parsimony (* and Other
Methods) Version 4.0b10 Sunderland, MA: Sinauer Associates; 2002.
[Handbook and Software]
27. Kluge AG, Farris JS: Quantitative phyletics and the evolution of
anurans. Syst Zool 1969, 18:1-32.
28. Farris JS: The retention index and the rescaled consistency
index. Cladistics 1989, 5:417-419.
29. Mailund T: SplitDist – Calculating Split-Distances for Sets of
Trees. Tech. rep., BiRC, Univ. Aarhus, Århus, DK 2006 [http://
www.daimi.au.dk/~mailund/split-dist.html].
30. Electronic Supplement [ />tions/SUPPLEMENTS/06-013/]
31. Simon C, Frati F, Beckenbach A, Crespi B, Liu H, Flook P: Evolution,
Weighting, and Phylogenetic Utility of Mitochondrial Gene
Sequences and a Compilation of Conserved Polymerase
Chain Reaction Primers. Ann Entomol Soc Am 1994, 87:651-701.
32. Hillis DM, Huelsenbeck JP: Signal, Noise, and Reliability in
Molecular Phylogenetic Analysis. J Hered 1992, 83(3):189-195.
33. Saitou N, Nei M: The neighbor-joining method: a new method
for reconstructing phylogenetic trees. Mol Biol Evol 1987,
4:406-425.
34. Felsenstein J: Confidence limits on phylogenies: An approach
using the bootstrap. Evolution 1985, 31:783-791.
35. Efron B, Halloran E, Holmes S: Bootstrap confidence levels for
phylogenetic trees. Proc Natl Acad Sci USA 1996, 93:7085-7090.
36. Cartwright R: DNA Assembly With Gaps (Dawg): Simulating
Sequence Evolution. Bioinformatics 2005, 21(Suppl 3):iii31-iii38.
37. Korte A, Ribera I, Beutel RG, Bernhard D: Interrelationships of
Staphyliniform groups inferred from 18S and 28S rDNA
sequences, with special emphasis on Hydrophiloidea (Cole-
optera, Staphyliniformia). J Zool Syst Evol Research 2004,
42:281-288.