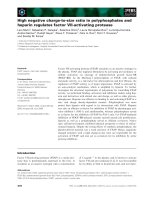
Báo cáo sinh học: "Differential co-expression framework to quantify goodness of biclusters and compare biclustering algorithms" doc
Bạn đang xem bản rút gọn của tài liệu. Xem và tải ngay bản đầy đủ của tài liệu tại đây (1.63 MB, 12 trang )
Chia and Karuturi Algorithms for Molecular Biology 2010, 5:23
/>Open Access
RESEARCH
© 2010 Hui and Karuturi; licensee BioMed Central Ltd. This is an Open Access article distributed under the terms of the Creative Com-
mons Attribution License ( which permits unrestricted use, distribution, and reproduc-
tion in any medium, provided the original work is properly cited.
Research
Differential co-expression framework to quantify
goodness of biclusters and compare biclustering
algorithms
Burton Kuan Hui Chia
1,3
and R Krishna Murthy Karuturi*
2
Abstract
Background: Biclustering is an important analysis procedure to understand the biological mechanisms from
microarray gene expression data. Several algorithms have been proposed to identify biclusters, but very little effort was
made to compare the performance of different algorithms on real datasets and combine the resultant biclusters into
one unified ranking.
Results: In this paper we propose differential co-expression framework and a differential co-expression scoring
function to objectively quantify quality or goodness of a bicluster of genes based on the observation that genes in a
bicluster are co-expressed in the conditions belonged to the bicluster and not co-expressed in the other conditions.
Furthermore, we propose a scoring function to stratify biclusters into three types of co-expression. We used the
proposed scoring functions to understand the performance and behavior of the four well established biclustering
algorithms on six real datasets from different domains by combining their output into one unified ranking.
Conclusions: Differential co-expression framework is useful to provide quantitative and objective assessment of the
goodness of biclusters of co-expressed genes and performance of biclustering algorithms in identifying co-expression
biclusters. It also helps to combine the biclusters output by different algorithms into one unified ranking i.e. meta-
biclustering.
Background
The inception of microarrays has facilitated quantifica-
tion of expression of genes at genomic scale in large sets
of conditions in time and cost effective manner resulting
in a wealth of massive gene expression datasets. Appro-
priate analysis of these datasets lead to the understanding
of the roles of various genes and pathways at genomic-
scale.
Significant portion of microarray data analysis is unsu-
pervised in which the genes are grouped according to the
similarity of their expression patterns among multiple
conditions. It is based on the observation that the genes
involved in similar biological regulatory pathways or
functions exhibit similar expression patterns i.e. a cluster
of genes may demonstrate a consistent co-expression pat-
tern among most conditions. Several techniques such as
agglomerative or divisive clustering algorithms [1-4] that
partition the genes into mutually exclusive groups or
hierarchies have been reported. On the other hand,
unlike the above traditional clustering which uses all
available conditions to cluster genes, biclustering has
been introduced by Cheng and Church [5] to identify
clusters of genes defined based on the respective subsets
of conditions. The conditions used for a bicluster of genes
are often specific to it i.e. a bicluster of genes is co-
expressed in a small subset of conditions and they are
expected to show no or weak co-expression in the
remaining conditions. The difference between clustering
and biclustering is illustrated using the heatmaps in the
Figure 1: a cluster of genes are co-expressed over all con-
ditions (figure 1a); but, a bicluster of genes are co-
expressed only over a subset of conditions (left heat map
in figure 1b) and they are either weekly or not co-
expressed among the remaining conditions (right heat
map in figure 1b).
* Correspondence:
2
Computational & Systems Biology, Genome Institute of Singapore, A-STAR, 60
Biopolis ST, Singapore
Full list of author information is available at the end of the article
Chia and Karuturi Algorithms for Molecular Biology 2010, 5:23
/>Page 2 of 12
Biclustering plays an important role in microarray gene
expression analysis. Expression of a cluster of genes may
be modulated only in a small subset of conditions demon-
strating interesting biology of the condition dependent
transcriptional co-regulation and potentially leading to
understanding of the underlying mechanisms. For exam-
ple, in knock out studies, certain groups of genes are acti-
vated or suppressed only in a small subset of knock-out
conditions. Similarly, in cancer studies, due to heteroge-
neity of the tumors, certain groups of genes involving in a
certain pathway may be co-expressed only in a subset of
tumors. In the traditional clustering, the genes co-
expressed over all conditions dominate the clustering
analysis and the genes co-expressed only in a small subset
of conditions may not be elicited.
As the subsets used for different biclusters of genes are
not known beforehand, several biclustering algorithms
have been proposed in the bioinformatics literature to
identify them [5-13]. Different algorithms use different
objective functions to identify biclusters of co-expressed
genes which makes objective and direct comparison of
biclusters and the biclustering algorithms difficult on real
data as it lacks a gold standard for evaluation. For exam-
ple Cheng and Church's algorithm (CC) [5] minimizes
mean squared error in linear model fit. Iterative Signature
Algorithm (ISA) [7] finds biclusters by maximizing z-
scores of expression. Order Preserving Sub Matrix
(OPSM) [8] elicits biclusters by finding order preserving
co-expression submatrices with highest statistical signifi-
cance support. Statistical Algorithmic Method for Biclus-
ter Analysis (SAMBA) [12] is based on finding heavy
subgraphs in the gene-condition bipartite graph. The
algorithms are summarized in Table 1 for a quick refer-
ence.
Only limited efforts have been made to compare the
performance of various biclustering algorithms on real
data and nearly no effort has been made to combine the
biclusters output by different biclustering algorithms into
a single ranking. Ayadi et al [6] and Prelic et al [11] com-
pared biclustering algorithms mainly using idealized sim-
ulated data which may not be reflective of the real data
such as gene expression in tumors datasets. In addition,
the focus was on evaluating the biclustering algorithms
based on their ability to retrieve the idealized simulated
biclusters i.e. co-expression is simulated only for genes in
the bicluster in the conditions of the bicluster. It is a
highly limited evaluation of biclustering algorithms as the
real data is much more complex. If we have simulated an
expression data of S conditions with one bicluster as fol-
lows: X
ij
= N (0, 1) with co-expression for s S (all condi-
tions) for |s| « |S|. The application of anyone of CC, ISA,
OPSM and SAMBA algorithms can find this bicluster
partly or fully as its genes are not co-expressed in the non
bicluster conditions |S-s| » |s|. Whereas, application of
same algorithms on lung [14], liver [15] and breast cancer
[16] datasets resulted in biclusters (belonged to the top 10
biclusters output by each algorithm) with genes showing
co-expression in non bicluster groups of conditions, see
the Figure 2. This problem is not unique to any one algo-
rithm but holds true for all biclustering algorithms as
their scoring functions mainly depend on the bicluster
conditions only. The presence of co-expression at compa-
rable or better levels in the non-bicluster conditions show
that the co-expression and biology of the bicluster genes
is not limited to the conditions in the bicluster but it is a
global effect. Therefore, evaluation on idealized simu-
lated bicluster data may not be sufficient to reveal true
effectiveness of a biclustering algorithm.
On real data, Prelic et al's [11] evaluation was based on
the number of gene ontology (GO) terms enriched for the
biclusters. It may not be a good measure for four reasons:
(1) it solely depends on the genes in the biclusters and
does not account for the conditions involved; (2) GO
terms may be highly enriched even for normal clusters of
genes which may not lack co-expression in any subset of
the conditions; (3) it does not distinguish between good
biclusters from traditional clusters; and, (4) it may be sub-
jective owing to the hierarchical structure of the GO.
Hence, it is important to develop an objective scoring
function that works well on real data to assess the quality
or goodness of biclusters and hence the reliability of the
biclustering algorithms. It will also be helpful in combin-
ing the results of applying different biclustering algo-
rithms on a data into a single unified ranking, i.e. a meta-
biclustering, which has not been addressed so far. It
would be of great help as it facilitates best utilization of all
biclustering algorithms as different algorithms may
behave differently on different datasets.
Figure 1 Illustrating difference between clustering and bicluster-
ing. Heatmaps (red for induction and green for repression) illustrating
difference between clustering and biclustering (a) a cluster of genes,
genes are co-expressed across most conditions; (b) a bicluster of
genes, genes are co-expressed only on a subset of conditions (heat-
map on the left) and the heatmap on the right shows no co-expression
on the remaining conditions.
Conditions
(a) Cluster
Conditions
(b) Bicluster
G
e
n
e
s
Chia and Karuturi Algorithms for Molecular Biology 2010, 5:23
/>Page 3 of 12
In this paper we propose to develop such a scoring
function based on differential co-expression framework
similar to that proposed by Kostka and Spang [17]. In this
framework, for a given bicluster, we fit two linear models
for the expression of genes in the bicluster for the condi-
tions in the bicluster and for the remaining (the non-
bicluster) conditions separately. The resultant models are
used together to assess goodness of the bicluster using
our differential co-expression scoring function. Note that
the aim of this paper is not to assess the efficiency of the
biclustering algorithms in retrieving underlying biclusters
in the data, but to assess how good the identified biclus-
ters are and how to provide a good unified ranking of the
biclusters (meta-biclustering algorithm) output by them.
Using our scoring function we compare the performance
of different biclustering algorithms on six real datasets.
Results
Differential co-expression framework for biclustering
Suppose we are given two microarray data matrices
( and ) related to a bicluster of I genes and J
1
conditions: one is obtained from J
1
bicluster conditions
(aka group G
1
) and the other is obtained from J
2
non-
bicluster conditions (aka group G
2
); J
1
+J
2
= M, the total
number of conditions in the study. Each row corresponds
to a gene and each column corresponds to a condition.
Note that I is used to indicate both gene set and its cardi-
nality, similar interpretation holds for the other sets of
genes and conditions. The task is to find how well I genes
form a bicluster on J
1
conditions compared to the J
2
con-
ditions. If is a good bicluster then there should be a
co-expression of I in J
1
and a clear differential co-expres-
sion of I between J
1
and J
2
conditions. To find it, we
employ the framework developed for differential co-
expression by Kostka and Spang [17], based on the linear
modeling used by Cheng and Church [5], for both groups
of conditions G
1
and G
2
. Specifically, the linear model for
the expression of I genes in the condition group G
k
is as
follows:
1 ≤ i ≤ I; 1 ≤ j ≤ J
k
; 1 ≤ k ≤ 2
Where X
ijk
is the log-expression of gene g
i
in condition
p
jk
belonged to group G
k
. It is modeled as a summation of
four factors: μ
k
, effect of group (overall effect) G
k
; τ
ik
,
effect of gene g
i
in G
k
; β
jk
, effect of condition p
jk
in G
k
; and,
ε
ijk
, an iid random error or residual of g
i
in p
jk
. Based on
this model, Kostka and Spang's procedure obtains the
mean of the squared residuals (E
k
) to score a set of genes I
on J
k
conditions as follows:
, , are the estimates of τ
ik
, β
jk
, and -μ
k
respec-
tively.
The above linear modeling can elicit three different
types of co-expression corresponding to different relative
strengths of the parameters (τ
ik
, β
jk
and μ
k
) shown by four
X
IxJ
1
X
IxJ
2
X
IxJ
1
X
N
ijk k jk ik ijk
ijk ik
=+ ++
mb t e
es
~(, )0
2
(1)
E
IJ
k
X
kijk
ik
jk k
ij
IJ
k
=
−
()
−
()
−− +
⎛
⎝
⎜
⎞
⎠
⎟
∧∧ ∧
==
∑
1
11
2
11
tbm
,
,
tb
∧∧
==
==
∑∑
ik
ijk
j
J
jk
ijk
i
I
J
k
X
I
X
k
11
11
,
(3)
mb
t
∧∧
∧
==
=
===
=
∑∑∑
∑
k
ijk
j
J
i
I
jk
j
J
ik
i
I
IJ
k
X
J
k
I
kk
11
1
111
1
(4)
t
∧
ik
b
∧
ij
m
∧
k
Table 1: Biclustering algorithms
S. No. Algorithm Acronym Reference
1 Cheng and Church's algorithm CC Cheng and Church [5]
2 Iterative Signature Algorithm ISA Ihmels et al [7]
3 Order Preserving Sub Matrix OPSM Ben-Dor et al [8]
4 Statistical Algorithmic Method for Bicluster Analysis SAMBA Tanay et al [12]
The four biclustering algorithms evaluated using our differential co-expression scoring framework. Their acronyms and references are also
given. All four algorithms aim to find biclusters of genes with co-expression in a subset of conditions.
Chia and Karuturi Algorithms for Molecular Biology 2010, 5:23
/>Page 4 of 12
heatmaps in the Figure 3: (1) T-type co-expression; (2) B-
type co-expression; and (3) μ-type co-expression. T-type
co-expression is depicted by strong gene only effects
resulting in strong τ
ik
s only as the effect of any condition
over I is weak leading to weak or near-zero β
jk
s and μ
k
. B-
type co-expression results from strong condition only
effects leading to strong β
jk
s only as the overall expression
of a gene across the bicluster conditions is weak leading
to weak or near zero τ
ik
s and μ
k
. But, μ-type co-expres-
sion results due to the presence of strong gene as well as
strong condition effects (strong τ
ik
s and β
jk
s) leading to
strong μ
k
. We use the coefficients τ
ik
s, β
jk
s to quantify dif-
ferent types of co-expression, which is the first step to
quantifying differential co-expression, of I genes in J
1
and
J
2
conditions. T
k
(b) and B
k
(b) quantify the T-type and B-
type co-expression of genes in a bicluster b:
Figure 3 Different types of co-expression. Heatmaps (red for induc-
tion and green for repression, genes are indicated in rows and condi-
tions are shown in columns) illustrating 3 types of co-expression: (1) T-
type, gene effects only; (2) B-type, condition effects only; and, (3) μ-
type, gene and condition effects.
T-type co-expression
(strong τ
ik
s only)
B-type co-expression
(strong β
jk
s only)
µ
-type co-expression
(strong τ
ik
s & β
jk
s Îstrong μ
k
)
Figure 2 Biclusters with comparable co-expression of the bicluster genes across non-bicluster conditions. Heatmaps (red for induction and
green for repression, genes are indicated in rows and conditions are shown in columns) of biclusters with comparable co-expression of the bicluster
genes across non-bicluster conditions. In each figure, the left heatmap shows expression of the bicluster genes (rows) in the bicluster conditions (col-
umns) and the right heatmap shows expression of the bicluster genes in the remaining conditions. All of them were chosen from top 10 biclusters
output by the respective algorithms, the rank is indicated in the parenthesis.
Conditions Conditions Conditions
OPSM (4) on Liver [15]
CC (10) on Lung [14]
SAMBA (1) on Lung [14]
OPSM (7) on Breast [16]
CC (3) on Breast [16]
SAMBA (5) on Breast [16]
G
e
n
e
s
G
e
n
e
s
Chia and Karuturi Algorithms for Molecular Biology 2010, 5:23
/>Page 5 of 12
for k = 1 and 2
I(b) is the number of genes in b and J
k
(b) is number of
conditions in G
k
for b. Similar interpretation holds for the
other variables also.
Theorem: T
k
and B
k
are the unbiased estimators of
and respectively under
the assumption that the noise in X
ijk
follows N(0, )
Proof:
As E
k
is an unbiased estimator of , is an
unbiased estimator of β
k
. Similarly is an
unbiased estimator of Γ
k
.
In the above proof, is a non-central Chi-square
distribution with 'n' degrees of freedom and 'c' being the
non-centrality parameter; <Z> is the expectation of the
random variable Z.
Scoring goodness of biclusters
The co-expression patterns in the biclusters output by
any biclustering algorithm fits well into this categoriza-
tion. A bicluster with no co-expression of any type for the
bicluster genes in the non-bicluster conditions is the true
bicluster. Comparable co-expression in the non-bicluster
conditions means the conditions in the bicluster are not
distinctive enough from the remaining conditions and
hence do not qualify to be a bicluster. In such a case, the
bicluster genes with all conditions in the study can be
considered as a gene cluster with a strong co-expression
across all conditions. Hence, biclustering fits well into dif-
ferential co-expression framework. Then the differential
co-expression score for bicluster b, SB(b) is
where 0<a<<1, it is a small fudge factor to offset large
ratios based on very small co-expression in both groups
of a bicluster. Strong positive SB(b) indicates strong co-
expression in G
1
and weaker or no co-expression in G
2
vice versa.
Though we score a bicluster based on its differential co-
expression, our quantification of differential co-expres-
sion by SB(b) is different from that used by Kostka and
Spang, the S(b) = LOG(E
1
(b)/E
2
(b)), and their variance
standardization approach for two reasons: (1) S(b)
accounts mainly for B-type co-expression; and, (2) vari-
ance standardization does not account for different signal
variances in the two groups.
Stratifying biclusters
After having selected significant biclusters based on SB(.),
it is now important to stratify the biclusters into different
types of co-expression. To achieve it, we define the fol-
lowing stratification score TS
k
(b) on the k
th
group which
is declared to be co-expressed by SB(b):
where k = 1 if SB(b) > 0
= 2 if SB(b) < 0
Large positive TS
b
(I) means the bicluster is of T-type
(strong gene effects only), large negative score means the
bicluster is of B-type (strong condition effects only) and
small score close to 0 means they are of μ-type (strong
gene as well as condition effects). Therefore, user can
define a parameter φ > 0 to identify these three groups as
follows:
Τ
Β
k
ik
iib
Ib
k
jk
b
Ib
b
E
k
b
J
k
b
b
J
k
b
()
()
()
()
()
()
()
,
()
=−
=
∧
∧
=∈
∑
1
1
2
1
t
b
22
1jib
Jb
k
b
E
k
b
Ib
=∈
∑
−
,
()
()
()
()
Γ
kik
i
I
I=
=
∑
t
2
1
/
bb
kjk
j
J
k
k
J=
=
∑
2
1
/
s
k
2
bbs
b
∧
∧∧
∧
=
=
=
=
∑
∑
jk
ijk jk k
i
I
k
jk
j
J
I
XN I
Let B
J
k
then
B
k
J
k
k
1
1
2
1
2
1
~( , )
ss
b
s
c
b
s
c
k
I
jk
k
I
jk
k
I
B
J
j
J
j
J
k
J
k
kk
k
2
2
2
2
2
2
11
=
⎛
⎝
⎜
⎜
⎜
⎞
⎠
⎟
⎟
⎟
⇒=
∧
∧
==
∑∑
~
22
1
1
2
2
2
2
2
b
s
s
b
s
jk
k
I
k
I
J
k
jk
k
I
J
j
J
j
J
k
k
k
=
=
∑
∑
⎛
⎝
⎜
⎜
⎜
⎞
⎠
⎟
⎟
⎟
=+
⎛
⎝
⎜
⎜
⎜
⎞
⎠
⎟
⎟⎟
⎟
=+=+
=
∑
s
b
s
b
s
k
I
J
k
jk
J
k
k
I
k
I
j
J
k
k
2
2
22
1
s
k
2
BEI
k
k
∧
−
TEJ
k
kk
∧
−
c
n
c
2
()
SB b LOG
ba ba
ba ba
()
max( ( ) , ( ) )
max( ( ) , ( ) )
=
++
++
⎛
⎝
⎜
⎞
⎠
⎟
ΤΒ
ΤΒ
11
22
TS b LOG
T
k
ba
B
k
ba
k
()
()
()
=
+
+
⎛
⎝
⎜
⎞
⎠
⎟
TS b b T type
TS b b B type
TS b b type
k
k
k
()
()
()
>⇒∈−
<− ⇒ ∈ −
−< < ⇒∈ −
j
j
jjm
Chia and Karuturi Algorithms for Molecular Biology 2010, 5:23
/>Page 6 of 12
Evaluating Biclustering Algorithms and Combining
Bicluster Lists
We have chosen four well-established biclustering algo-
rithms for which software packages are available for eval-
uation and comparison (see Table 1 for summary): (1)
CC, (2) ISA, (3) OPSM and (4) SAMBA. They are all
aimed at identifying biclusters of genes co-expressed in a
subset of conditions though they used different objective
functions with a minor exception to OPSM which aims at
identifying biclusters of order preserving co-expression.
We used the respective default parameter settings for all
these algorithms, similar evaluation may be carried out to
combine the results obtained using different parameter
settings. We have evaluated these biclustering algorithms
on six real datasets from different biological domains:
yeast to plant to different cancers. The summary of the
datasets is given in Table 2. Each biclustering algorithm
was applied on each data; CC, ISA and OPSM are applied
using BiCAT toolbox [18] and SAMBA was applied using
EXPANDER package [19]. The ranking of the biclusters
by each algorithm is the ranking generated by the respec-
tive package. The biclusters with fewer than 5 conditions
were filtered out from the evaluation as they appear to be
strong because of the small number of conditions and
may not be significant.
We have evaluated the biclustering algorithms based on
four criteria: (1) number of biclusters found; (2) median
number of conditions in the biclusters; (3) ranking of the
biclusters generated by an algorithm in the combined
ranking of all biclusters generated by all algorithms; and,
(4) types of biclusters generated.
The number of biclusters generated by different biclus-
tering algorithms for each dataset is shown in the Figure
4. SAMBA has consistently output highest number of
biclusters compared to any other algorithm. ISA has out-
put moderate number of biclusters for large datasets
(number of conditions > 100) and OPSM consistently
output similar number (though small in number) of
biclusters irrespective of the number of conditions. CC
cannot be evaluated by this criterion as the number of
biclusters is a parameter to the implementation of the
algorithm. One striking pattern is that the performance
in terms of number of biclusters output by both SAMBA
and ISA does largely depend on the number of conditions
in the dataset as shown by the trends, but OPSM is inde-
pendent.
The histogram in the Figure 5 shows median number of
conditions in the biclusters generated by each algorithm
for different datasets. CC consistently output biclusters
with very high number of conditions for all datasets
except for Path_Metabolic. Median number of conditions
used by CC strongly depends on the number of condi-
tions in the dataset as seen by the trends; whereas ISA
and SAMBA show a weak dependency on the same.
Interestingly, OPSM does not show any dependency on
the number of conditions in the dataset. Notably
SAMBA, OPSM and ISA output biclusters of similar size.
Next, we turned to evaluating the goodness of the
biclusters. For each dataset, we have combined the biclus-
ters output by all algorithms into a single ranking based
on our SB(b) score. Then we obtained the distribution of
the biclusters output by each algorithm in this unified
ranking as shown in the panels of plots in the Figures 6
and 7. For large datasets (Breast and Liver), the biclusters
output by ISA appeared to be of higher goodness com-
pared to the other biclustering algorithms. The goodness
of the biclusters output by SAMBA is comparable to that
of ISA for moderately large datasets (Yeast and Lym-
phoma) though it appears to be inferior to ISA for very
large datasets (Breast). The goodness of the biclusters
output by CC is consistently inferior to SAMBA and ISA
on all medium and large datasets, it performs comparably
Table 2: Datasets used in the analysis
S. No Dataset Experiment References No. of Genes No. of Samples
1 Breast Breast Cancer Wang et al. [16] 22283 286
2 Liver Liver Cancer Chen et al. [15] 10200 203
3 Yeast Knock Out in Yeast Gasch, et al. [20] 2993 173
4 Lymphoma Lymphoma and Normal Alizadeh, et al. [21] 4026 96
5 Lung Lung Cancer Broët et al. [14] 54837 79
6 Path_Metabolic Plant Wille et al. [22] 734 69
Datasets used in the analysis. The datasets are from diverse domains and of varying size.
Chia and Karuturi Algorithms for Molecular Biology 2010, 5:23
/>Page 7 of 12
only on small size datasets (Lung and Path_Metabolic)
which appears to be consistent with the Prelic et al's
results. OPSM does surprisingly better than the other
algorithms only on Lung dataset and performs poorly on
all other datasets. On the whole, it appears that the per-
formance of SAMBA is consistently good across datasets
of varying sizes. ISA appears to be good for large and very
large datasets. CC and OPSM appear to be performing
comparably on small datasets.
Further, we characterized the biclustering algorithms
based on the types of co-expression found in their biclus-
ters for all 6 datasets. It is assessed by using our bicluster
stratification score TS
1
(b). We plot the cumulative distri-
bution of the TS
1
(b) score of the biclusters output by each
algorithm for each dataset as shown in the Figures 8 and
9, we set φ = 1. The behaviour of the algorithms does
appear to be dependent on the dataset. ISA output ~60%
of the biclusters of B-type for Breast, only 15%-20% for
the other datasets. Apart from B-type, it output only μ-
Figure 4 Number of biclusters. The number of biclusters (y-axis) output by different biclustering algorithms for 6 different datasets. The broken
curve shows the number of conditions in each dataset.
P
Figure 5 Median number of conditions. The median number of conditions (y-axis) in the biclusters output by different biclustering algorithms for
6 different datasets after filtering out small condition sized (<5) biclusters.
P
Chia and Karuturi Algorithms for Molecular Biology 2010, 5:23
/>Page 8 of 12
type biclusters and no T-type biclusters can be seen from
ISA on any dataset. SAMBA output ~90% B-type in
Breast and Lung, 40-50% in the remaining datasets. Strik-
ingly, OPSM output only one type of biclusters for any
dataset: only B-type biclusters were output on Breast,
Liver and Lung datasets; only μ-type biclusters for Yeast,
Lymphoma and Path_Metabolic datasets. This could be
because OPSM identifies order preserving biclusters of
B-type. Like ISA and SAMBA, OPSM also have not out-
put any T-type biclusters on any dataset. Interestingly,
only CC output biclusters of T-type and it output more of
μ-type and T-type biclusters compared to B-type biclus-
ters except on Breast data. On the whole it appears that
all algorithms favoured B-type biclusters on Breast and
Lung datasets and μ-type biclusters on Liver, Yeast and
Lymphoma datasets.
Discussion and Conclusions
Our study on real data has shown that evaluation of
biclustering algorithms on idealized simulated data may
not reflect the actual performance on real data owing to
its complexity. So we proposed a conceptually and statis-
tically sound framework based on the concept of differ-
ential co-expression to objectively compare the
performance of the biclustering algorithms on real data
and combine their output into a single unified ranking.
This is based on the observation that a bicluster is
revealed because the grouping of the bicluster genes
could be strong only based on the bicluster conditions. As
Figure 6 Rank distribution of biclusters. Rank distribution of the biclusters from each algorithm in a combined ranking on different datasets.
P
Chia and Karuturi Algorithms for Molecular Biology 2010, 5:23
/>Page 9 of 12
several biclustering algorithms do not consider the effect
of non-bicluster conditions in the scoring and discovery
of the biclusters, we found several biclusters with a strong
grouping of genes based on the non-bicluster conditions
also. This does not qualify them to be biclusters as the
genes could be grouped nearly strongly even with all con-
ditions together i.e. co-expression is more of a global
effect. The strength of grouping can be represented by
condition and gene effects and their differential between
bicluster and non-bicluster conditions for the bicluster
genes indicate true biclusters. We considered three types
of co-expression unlike in a typical differential co-expres-
sion study and the ranking is based on the model coeffi-
cients rather than the model errors to reflect different
types of co-expression. In this formulation, we explicitly
estimate the effects of genes, conditions in bicluster con-
ditions and non bicluster conditions. Strong effects of
either genes or conditions would indicate co-expression
of genes in the given group of conditions. Taking ratio of
the co-expression scores between bicluster and non
bicluster conditions gives us the measure of the goodness
of the biclusters. Further we proposed a bicluster stratifi-
cation score to classify the biclusters based on their co-
expression patterns: high score means genes are co-
expressed similarly across conditions in the bicluster, but
the genes could be divided into two groups one with
induction and the other with repression; low score means
genes are co-expressed across conditions, conditions can
be divided into two groups - one with induction of all
genes and the other with repression; medium or near-
zero score means all genes are either induced or
repressed but not a combination in all conditions. The
framework we used is analogous to ANOVA with T
k
, B
k
and μ
k
being similar to the variance terms with null cen-
trality parameter being '0'.
Figure 7 Rank composition of top 100 biclusters. Rank composition of the top 100 biclusters obtained by combined ranking of biclusters from
each algorithm on 6 different datasets. The rank is shown on x-axis and the percent contribution of each algorithm is shown on y-axis.
P
Chia and Karuturi Algorithms for Molecular Biology 2010, 5:23
/>Page 10 of 12
We have compared four well known biclustering algo-
rithms: ISA, OPSM, CC and SAMBA. Their application
on six different datasets revealed that ISA outputs the
best biclusters but its performance is dependent on the
number of conditions in the dataset; SAMBA performs
well on all datasets of the varying number of conditions;
though OPSM does not perform well on most datasets, it
is still useful on certain datasets like Lung cancer data;
whereas CC outputs least goodness biclusters with high
stratification scores. Further, there is a data dependency
on the types of co-expression present in the biclusters: all
algorithms output predominantly B-type biclusters on
Breast and Lung datasets and a mix of B-type and μ-type
biclusters for Liver, Yeast and Lymphoma datasets,
though μ-type biclusters are slightly more in number.
Strikingly, OPSM output mostly B-type biclusters and CC
is the only algorithm output T-type biclusters.
However, the evaluation presented in the paper may
vary with a change in parameter settings of the individual
algorithms. But it is helpful even to compare different
Figure 8 Stratification of biclusters. Cumulative distribution TS
1
(b) of the biclusters from each algorithm on 6 datasets. Highly negative TS
1
(b) (< -
1) shows B-type co-expression, highly positive TS
1
(b) (> 1) shows T-type co-expression and TS
1
(b) close to zero (-1< TS
1
(b) <1) indicates μ-type co-
expression.
Chia and Karuturi Algorithms for Molecular Biology 2010, 5:23
/>Page 11 of 12
parameter settings for a given algorithm and choose suit-
able parameter settings. Hence, the scoring function is
useful, as shown here, to get unified ranking of the biclus-
ters (i.e. meta-biclustering algorithm) produced by differ-
ent algorithms for different parameter settings. However,
we are working on devising an algorithm based on the
differential co-expression framework as it may find novel
biclusters with strong differential co-expression.
Moreover, though the proposed goodness scoring func-
tion is tailored to assess the goodness of the biclusters of
co-expressed genes, the general framework of differential
co-expression can be extended to evaluate the goodness
of the other types of biclusters such as low error in the
expression which requires a scoring function proposed by
Kostka & Spang i.e. ratio of error variances = E
2
(b)/E
1
(b).
Figure 9 Stratification of top 100 biclusters. Cumulative distribution TS
1
(b) of the biclusters from each algorithm on 6 datasets contributing to the
top100 biclusters from combined ranking. TS
1
(b) < -1 shows B-type co-expression, TS
1
(b) > 1 shows T-type co-expression and -1 < TS
1
(b) <1 indicates
μ-type co-expression.
Chia and Karuturi Algorithms for Molecular Biology 2010, 5:23
/>Page 12 of 12
Competing interests
The authors declare that they have no competing interests.
Authors' contributions
CKBH conducted all experiments and participated in the development of the
work. RKMK developed and led the project, also written the paper. All authors
read and approved the final manuscript.
Acknowledgements
We thank Ian, Huaien and Juntao for their valuable comments during the work.
We also thank the anonymous reviewers for their valuable constructive com-
ments which helped improve the manuscript. The research was funded by
Genome Institute of Singapore, BMRC, Agency for Science, Technology and
Research (A-STAR), Singapore.
Author Details
1
School of Computing, National University of Singapore, Singapore,
2
Computational & Systems Biology, Genome Institute of Singapore, A-STAR, 60
Biopolis ST, Singapore and
3
CKBH was with Genome Institute of Singapore
during this work
References
1. Ben-Dor A, Shamir R, Yakhini Z: Clustering gene expression patterns. J
Comput Biol 1999, 6(3-4):281-297.
2. Dhillon IS, Marcotte EM, Roshan U: Diametrical clustering for identifying
anti-correlated gene clusters. Bioinformatics 2003, 19(13):1612-1619.
3. Golub , Slonim DK, Tamayo P, Huard C, Gaasenbeek M, Mesirov JP, Coller
H, Loh ML, Downing JR, Caligiuri MA, Bloomfield CD, Lander ES: Molecular
classification of cancer: class discovery and class prediction by gene
monitoring. Science 1999, 286:531-537.
4. Mirkin B: Mathematical classification and clustering. In Nonconvex
Optimization and Its Applications Volume 11. Edited by: Pardalos PM.
Boston-Dordrecht: Kluwer Academic Publishers; 1996.
5. Cheng Y, Church GM: Biclustering of expression data. In Proceedings of
Intl Conf Intell Syst Mol Biol 19-23 August 2000; UC San Diego La Jolla Edited
by: Bourne P, Gribskov M, Altman R, Jensen N, Hope D, Lengauer T,
Mitchell J, Scheeff E, Smith C, Strande S, Weissig H. AAAI; 2000:93-103.
6. Ayadi W, Elloumi M, Hao JK: A biclustering algorithm based on a
Bicluster Enumeration Tree: application to DNA microarray data.
BioData Mining 2009, 2:9.
7. Ihmels J, Bergmann S, Barkai N: Defining transcription modules using
large-scale gene expression data. Bioinformatics 2004,
20(13):1993-2003.
8. Ben-Dor A, Chor B, Karp R, Yakhini Z: Discovering Local Structure in Gene
Expression Data: The Order Preserving Submatrix Problem. Jl of
Comput Biol 2003, 10(3-4):373-384.
9. Kluger Y, Basri R, Chang JT, Gerstein M: Spectral biclustering of
microarray data: coclustering genes and conditions. Genome Research
2003, 13:703-716.
10. Madiera SC, Oliveira AL: Biclustering algorithms for biological data
analysis: A survey. IEEE Transactions on Computational Biology and
Bioinformatics 2004, 1(1):24-45.
11. Prelic A, Bleuler S, Zimmermann P, Wille A, Bühlmann P, Gruissem W,
Hennig L, Thiele L, Zitzler E: A systematic comparison and evaluation of
biclustering methods for gene expression data. Bioinformatics 2006,
22(9):1122-1129.
12. Tanay A, Sharan R, Shamir R: Discovering statistically significant
biclusters in gene expression data. Bioinformatics 2002, 18(1):136-44.
13. Yang J, Wang W, Yu P: Enhanced biclustering on expression data. In
Proceedings of the 3rd IEEE Conference on Bioinformatics and Bioengineering:
10-12 March 2003 Bethesda: IEEE Computer Society; 2003:321-327.
14. Broët P, Camilleri-Broët S, Zhang S, Alifano M, Bangarusamy D, Battistella
M, Wu Y, Tuefferd M, Régnard JF, Lim E, Tan P, Miller LD: Prediction of
clinical outcome in multiple lung cancer cohorts by integrative
genomics: implications for chemotherapy selection. Cancer Res 2009,
69(3):1055-1062.
15. Chen X, Cheung ST, So S, Fan ST, Barry C, Higgins J, Lai KM, Ji J, Dudoit S,
Ng IOL, Rijn M, Botstein D, Brown PO: Gene expression patterns in
human liver cancers. Mol Biol Cell 2002, 13(6):1929-1939.
16. Wang Y, Klijn JG, Zhang Y, Sieuwerts AM, Look MP, Yang F, Talantov D,
Timmermans M, Meijer-van Gelder ME, Yu J, Jatkoe T, Berns EM, Atkins D,
Foekens JA: Gene-expression profiles to predict distant metastasis of
lymph-node-negative primary breast cancer. Lancet 2005,
365(9460):671-679.
17. Kostka D, Spang R: Finding disease specific alterations in the co-
expression of genes. Bioinformatics 2004, 20(Suppl 1):i194-i199.
18. Barkow S, Bleuler S, Prelic A, Zimmermann P, Zitzler E: BicAT: a
biclustering analysis toolbox. Bioinformatics 2006, 22(10):1282-1283.
19. Ulitsky I, Maron-Katz A, Shavit S, Sagir D, Linhart C, Elkon R, Tanay A, Sharan
R, Shiloh Y, Shamir R: Expander: from expression microarrays to
networks and functions. Nature Protocols 2010, 5(2):303-322.
20. Gasch AP, Spellman PT, Kao CM, Carmel-Harel O, Eisen MB, Storz G,
Botstein D, Brown PO: Genomic Expression Programs in the Response of
Yeast Cells to Environmental Changes. Molecular Biology of the Cell 2000,
11(12):4241-4257.
21. Alizadeh AA, Eisen MB, Davis ER, Ma C, Lossos IS, Rosenwald A, Boldrick JC,
Sabet H, Tran T, Yu X, Powell JI, Yang L, Marti GE, Moore T, Hudson J Jr,
Lisheng Lu, Lewis DB, Tibshirani R, Sherlock G, Chan WC, Greiner TC,
Weisenburger DD, Armitage JO, Warnke R, Levy R, Wilson W, Grever MR,
Byrd JC, Botstein D, Brown PO, Staudt LM: Distinct types of diffuse large
B-cell lymphoma identified by gene expression profiling. Nature 2000,
403:503-511.
22. Wille A, Zimmermann P, Vranová E, Fürholz A, Laule O, Bleuler S, Hennig L,
Prelic A, von Rohr P, Thiele L, Zitzler E, Gruissem W, Bühlmann P: Sparse
graphical Gaussian modeling of the isoprenoid gene network in
Arabidopsis thaliana. Genome Biology 2004, 5(11):R92.
doi: 10.1186/1748-7188-5-23
Cite this article as: Chia and Karuturi, Differential co-expression framework
to quantify goodness of biclusters and compare biclustering algorithms
Algorithms for Molecular Biology 2010, 5:23
Received: 21 January 2010 Accepted: 28 May 2010
Published: 28 May 2010
This article is available from : http://www.a lmob.org/conten t/5/1/23© 2010 Hui and Karuturi; licensee BioMed Central Ltd. This is an Open Access article distributed under the terms of the Creative Commons Attribution License ( ), which permits unrestricted use, distribution, and reproduction in any medium, provided the original work is properly cited.Algorithms for Molecular Biology 2010, 5:23