Báo cáo sinh học: "WordCluster: detecting clusters of DNA words and genomic elements" docx
Bạn đang xem bản rút gọn của tài liệu. Xem và tải ngay bản đầy đủ của tài liệu tại đây (344.49 KB, 7 trang )
SOFTWA R E ARTIC L E Open Access
WordCluster: detecting clusters of DNA words and
genomic elements
Michael Hackenberg
1*
, Pedro Carpena
2,3
, Pedro Bernaola-Galván
2
, Guillermo Barturen
1
, Ángel M Alganza
1
,
José L Oliver
1*
Abstract
Background: Many k-mers (or DNA words) and genomic elements are known to be spatially clustered in the
genome. Well established examples are the genes, TFBSs, CpG dinucleotides, microRNA genes and ultra-conserved
non-coding regions. Currently, no algorithm exists to find these clusters in a statistically comprehensible way. The
detection of clustering often relies on densities and sliding-window approaches or arbitrarily chosen distance
thresholds.
Results: We introduce here an algorithm to detect clusters of DNA words (k-mers), or any other genomic element,
based on the distance between consecutive copies and an assigned statistical significance. We implemented the
method into a web server connected to a MySQL backend, which also determines the co-localization with gene
annotations. We demonstrate the usefulness of this approach by detecting the clusters of CAG/CTG (cytosine
contexts that can be methylated in undifferentiated cells), showing that the degree of methylation vary drastically
between inside and outside of the clusters. As another example, we used WordCluster to search for statistically
significant clusters of olfactory receptor (OR) genes in the human genome.
Conclusions: WordCluster seems to predict biological meaningful clusters of DNA words (k-mers) and genomic
entities. The implementation of the method into a web server is available at />wordCluster.php including additional features like the detection of co-localization with gene regions or the
annotation enrichment tool for functional analysis of overlapped genes.
Background
Genome entities as diverse as genes [1], CpG dinucleo-
tides [2], transcription factor binding sites (TFBSs [3])
or ultra-con served non-coding regions [4] usually form
clusters along the chromosome sequence. Such spatial
clustering often translates into genome structures with a
clear functional and/or evolutionary meaning: gene clus-
ters encoding the same or similar products and or igi-
nated through gene duplication events, CpG islands, cis-
regulatory modules, etc. Thus, the spatial clustering of
functional genome elements (in general, words or
k-mers) would somewhat remember the situation in
literary texts, where keywords show a st rong clustering,
whereas common words are randomly distributed [5].
Despite its potential importance, no algorithm exists
to detect the clustering of DNA words in a rigorous
way. Most current methods are based on densities and
sliding-window approaches or arbitrary distances. For
example, the Galaxy work suite ([6], .
psu.edu/) implements an algorithm which lets the user
decide to fix the maximum distance between two enti-
ties and the minimum number of entities in the cluster.
Recently, we developed an algorithm to detect clusters
of CpG dinucleotides in DNA sequences based on the
distance between neighboring CpGs, then assigning a
statistical significance [7]. Now, we generalize the
method to any k-mer or any arbitrary combination o f
them, as well as to any other genome entity defined by
its chromosome coordinates.
* Correspondence: ;
1
Dpto. de Genética, Facultad de Ciencias, Universidad de Granada, Campus
de Fuentenueva s/n, 18071-Granada & Lab. de Bioinformática, Centro de
Investigación Biomédica, PTS, Avda. del Conocimiento s/n, 18100-Granada,
Spain
Full list of author information is available at the end of the article
Hackenberg et al. Algorithms for Molecular Biology 2011, 6:2
/>© 2011 Hackenberg et al; licensee BioMed Central Ltd. This is an Open Access article distributed under the terms of the Creative
Commons Attribution License ( which permits unrestricted use, distribution, and
reproduction in any me dium, provided the original work is properly cited.
Implementation
The WordCluster algorithm allows the detection of clus-
ters for DNA words (k-mers) and genomic elements
(genes,transposons,SINEs,TFBSs,etc.).Thealgorithm
is based on the distances between the entities and an
assigned p-value.
The algorithm
The algorithm is basically the same for k-mers and
genomic elements except for the detection of the coor-
dinates and the way the success probabilities are calcu-
lated. Briefly the algorithm performs the following steps:
1. Detection of all k-mer copies in the chromosomes,
storing its coordinates (this step is unique to the
detection of k-mer clusters as the genomic elements
already come defined by its coordinates). The copies
are detected in a non-overlapping way, i.e. o nce a
copy is found the search is resumed at the end of
the word, thus preventing the detection of overlap-
ping copies.
2. Calculation of the distances between consecutive
copies. The distance is defined as: “start coord inate
of the downstream copy” minus “end coordinate of
the upstream copy”. This implies that the minimum
distance is 1 when the two entities are located
directly next to each other.
3. Detection of the clusters, defined as those chro-
mosomal regions where all distances are equal or
below a given maximum distance. A cluster is
defined by its start and end coordinates and the
number of k-mers or genomic elements it contain.
4. Cal culation of the statistical significance for each
cluster by means of the negative binomial distribu-
tion. A p-value threshold is then used to filter out
those clusters which are not statistically significant.
A main difference to the originally described algorithm
is the way N-runs in the DNA sequence (ambiguous
sequence sites occupied by any nucleotide) are treated.
While the original CpGcluster method allows up to 10 Ns
between two consecutive CpGs , WordCluster detects the
DNA words and the distances strictly within the contigs,
i.e. not a single N is allowed to lie between two copies.
Statistical significance
From now on, we will have to use the word k-mer in
different contexts. Therefore, to avoid confusion we
def ine as “target k-mer(s)” th e k-mer(s) which are being
analysed, i.e. those for which the clusters are going to
be detected. On the contrary, “no-target k-mer(s)” are
all the remaining k-mer(s). We use k-mer in a generic
way, referring to all DNA words of length k.
The statistical significance is calculated as the cumula-
tive density function of the negative bino mial distribu-
tion:
Pn
nn
n
pp
Np f
f
n
n
f
,
()
()
()
()=
+−−
−−
⎛
⎝
⎜
⎞
⎠
⎟
⋅⋅−
−
11
11
1
1
being n the number of target k-mers within the clus-
ter, n
f
the number of “failu res” , i.e. the number of no-
target k-mers. For example, i f we are detecting clusters
of AGCT, a ll k-mers other than AGCT would be con-
sidered as failures. Finally, p is the success probability,
i.e. the probability to find a target k-mer or genomic ele-
men t within the DNA sequence. Note that in the above
equation we use (n-1) instead of n, as the first appear-
ance of a target k-mer within the cluster is trivial (i.e. all
the clusters start with a target k-mer). While the nega-
tive binomial distribution can be defined in the same
way for k-mers and genomic elements, differences exist
in the way the number of “ failures ” and the success
probability are calculated.
For k-mers, the number of failures n
f
is simply given by
nLnk
fc
=−⋅
being L
c
the length of the cluste r, k the length of the
target k-mer and n the number of non-overlapping tar-
get k-mers in the cluster. The number of failures is the
number of no-target k-mers wit hin the cluster. For
example, given the target k-mer ATGC, the cluster
ATGCATGC would give n
f
=0whileATGCAATGC
would give n
f
=1.Eachk-mer can overlap with itself
and other k-mers, but here we consider just non-over-
lapping occurrences. In such a case, the probabilities for
k-mers are given by the following equation
p
N
Lk Nk
s
=
−+ − ⋅ −
()
()11
being N the number of non-overlapping occurrences
of the target k-mers in the sequence, k the length of the
k-mer and L
s
the sequence length. The formula is simply
the number of target k-mer s in the sequence divided by
the total number of k-mers in the sequence. As we do
not consider overlapping instances, N*( k-1) was sub-
tracted from the total number of k-mers (L
s
- k +1),as
those sequence positions are not considered, in order to
take this effect into account.
For genomic elements, it is less clear how to define
the number of failures. For example, one has a cluster
with 5 elements which have mean length of 300 bp and
250 bp of distance on average between each other. The
question is how many “ no -elements” contain this
Hackenberg et al. Algorithms for Molecular Biology 2011, 6:2
/>Page 2 of 7
cluster, i.e. how many failures. We define the number of
failures as
nceiling
L
L
f
no
mean
= ()
being L
no
the number of bases in the cluster not
belonging to the genomic element and L
mean
the mean
length of the genomic element. Thus, this number is an
approximation to the number of “ no-elements” within
the cluster. Finally, the success probability is then given
as
p
NL
L
mean
S
=
⋅
being L
s
the length of the sequence, L
mean
the mean
length of the genomic elements and N the number of
genomic elements.
Distance models
The maximum distance is the main parameter of the
algorithm determining the copies belonging to each
cluster. We have shown previously [7] that, for most
human chromosomes, the median of the observed dis-
tance distribution o f CpGs lies near the intersection
between t he observed and the expected distance distri-
bution. The intersection can be interpreted as the point
separating the intra-cluster from the inter-clu ster dis-
tances. In th is new tool, we added two mo re distance
models based on the direct detection of the mentioned
intersection(onegenomewideandtheotherforeach
chromosome separately). In this way, WordCluster
implements a total of 4 different distance models:
1. Percentile distance: The distance corresponding to
a giv en percentile of the observ ed distance distr ibu-
tion is calculated and used as the maximum distance
threshold.
2. Chromosomal intersection: The distance corre-
sponding to the intersection between the observed
and the expected distributions is used as the maxi-
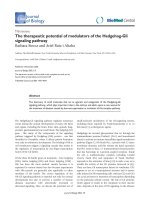
mum distance (see Figure 1).
3. Genome intersection: The distance distributions for
all chromosomes are merged, then calculating the dis-
tance corresponding to the “genome intersection
point”. If this distance model is chosen, the success
probabilities (i.e. the probability to find the target
k-mers in the chromosome) are not calculated for
each chromosome separately (like in the two models
above), but a genome wide success probability (prob-
ability to find the target k-mers) is calculated.
4. Fixed distance: the user can set the distance
threshold.
Webserver
We implemented the described algorithm into a web
server. The tool uses PHP for the i nteraction with the
user, to access the core program (written in Java) and
the MySQL database. T wo types of input data can be
supplied:1)agroupofk-mers and a genomic sequ ence
to be scanned by the program (the user can upload his
own sequence or choose one of the 24 genome assem-
blies stored in our database - see below); and 2) a fil e in
BED format [8,9] with the coordinates of the genomic
elements whose clustering properties should be ana-
lyzed. No mandatory input parameters exist, but the
user can select between different distance models (the
default is the chromosome intersection) and set the cut-
off for the statistical significance (the default here is
p-value ≤ 1E-5).
The output generat ed by the web server depends on
whether the user chooses a genome assembly from our
database or supplies an anonymous sequence. The mini-
mum o utput consists of the basic statistics of the clus-
ters (base composition, entity composition and statistical
signi ficance) and the statistics by chromosome. Further-
more, for all species in the database, the co-localization
of detected clusters with different gene regions (promo-
ters, introns, etc.) is reported.
Finally, for some species (human, mouse, rat , cow,
C. elegans, zebrafish and chicken) an enrichment/deple-
tion analysis for the genes overlapped by the clusters is
carried out using the Gene Ontology [10] and the
Annotation-Modules database [11,12].
Database
Currently, the genomes of 2 4 genome assemblies are
stored into our database. The foll owing sequences
where downloaded from t he UCSC genome browser or
the corresponding project homepages (plant genomes):
Human (hg18, hg19), Mouse (mm8, mm9), Rat (rn4),
Fruit fly (d m3), Anopheles g ambiae (anogam1), Honey
bee (apimel2), Cow (bosTau4), Dog (canFam2), C. brigg-
sae (cb3), C. eleg ans (ce6), Sea squirt (ci2), Zebrafish
(danrer5), Chicken (galgal3), Stickleback (gasacu1),
Medaka (orylat2), Chimp (pantro2), Rhesus macaque
(rhemac2), S. cerevisiae (saccer1), Tetraodon (tetnig 1),
Arabidopsis thalia na (tair8, tair9), and Zea mays (zm1).
To determine the co-localization with genes, we used
RefSeq genes whenever they were available [13],
Ensembl genes otherwise [14].
Results and Discussion
To demonstrate the ability of our algorithm in finding
biologically significant and relevant clusters in the gen-
ome, at the same time illustrating the different distance
models, we carried out three analysis: 1) detection of
Hackenberg et al. Algorithms for Molecular Biology 2011, 6:2
/>Page 3 of 7
0 25 50 75 100 125 150 175 20
0
0.000
0.005
0.010
0.015
0.020
0.025
0.030
0.035
Median : 31 bp
Chromosome intersec: 32 bp
Genome intersec : 33 bp
P
ro
b
a
bili
ty
Distance in bp
Distance distributions (chr16)
Observed
Expected
0 25 50 75 100 125 150 175 20
0
0.000
0.005
0.010
0.015
0.020
0.025
Distance distributions (chr5)
Observed
Expected
P
ro
b
a
bili
ty
Distance in b
p
Genome intersec : 33 bp
Chromosome intersec: 39 bp
Median : 49 bp
Figure 1 Distance distribu tions. Expected and observed distan ce distributions for human chromosomes 16 (above) and 5 (below). It can be
seen that for chr16 the median, the chromosome intersection and the genome intersection are very close (within 1 bp), while for chromosome
5 notable differences exist (from 33 bp to 49 bp).
Hackenberg et al. Algorithms for Molecular Biology 2011, 6:2
/>Page 4 of 7
clusters of CpGs (CpG islands) using different distance
models, 2) detection of clusters of the word CWG
(where W = A, T) and 3) detection of clusters of olfac-
tory receptor genes in the human chromosome 11.
Detection of CpG islands with different distance models
We choose this example as the detection of CpG islands
was the reason to develop the algorithm from which
WordCluster [7] was deriv ed. In the original CpGcluster
algorithm, we used the percentile of the observed dis-
tance distribution as distance model (apart from the
fixed distance), suggesting the median as the default
parameter. We did this since we observed that the inter-
section between the observed and expected distance dis-
tributions is often very close to the median of the
observed distance distribution (see Figure 1). This inter-
section can be interpreted in the following way. When
the observed curve lies above the expected, theoretical
curve, it means that more CpGs exist at this distance
than expected by chance. We can observe in Figure 1
that this is generally the case for short distances, thus
indicating the clustering (overrepresentation of short
distances) of CpG dinucleotides. The intersection
defines the “reversal point” ,i.e.atlargerdistancesthan
this point, the CpG dinucleotides are not clustered any
more. Therefore, it might be that the strict use of the
intersection defines better clusters that the use of the
median, which is a mere approximation to the intersec-
tion point. Furthermore, we observed that for some
chromosomes the intersection and the median differ
slightly. To clarify the impact of this change in the max-
imum distance, we predict CpG islands by means of the
median (cpg50), the chromosome intersection (cpgISc)
and the genome intersection (cpgISg), then assessing the
prediction quality by some of the criteria previously
described [7,15]. Table 1 shows that the mean length of
both intersection models are clearly be low the me an
length of the original cpg50 islands. This can be
explained as the intersection models produce on average
shorter distance thresholds, which leads to fragmenta-
tion, shortening and disappearance of some cpg50 CpG
islands. Consequently, the chromosome intersection
model (cpgISc) predicts fewer islands than the original
cpg50 algorithm (3979). Nevertheless, the genome inter-
section (cpgISg) yields more predictions compared to
cpg50 (5535). The latter observation can be explained as
the predictions are done with a single, genome wide
probability. The p-value assigned to each cluster
depends on the success probability, and in G+C rich
chromosomes the genome wide probability is much
lower than the chromosome probability. This leads to
smaller p-values in G+C rich chromosomes, so that
more islands can pass the p-value threshold. For exam-
ple, cpg50 predicts 2 434 islands in chromosome 22
while cpgISg predicts 5197. Of course, in A T-rich chro-
mosomes this effect is reverted but less pronounced (the
difference between genome wide and chromosome
probabilities are smaller in AT-rich compared to GC-
rich chromosomes), and therefore a higher total number
of islands are predicted.
Next, we analyzed the predictions under functional
aspects. Table 2 shows the overlap of the predictions
with RefSeq genes [13], Alu elements and phylogeneti-
cally conserved PhastCons e lements [16]. The cpgISg
predictions show the highest overlap with the promoter
region (R13), and conserved PhastCons elements, simul-
taneously showing the lowest overlap with spuriou s Alu
elements. This might indicate that cp gISg predictions
are slightly better than the other two, the original cpg50
and cpgISc. However, 1) the differences seem to be
rather small and 2) a more detailed analysis would be
needed to resolve this question.
Independently of thi s open question, we can summar-
ize: 1) the chromosome intersection seems to be a good
replacement for the median and furthermore removes
one i nput parameter from the method, as the intersec-
tion is a fixed statistical property of the chromosome; 2)
the genome intersection may be used when the expected
clusters are known to be not dependent on the chromo-
some. The CpG islands are probably not dependent on
the chro mosome, as the biological mechani sms forming
and maintaining them are probably the same for all
chromosomes. This may suggest the use of the genome
intersection, which is confirmed by producing slightly
better results than the other two tested distance models.
Detection of CWG clusters
Besides the conventional CpG context, the CWG con-
text has recently been shown to be a potential target for
methylation [17]. WordCluster detects 84996 CAG/CTG
clusters in the human genome (NCBI 36, hg18) signifi-
cant at the 1E-5 level using the chromosome intersec-
tion (Table 1). We found a high number of statistically
significant CWG clusters scattered along all human
chromosomes, many of which are overlapping gene
regions (Table 3). To c heck if the detected clusters
Table 1 WordCluster predictions of CpG clusters*
Method # Length ± SD GC ± SD OE ± SD
cpg50 198703 273.2 ± 246.4 63.8 ± 7.5 0.855 ± 0.265
cpgISc 194725 218.7 ± 200.1 65.6 ± 7.7 0.916 ± 0.273
cpgISg 204238 202.6 ± 183.8 66.3 ± 7.5 0.930 ± 0.274
*Basic statistic of CpG island predictions using three different distance models:
cpgISg (genome intersection), cpg50 (Median) and cpgISc (chromosome
intersection). The number of predicted islands, the length, the G+C content
and the observed to expected ratios are shown. Note that the original cpg50
algorithm predicts 198702 islands, i.e. one less than WordCluster with the
median model. This is due to the changes introduced regarding the N-runs
(see main text).
Hackenberg et al. Algorithms for Molecular Biology 2011, 6:2
/>Page 5 of 7
might be biologically meaningful, we compared the
percentage of methylated words (CAG and CTG) inside
and outside of the clusters. We observed that 26.7% of
all CAG/CTG trinucleotides are m ethylated inside the
clusters while 45.3% of them are methylated when
located outside a cluster. It seems therefore, as occurs
in CpG islands, that CAG/CTG clusters remain
unmethylated with a much higher probability than the
bulk DNA.
Detection of olfactory gene clusters
As a third exa mple, we used WordCluster to search for
significant clusters of olfactory receptor (OR) genes, the
largest multigene family in multicellular organisms
whose members are known to be clustered within verte-
brate genomes [18,19]. Table 4 shows the basic statistics
for the 13 clusters of OR genes detected by our algo-
rithm in hum an chromosome 11. Figure 2 shows a
comparative analysis of the clusters predicted by
WordCluster t o the clust ers currently annotated in the
CLIC/HORDE database [19] in a selected region of
chromosome 11. Our a lgorithm predicts a higher num-
ber of clusters, being all of them statistically significant.
Conclusions
WordCluster genera lizes the previous CpGcluster algo-
rithm [7] to any word or genomic element in the ge n-
ome, at the same time associating a statistical
significance to the clusters found. It outperforms current
methods relying on densities and sliding-window
approaches or arbitrarily chosen distance thresholds.
The implementation as a web server connected to a
MySQL b ackend allows for co-localization studies with
Table 2 Biological meaning of WordCluster predictions*
Method #islands #TSS overlap #R13 overlap #Alu overlap #PhastCons overlap
cpg50 198703 12432 (6.3%) 30660 (15.4%) 80323 (40.4%) 48787 (24.6%)
cpgISc 194724 11926 (6.1%) 34567 (17.8%) 70144 (36.0%) 48930 (25.1%)
cpgISg 204238 12156 (6.0%) 37616 (18.4%) 70456 (34.5%) 52335 (25.6%)
*Comparison of three WordCluster predictions of CG clusters (CpG islands) using three different distance models: cpgISg (genome intersection), cpg50 (median)
and cpgISc (chromosome intersection). The overlap with two gene regions (TSS and R13), Alu elements and phylogenetically conserved PhastCons elements have
been measured and both absolute numbe rs and percentages are given.
Table 3 Clusters of CWG trinucleotides*
N 84996
Genome coverage (bp) 15700789
Average length (bp) 184.7
No. of clusters co-locating with gene regions:
TSS 272
TSS ± 100 bp 686
5’UTR 4712
Introns 29326
Exons 1852
3’UTR 1658
*Statistically significant clusters of CAG and CTG trinucleotides detected by
WordCluster in the human genome (hg18). We used the “genome intersection”
distance model and a p-value threshold of 1E-05.
Table 4 Clusters of OR genes in human chromosome 11*
Cluster chromStart chromEnd length count p-value
1 4345160 5178488 833329 53 1.60E-49
2 5269273 5559687 290415 21 6.80E-21
3 5697096 6177989 480894 28 2.70E-25
4 48194938 48344593 149656 9 2.50E-08
5 48398372 48505102 106731 9 1.70E-09
6 49876392 49960613 84222 7 2.60E-07
7 51250039 51384376 134338 11 1.60E-11
8 54842612 55380573 537962 32 4.00E-29
9 55427396 56344568 917173 66 6.30E-65
10 56495101 56580184 85084 7 2.90E-07
11 57555001 57964200 409200 22 3.20E-19
12 58833691 59056759 223069 12 1.30E-10
13 123181329 123481891 300563 16 5.40E-14
*Chromosome coordinates, length, number of OR genes and p-values for all
statistically significant OR gene clusters in chromosome 11.
Figure 2 Clusters of OR genes. A region of human ch romosome 11 showing OR genes (green), the clusters annotated in the CLIC/HORD E
database (blue) and the statistically significant clusters predicted by WordCluster (red). Our algorithm predicts more compact clusters compared
to the CLIC/HORDE annotation. For example, in the first and third HORDE clusters pronounced gaps exist between the genes, which is detected
by WordCluster but ignored by the CLIC/HORDE annotation. The figure was generated using the UCSC Genome Browser [8].
Hackenberg et al. Algorithms for Molecular Biology 2011, 6:2
/>Page 6 of 7
different gene regions, as well as for genome wide
enrichment/depletion analysis of functional terms (GO).
Availability and requirements
The WordCluster webserver ( />wordCluster/wordCluster.php) is freely available. No
registering is needed but every access is logged. For
large jobs, a long-life web link to the results is provided.
List of abbreviations used
k-mer: DNA word (oligonucleotide) with length k; SINEs: Short interspersed
nuclear elements; TSS: Transcription Start Site; TFBS: Transcription Factor
Binding Site; R13: promoter region [TSS-1500 bp; TSS+500 bp].
Acknowledgements
The Spanish Government grants BIO2008-01353 to JLO, mobility PR2009-
0285 to PC, Spanish Junta de Andalucía grants P07-FQM3163 to PC and P06-
FQM1858 to PB are acknowledged. The Spanish ‘Juan de la Cierva’ grant to
MH and Basque Country ‘Programa de formación de investigadores del
Departamento de Educación, Universidades e Investigación’ grant to GB are
also acknowledged.
Author details
1
Dpto. de Genética, Facultad de Ciencias, Universidad de Granada, Campus
de Fuentenueva s/n, 18071-Granada & Lab. de Bioinformática, Centro de
Investigación Biomédica, PTS, Avda. del Conocimiento s/n, 18100-Granada,
Spain.
2
Dpto. de Física Aplicada II, E.T.S.I. de Telecomunicación, Universidad
de Málaga 29071-Malaga, Spain.
3
Division of Sleep Medicine, Brigham and
Woman’s Hospital, Harvard Medical School, Boston, MA 02115, USA.
Authors’ contributions
MH developed and implemented the algorithm and wrote the manuscript
(with JLO), PC and PB carried out the theoretical analysis of word clustering
and help with the interpretation of statistical results, GB and AMA retrieve
and organize the genome and methylation databases, and JLO developed
the algorithm and wrote the manuscript (with MH). All the authors critically
read and approved the final version.
Competing interests
None declared
Received: 30 August 2010 Accepted: 24 January 2011
Published: 24 January 2011
References
1. Durand D, Sankoff D: Tests for gene clustering. J Comput Biol 2003,
10:453-482.
2. Gardiner-Garden M, Frommer M: CpG islands in vertebrate genomes.
Journal of molecular biology 1987, 196:261-282.
3. Makeev VJ, Lifanov AP, Nazina AG, Papatsenko DA: Distance preferences in
the arrangement of binding motifs and hierarchical levels in
organization of transcription regulatory information. Nucleic acids research
2003, 31:6016-6026.
4. Sandelin A, Bailey P, Bruce S, Engstrom PG, Klos JM, Wasserman WW,
Ericson J, Lenhard B: Arrays of ultraconserved non-coding regions span
the loci of key developmental genes in vertebrate genomes. BMC
Genomics 2004, 5:99.
5. Carpena P, Bernaola-Galván P, Hackenberg M, Coronado AV, Oliver JL: Level
statistics of words: finding keywords in literary texts and DNA. Phys Rev E
2008, 79:035102-035104.
6. Giardine B, Riemer C, Hardison RC, Burhans R, Elnitski L, Shah P, Zhang Y,
Blankenberg D, Albert I, Taylor J, et al: Galaxy: a platform for interactive
large-scale genome analysis. Genome Res 2005, 15:1451-1455.
7. Hackenberg M, Previti C, Luque-Escamilla PL, Carpena P, Martínez-Aroza J,
Oliver JL: CpGcluster: A distance-based algorithm for CpG-island
detection. BMC Bioinformatics 2006, 7:446.
8. Karolchik D, Kuhn RM, Baertsch R, Barber GP, Clawson H, Diekhans M,
Giardine B, Harte RA, Hinrichs AS, Hsu F, et al: The UCSC Genome Browser
Database: 2008 update. Nucleic acids research 2008, 36:D773-779.
9. Quinlan AR, Hall IM: BEDTools: a flexible suite of utilities for comparing
genomic features. Bioinformatics (Oxford, England) 26:841-842.
10. Ashburner M, Ball CA, Blake JA, Botstein D, Butler H, Cherry JM, Davis AP,
Dolinski K, Dwight SS, Eppig JT, et al: Gene ontology: tool for the
unification of biology. The Gene Ontology Consortium. Nature genetics
2000, 25:25-29.
11. Hackenberg M, Matthiesen R: Annotation-Modules: a tool for finding
significant combinations of multisource annotations for gene lists.
Bioinformatics (Oxford, England) 2008, 24:1386-1393.
12. Hackenberg M, Matthiesen R: Algorithms and methods for correlating
experimental results with annotation databases. Methods in molecular
biology (Clifton, NJ 2009, 593:315-340.
13. Pruitt KD, Tatusova T, Maglott DR: NCBI reference sequences (RefSeq): a
curated non-redundant sequence database of genomes, transcripts and
proteins. Nucleic acids research 2007,
35:D61-65.
14. Hubbard TJ, Aken BL, Ayling S, Ballester B, Beal K, Bragin E, Brent S, Chen Y,
Clapham P, Clarke L, et al: Ensembl 2009. Nucleic acids research 2009, 37:
D690-697.
15. Hackenberg M, Barturen G, Carpena P, Luque-Escamilla PL, Previti C,
Oliver JL: Prediction of CpG-island function: CpG clustering vs. sliding-
window methods. BMC Genomics 2010, 11:327.
16. Siepel A, Bejerano G, Pedersen JS, Hinrichs AS, Hou M, Rosenbloom K,
Clawson H, Spieth J, Hillier LW, Richards S, et al: Evolutionarily conserved
elements in vertebrate, insect, worm, and yeast genomes. Genome Res
2005, 15:1034-1050.
17. Lister R, Pelizzola M, Dowen RH, Hawkins RD, Hon G, Tonti-Filippini J,
Nery JR, Lee L, Ye Z, Ngo QM, et al: Human DNA methylomes at base
resolution show widespread epigenomic differences. Nature 2009,
462:315-322.
18. Aloni R, Olender T, Lancet D: Ancient genomic architecture for
mammalian olfactory receptor clusters. Genome biology 2006, 7:R88.
19. The HORDE Project [ [http://
bioportal.weizmann.ac.il/HORDE].
doi:10.1186/1748-7188-6-2
Cite this article as: Hackenberg et al.: WordCluster: detecting clusters of
DNA words and genomic elements. Algorithms for Molecular Biology 2011
6:2.
Submit your next manuscript to BioMed Central
and take full advantage of:
• Convenient online submission
• Thorough peer review
• No space constraints or color figure charges
• Immediate publication on acceptance
• Inclusion in PubMed, CAS, Scopus and Google Scholar
• Research which is freely available for redistribution
Submit your manuscript at
www.biomedcentral.com/submit
Hackenberg et al. Algorithms for Molecular Biology 2011, 6:2
/>Page 7 of 7