Báo cáo y học: " Investigating a pathogenic role for TXNDC5 in rheumatoid arthritis" ppsx
Bạn đang xem bản rút gọn của tài liệu. Xem và tải ngay bản đầy đủ của tài liệu tại đây (787.19 KB, 16 trang )
RESEARCH ARTICLE Open Access
Investigating a pathogenic role for TXNDC5 in
rheumatoid arthritis
Xiaotian Chang
1*
, Yan Zhao
1
, Xinfeng Yan
2
, Jihong Pan
1
, Kehua Fang
1
and Lin Wang
1
Abstract
Introduction: Expression of TXNDC5, which is induced by hypoxia, stimulates cell proliferation and angiogenesis.
Our previ ous study detected increased TXNDC5 expres sion in the synovial tissues of rheumatoid arthritis (RA)
patients using proteomic methods. The current study investigated a pathogenic role for TXNDC5 in RA.
Method: Expression of TXNDC5 in synovial membranes was quantitatively analyzed by immunohistochemistry,
Western blotting and real-time polymerase chain reaction (PCR). Serum TXNDC5 levels and serum anti-TXNDC5
antibody levels were determined using sandwich enzyme-linked immunosorbent assay (ELISA). A total of 96 single
nucleotide polymorphisms (SNPs) in or near the TXNDC5 gene were genotyped using custom-designed Illumina
96-SNP VeraCode microassay. Allele frequencies and gen otype frequencies of SNPs were assessed using a case-
control design in a cohort of 267 Chinese patients with RA, 51 patients with ankylosing spondylitis (AS) and 160
healthy controls. Additional genotyping of 951 patients with RA and 898 healthy controls was performed for four
SNPs (rs2277105, rs369086, rs443861 and rs11962800) using the TaqMan method.
Results: Real-time PCR, Western blotting and immunohistochemistry detected significantly higher TXNDC5
expression in the synovial tissues of RA patients compared to samples from patients with osteoarthritis (OA) or AS.
ELISA detected significantly higher levels of TXNDC5 in the blood of RA patients compared to OA, AS and systemic
lupus erythematosus patients, and healthy controls. ELISA did not detect significantly different levels of anti-
TXNDC5 antibody in the blood of RA, OA and AS patients and healthy controls. A total of 9 SNPs (rs9505298,
rs41302895, rs1225936, rs1225938, rs372578, rs443861, rs408014, rs9392189 and rs2743992) showed significant
association with RA, while 16 SNPs (rs1044104, rs1225937, rs1225938, rs372578, rs89715, rs378963, rs1225944,
rs1225947, rs1238994, rs36 9086, rs408014, rs368074, rs1225954, rs1225955, rs13209404 and rs3812162) showed
significant association with AS. Taqman SNP assay demonstrated that rs443861 has an association with RA, which
correlates with the microassay results.
Conclusions: TXNDC5 is up-regulated in synovial tissues of RA patients. TXNDC5 has a genetic effect on the risk of
RA and AS.
Introduction
The thioredoxin domain, containing five (TXNDC5) pro-
teins, also named ERp46, has a protein disulfide isomer-
ase (PDI) domain that exhi bits a high sequence similarity
to thioredoxin, a catalyst of the rate limiting reaction of
disulphide bond formation, isomerisation and reduction
[1,2]. Yeast complementation tests showed that TXNDC5
can conduct P DI functions in vivo [3]. Indirect immuno-
fluorescence microscopy and subcellular fractionation
studies have shown that TXNDC5 is present both in the
endoplasmic reticulum and the plasma memb rane [4].
TXNDC5 is highly expressed in endothelial cells during
hypoxic conditions, and plays important roles in anti-
oxidative i njury, anti-anoxia-induced apoptosis and the
promotion of cell proliferation [1,2].
Abnormal proliferation of synovial fibroblasts and
incre ased angiogenesis are pathological characteristics of
rheumatoid arthritis (RA), an autoimmune disease that
results in inflammation of the joints [5]. Using a proteo-
mics approach, we detected increased TXNDC5 expression
* Correspondence:
1
National Laboratory for Bio-Drugs of Ministry of Health, Provincial
Laboratory for Modern Medicine and Technology of Shandong, Research
Center for Medicinal Biotechnology, Shandong Academy of Medical
Sciences, Jingshi Road 18877, Jinan, Shandong, 250062. P. R. China
Full list of author information is available at the end of the article
Chang et al. Arthritis Research & Therapy 2011, 13:R124
/>© 2011 Chang et al.; licensee BioMed Central Ltd This is an open access article distributed under the terms of the Creative Commons
Attribution License (http://creati vecommons.org/licenses/by/2.0), which permits unrestricted use, distribution, and reproduction in
any medium, provided the original work is properly cited.
in synovial tissues from RA patients [6]. Furthermore, we
detected significantly elevated levels of TXNDC5 in the
synovial fluid of patients with R A [6]. RA is thought to
decrease the oxygen supply, leading to synovial hypoxia
and hypoperfusion [7,8]. Hence, we believe that up-regula-
tion of TXNDC5 may play an important role in the patho-
genesis of RA in the hypoxic environment.
In the current study, we quantitatively analyzed the
exp ression of TXNDC5 in synovial tissues on both tran-
scriptional and translational levels. We also examined
TXNDC5 levels in the blood of RA patients using sand-
wich ELISA. To determine genetic effects of TXNDC5 on
RA, we conducted Illumina GoldenGate assays to identify
potentia l associations between TXNDC5 polymorphisms
and RA. SNPs, including tag SNPs, SNPs in promoter
regions, SNPs in untranslational regions (UTRs), SNPs in
exons and SNPs within proximit y to exons of the
TXNDC5 gene were ge notyped in RA populations, a nd
potential associations were determined by case-control
study and haplotype analysis.
Materials and methods
Sample collection of synovial tissues and blood
Synovial tissue samples were collected during knee joint
replacement surgery from patients with RA (n =10,25
female, 23 to 70 years old, mean 50) and patients with
osteoarthritis (OA) (n = 10, 6 female, 41 to 77 years old,
mean 60). Synovial tissue samples from patients with AS
(n = 10, 3 female, 28 to 54 y ears old, mean 35) were col-
lected during hip joint replacement surgery. The diagnosis
of RA was made according to the criteria of the American
College of Rheumatology. The patients with RA had dis-
ease durations of 3-to-10 years and were classified as hav-
ing erosive RA (Larsen class IV to V). They had high levels
of C-reactive protein (30 to 100 mg/L, mean 24 mg/L),
anti-CCP (300 to 3,000 U/ml) and RF (160 to 2,560 U/ml).
AS patients had an average disease duration of seven years
and were positive for HLA-B27 antigen. Their sy mptoms
were consistent with the modified New York criteria for
AS. Patients with AS and RA took disease-modifying anti-
rheumatic drugs (DMARDs) before surgery. Patients with
AS, RA and OA were also medicated with non-steroidal
anti-inflammatory drugs (NSAIDs), which help reduce the
pain and swelling of the joints, and decre ase stiffness. All
of AS and RA patients got treatment with DMARDs.
Thus, the medical pretreatment does not influence the
results and the experimental results are comparable. Addi-
tional file 1 in the supplementary materials summarizes
the epidemiological data. All AS, RA and OA patients got
treatment with NSAID s. Synovial samples were dissected
from connective tissues and immediately stored at -80°C
until used.
Peripheral blood samples were collected from patients
with RA (n = 267, 183 female) and AS (n = 51, 10 female).
RA patients had a mean age of 51.7 years, while AS
patients had a mean age of 35.9 years. The diagnosis of
RA and AS was conducted as describe d above. Patients
were selected from the same population living in the Shan-
dong area of Northern China. A total of 160 (58 female)
healthy individuals with a mean age of 48.0 years were
blood donors; they did not have any personal or family
history of serious illness. Control individuals were fre-
quency matched to the expected age distribution of the
cases and were from the same geographical area. Blood
samples were put into Monovette t ubes containing 3.8%
sodium citrate.
Both patients and healthy controls gave their written
consent to participate in the study and to allow their bio-
logical samples to be genetically analyzed. The Ethical
Committee of Shandong Academy of Medicina l Sciences
approved this study.
Western blot analysis
Tissue samples weighing 200 μgfromRA,OAandAS
patients were homogenized in Cell Lysis Solution
(Sigma-Aldrich, St. Louis, MO, USA) and centrifuged at
16,000 × g for five minutes at 4°C. Supernatants were col-
lected after centr ifugation, and protein concentrations
were determined using the BCA Protein Assay Kit
(Thermo Fisher Scientific, Rockford, IL, USA). Total pro-
tein was separated by sodium dodecyl sulphate polyacry-
lamide gel electrophoresis (SDS-PAGE) and trans-blotted
onto nitrocellulose membranes (GE Healthcare, Piscat-
away, NJ, USA). Western blot analysis was conducted
using anti-TXNDC5 antibody (Abcam, Cambridge,
Cambridgeshire, UK)) at a 2,000-fold dilution. The
antibody was raised in goats using an oligopeptide
(SLHRFVLSQAKDEL) against TXNDC5. All primary
and secondary antibodies were diluted in 5% nonfat dry
skim milk in TBST (Tris base 0.02 M, NaCl 0.137 M in
distilled water (pH 7.6), containing 0.1% Tween-20).
Immunoreactive signals were detected with alkaline
phosphatase-conjugated secondary anti bodies and visua-
lized using a Western blotting luminol reagent (GE
Healthcare). Western blot images were acquired on a
Typhoon Trio (GE Healthcare). Quantification was con-
ducted using ImageQuant 5.2 software. Another mem-
brane prepared by the same protocol was probed with
anti-GADPH antibody (Santa Cruz Biotechnology, Santa
Cruz, CA, USA) to normalize sample loading.
Immunohistochemistry
Tissue sections of synovial tissues from RA, OA and AS
patients were de-paraffinized and re-hydrated by standard
procedures. Before the anti-TXNDC5 antibodies were
applied, tissue sections were heated at 95°C for 10 minutes
in citrate buffer solution (Sigma) for antigen recovery and
then incubated with an endogeno us peroxidase inhibitor
Chang et al. Arthritis Research & Therapy 2011, 13:R124
/>Page 2 of 16
(Maixin-Bio, Fuzhou, Fujian, China) for 30 minutes at
room temper ature. After washing with PBS buffer (NaCl
0.132 M, K2HPO4 0.0066 M, KH2PO 4 0.001 5 M in dis-
tilled water, pH 7.6), sections were incubated with antibo-
dies directed against TXNDC5 (Abcam) overnight at 4°C.
Immunoreactions were processed using the UltraSensitive
TM S-P Kit (Maixin-Bio) according to the manufacturer’s
instructions. Immunoreactive signals were visualized using
DAB substrate, which stains the target protein yellow. Cell
structures were counterstained with hematoxylin.
In order to determine antibody specificity and o pti-
mize antibody d ilution, the tissue samples were incu-
bated (1) with goat pre-immune serum (Maixin-Bio,
China) or (2) treated by the modification buffer without
addition of antibody.
Immunofluorescent labeling
Tissue sections were processed as described above. After
three washes with PBS buffer, tissue sections were treated
with goat pre-immune ser um (Maixin-Bio, China) for
30 minutes to improve the specificity of the immunoreac-
tion. Slides were incubated with anti-TXNDC5 antibo dy
(Abcam) at 4°C for 12 h and then washed with PBS.
TRITC 5-conjugated anti-goat IgG (Sigma-aldrich) was
added to the slides, and slides were incubated for 40 min-
utes at room temperature. Immunofluorescence was con-
ducted with a Nikon 50i fluorescence microscope (Nikon,
Shinjuku, Tokyo, Japan). To determine antibody specifici-
ties and optimize antibody dilutions, a series of control
slides wer e prepared as follo ws: primary antibo dies only,
secondary antibodies only and normal goat serum only.
Expression levels of TXNDC5 were evaluated with Sim-
plePCI (Hamamatsu Photonics, Sewickley, PA, USA), a
semi-quantitativ e scoring system that analyzes the results
of immunofluorescent labeling according to signal density.
Real-time PCR
Total RNA was isolated from the synovial tissues of RA,
OA and AS patients using Trizol solution (Invitrogen Life
Technologies, Carlsbad, California, USA) according to the
manufacturer’s protocol. Extracted total RNA was reverse-
transcribed in a final volume of 10 μlusingaRNAPCR
Kit (TaKaRa, Katsushika, Tokyo, Japan). Real-time PCR
reactions were conducted using the LightCycler 480
Instrument (Roche Molecular Biochemicals, Basel,
Switzerland) and performed according to the manufac-
turer’ s protocol. Reactions were performed in a total
volume of 10 ul, containing 1 ul of cDNA, 5 ul of SYBR
Green Real-time PCR Master Mix (ToYoBo, Tokyo,
Japan) and 1 ul of each prim er. PCR ampli fication cycles
were carried out as follows: 10 s at 95°C, 40 cycles of 5 s at
95°C and 31 s at 60°C. For each sample, two reactions
were performed at the same time. One reaction was per-
formed to determine the mRNA level of the target gene,
and the se cond was performed to det ermine level of b-
actin. The experiment was performed in triplicate. PCR
products were confirmed by melt curve analysis. Relative
mRNA expression was calculated using the com parative
threshold cycle (Ct) method according to the following
formula: Ratio = 2-ΔΔCt = 2 -ΔCt(sample), where ΔCt =
Ct of target genes - Ct of endogenous control gene (b-
actin). The relative target gene expression was normalized
in comparison to b-actin mRNA levels. Primer sequences
for the amplification of human TXNDC5 were as follows:
forward primer for TXNDC5, 5’-GGGTCAAGATCGCCG
AAGTA-3’; reverse primer for TXNDC5, 5’ -GCCTCCA
CTGTGCTCACTGA-3’;forwardprimerforhumanb-
actin, 5’-TGGCACCCAGCACAATGAA-3’;andreverse
primer for human b-actin, 5’-CTAAGTCATAGTCCGCC-
TAGAAGCA-3’. Primer efficiency was determined by seri-
ally diluting a standard RT reaction product. PCR
efficiency was automatically calculated according to the
dilution curve by the instrument software. Primer specifi-
city was determi ned by both gel electrophoresis and melt
curve analysis. Levels of TXNDC5 are expressed as the
median and r ange. Statistical differences were assessed
using the Mann-Whitney U-test; P < 0.05 was considered
statistically significant.
Sandwich ELISA detecting serum levels of TXNDC5
Blood was collected from patients with RA (n = 96,
75 females, 23 to 71 years old, mean 46), OA (n =56,
16 females, 5 0 to 86 years old, me an 62), AS (n =56,
19 females, 28 to 51 years old, mean 34) and systemic
lupus erythematosus (SLE n = 56, 43 females, 23 to
73 years old, mean 40) as well as healthy controls (n = 48,
24 female, 20 to 40 years old, mean 31). Blood samples
were collected using vacuum blood collection tubes. Fol-
lowing centrifugation at 1,00 0 × g for 30 minutes, serum
was collected and stored at -80°C until use. We raised
antibodies in rabbits using an oligopeptide (RDGKKVD
QYKGKRD) conjugated to keyhole limpet hemocyanin
(KLH). The specificity of the antibody was co nfirmed by
Western blot analysis using various recombinant proteins.
Theantibodywascomparedwiththeantibodymadeby
Abcam, which showed similar results of immunohisto-
chemistry and Western blotting. Rabbit antibody was
diluted 5,000-fold in 0.05 M carbonate-bicarbonate buffer
(pH 9.6) and used to coat 96-well E LISA microplates
(Corning Life Science, Amsterdam, Netherlands) by over-
night incubation at 4°C. After a brief wash with PBS con-
taining 0.1% Tween-20 (PBST), plates were blocked with
5% nonfat dry milk for one hour at room temperature.
Next, blood samples were diluted 10-fold, and incubated
in the plates for two hours at room temperature. After
washing with PBST, goat anti-TXNDC5 antibody
(Abcam), diluted 4,000-fold, was added to the plates and
incubated for two hours at room temperature. Following a
Chang et al. Arthritis Research & Therapy 2011, 13:R124
/>Page 3 of 16
washing step, a 15,000-fold dilution of anti goat IgG alka-
line phosphatase-conjugated antibody (Sigma) was added,
and plates were incubated for 30 minutes at room tem-
perature. Following another PBST wash, plates were devel-
oped by adding alkaline phosphatase yellow (pNPP) liquid
substrate for ELISA (Sigma). Absorbance at 405 nm was
measured using a plate reader (Synergy HT, Bio-Tek,
Winooski, VT, USA). We repeated the ELISA three times
and obtained the similar results.
Sandwich ELISA has low inter-assay and intra-assay
variability and provides more accurate results than
direct ELISA in which patient sera were coated on the
plate and were then detected using the antibody.
ELISA detecting serum levels of anti TXNDC5 antibody
Levels of anti TXNDC5 antibody were measure d in the
blood of patients with RA, OA, or AS (n = 50 for each dis-
ease) as well as healthy controls (n = 50). One hundred
microLs of SLHRFVLSQAKDEL (0.5 ug/ul), the oligopep-
tide against TXNDC5, were coated onto 96-well ELISA
microplates by overnight incubation at 4°C. After a brief
wash with PBST, plates were blocked with 5% nonfat dry
milk for one hour at room temperature. Serum samples,
diluted 20-fold, were added and plates were incubated for
two hours at 37°C. After washing with PBST, a 5,000-fold
dilution of anti-human IgG alkaline phosphatase-conju-
gated antibody (Sigma) was added, and plates were incu-
bated for 30 minutes at room t emperature. Following
another PBST wash, plates were developed by adding the
alkaline phosphatase yellow (pNPP) liquid substrate for
ELISA (Sigma). Absorbance at 405 nm was measured
using a plate reader.
Genomic DNA extraction
Genomic DNA was extracted from peripheral blood leu-
kocytes using the DNA Blood Mini Kit from Qiagen (Hil-
den, Germany) according to the manufacturer’s guidelines.
Briefly, 5 ml of blood was mixed with triton lysis buffer
(0.32 M sucrose, 1% Triton X-100, 5 mM MgCl
2
,H
2
O,
10 mM Tris-HCl, pH 7.5). Leukocytes were spun down
and washed with H
2
O. Pellets were incubated with protei-
nase K at 56°C and subsequently salted out at 4°C using a
substrate NaCl solution. Precipitated proteins were
removed by centrifugation. The DNA in the supernatants
was precipitated with ethanol, and the resulting DNA pel-
lets were dissolved in 400 μlH
2
O.
SNPs selection
Illum ina GoldenGate assays were performed to ge notype
96 SNPs within or near the TXNDC5 gene in 267 RA
patients, 51 AS patients and 160 healthy control indivi-
duals from the Shandong area of North China. Tag SNPs,
SNPs in untranslational region (UTR) and SNP s either in
exons or in close proximity to exons of the gene encoding
TXNDC5 were selected for genotyping. Tag SNPs were
selected from HapMap data with a pair-wise r
2
≥0.8 and
minor allele frequencies (MAF) over 0.05 [9,10]. Coding
SNPs, SNPs near exons in 500 bp, SNPs in UTR and SNPs
near the 5’ and 3’ ends of the gene were also selected.
A total of 156 SNPs were candidates for Illumina’s Gold-
enGate design and were submitted to Illumina for a design
score. The Illumina Assay Design Tool (Illumina, San
Diego, CA, USA) filtered out SNPs not suitable for the
Illumina platform, such as insertions/deletions, tri- and
tetra-allelic SNPs, and SNPs that are not uniquely loca-
lized. Finally, 96 SNPs with a desi gn score of 1, spanning
0.18 Mb of the chromosome were selected. These SNPs
included 5 coding SNPs, 4 SNPs at t he 3’ UTR, 35 tag
SNPs and 53 SNPs in introns or near the 5’ end. The gene
information of these SNPs is shown in Table 1.
Table 1 Single nucleotide polymorphism (SNP)
information
SNP ID Chromosome
position
Locus Allele Protein
residue
rs1044104 7881311 3’ near gene C/T
rs9505298 7881449 3’ near gene A/G
rs41302895 7881754 3’ UTR A/T
rs1043784 7881931 3’ UTR A/G
rs7764128 7882205 3’ UTR A/G
rs8643 7883073 3’ UTR A/G
rs9502656 7883386 synonymous T Asp [D]
rs35264740 7883865 intron C/T
rs17764309 7883916 intron A/G
rs17696707 7884242 intron A/G
rs35871461 7884291 intron C/T
rs2277105 7884652 synonymous A Ala [A] tag SNP
rs1225936 7885184 intron A/C
rs1225937 7885302 intron C/T
rs35794653 7885337 intron -/A
rs9505300 7885364 intron C/T
rs1225938 7886534 intron A/G
rs34342519 7886673 intron -/C
rs11962800 7886905 intron A/G
rs9505301 7887131 intron A/G
rs372578 7887223 intron A/G
rs7740689 7888066 intron A/G
rs89715 7888168 intron C/T
rs7745225 7888251 intron C/T
rs378963 7888328 intron C/T
rs45441296 7889033 missense A Met [M]
rs1225944 7889088 intron C/T
rs34782746 7889254 intron C/T
rs1225946 7889465 intron C/T
rs7746818 7889466 intron A/G
rs34228534 7889773 frame shift Gln [Q]
rs1225947 7890121 intron G/T
Chang et al. Arthritis Research & Therapy 2011, 13:R124
/>Page 4 of 16
Genotyping using microarray
We performed genotyping using custom-designed Illu-
mina 96-SNP VeraCode microarrays (Illumina). Genotyp-
ing was completed by technique service in Dr. Zhang
Feng’s Laboratory of he Beijing Institute of Genomics. A
BeadXpress Reader using Illumina VeraCode GoldenGate
Assay Kit was used. A total of 500 ng of sample DNA was
used per assay. Genotype clustering and calling were per-
formed using BeadStudio software (Illumina).
Genotyping using Taqman SNP assay
Four tag SNPs, rs2277105, rs369086, rs443861 and
rs11962800, were genotyped using TaqMan SNP genotyp-
ing assays in a cohort of 950 patients with RA (693 female)
and 900 healthy controls (630 female). RA patients had a
mean age of 46.2 years and were from the Shandong area
of Northern China. The diagnosis of RA was conducted as
described above. Healthy individuals with a mean age of
43.1 years were selected from the same geographical area.
Assays were run on a LightCyclerH 480 Instrument
(Roche) and evaluated according to the manufacturer’s
instructions. Reactions were carried out in a total volume
of 10 μl using the following amplification protocol: dena-
turation at 95°C for 10 minutes, followed by 40 cycles of
denaturation at 92°C for 15 seconds and finishing with
annealing and extension at 60°C for 1 minute. The geno-
type of each sample was determined by measuring allele-
specific fluorescence using SDS 2.3 software for allelic
discrimination (Roche). Duplicate samples and negative
controls were included to check the accuracy of
genotyping.
Statistical analysis
Genotyping SNPs were analyzed for association by com-
parison of the MAF in cases and controls. Associations of
SNPs w ith RA and AS were eva luated using odds ratios
Table 1 Single nucleotide polymorphism (SNP) informa-
tion (Continued)
rs13873 7891160 intron G/T tag SNP
rs34963444 7891384 intron C/T
rs7771314 7891403 intron C/T
rs9502657 7891682 intron A/C
rs9502658 7891947 synonymous T Phe [F]
rs35365768 7892037 intron -/C
rs1225950 7892143 intron C/G
rs7749719 7894695 intron C/T
rs1238994 7894794 intron G/T
rs35650329 7895782 intron -/G
rs443861 7896491 intron A/G tag SNP
rs369086 7898875 intron A/G tag SNP
rs408014 7899394 intron A/G
rs368074 7899569 intron C/G
rs420970 7899651 intron C/T
rs1225954 7900028 intron A/G
rs1225955 7900709 intron A/G
rs6933089 7900856 intron C/T
rs13209404 7909967 intron C/T
rs13210097 7911345 5’ near gene A/C
rs9502663 7911474 5’ near gene A/C
rs3812162 7911702 5’ near gene A/C tag SNP
rs34066135 7911855 5’ near gene -/G
rs1632346 7913546 intron C/T tag SNP
rs1743634 7916207 intron A/T tag SNP
rs9505309 7917528 intron G/T tag SNP
rs6922018 7918311 intron A/G tag SNP
rs6923488 7918405 intron C/T tag SNP
rs1594467 7920361 intron A/G tag SNP
rs419588 7920808 intron C/T tag SNP
rs365936 7920904 intron A/C tag SNP
rs1237879 7932261 intron A/G tag SNP
rs627957 7936475 intron C/T tag SNP
rs155487 7938773 intron A/G tag SNP
rs10484327 7942566 intron A/C tag SNP
rs7764884 7970540 intron A/G tag SNP
rs7763447 7973380 intron A/G tag SNP
rs9406071 7974705 intron C/T tag SNP
rs6597292 7975259 intron G/T tag SNP
rs197119 7976745 intron A/G tag SNP
rs6597293 7987883 intron C/G tag SNP
rs11754300 7988766 intron C/T tag SNP
rs7744601 7988910 intron C/T tag SNP
rs2567226 7993977 intron A/G tag SNP
rs12204273 8002705 intron A/G tag SNP
rs9392182 8009035 intron A/T tag SNP
rs2207720 8019197 intron C/T tag SNP
rs9392189 8021532 intron A/G tag SNP
rs2815128 8023462 intron G/T tag SNP
rs2815142 8043546 intron A/G tag SNP
rs2743992 8054722 intron A/G tag SNP
Table 1 Single nucleotide polymorphism (SNP) informa-
tion (Continued)
rs2294436 8057688 intron C/T tag SNP
rs2743991 8060175 intron A/G tag SNP
rs9405369 8062437 intron A/T
rs12207627 8062532 intron A/G
rs2743989 8064035 intron C/T
rs2815153 8064050 intron C/T
rs2815154 8064084 intron C/T
rs9328453 8065127 5’ near gene A/G
rs2815155 8065230 5’ near gene C/T
rs12660697 8065707 5’ near gene A/G
rs9392956 8065769 5’ near gene C/T
rs9392957 8065781 5’ near gene A/C
rs9505351 8066286 5’ near gene G/T
Chang et al. Arthritis Research & Therapy 2011, 13:R124
/>Page 5 of 16
(OR) with 95% confidence intervals (CI). Fisher’s exact
test was used for comparison between categorical vari-
ables. P-values less than 0.05 were considered statistically
significant. After genotyping, SNP markers were evalu-
ated for significant deviation from Hardy-Weinberg equi-
librium. Calculation s were performed using SHEsis and
Haploview, two powerful web-based platforms for ana-
lyses of linkage disequilibrium, haplotype construction
and genetic association at polymorphism loci [11,12].
Results
TXNDC5 expression in the synovial membranes of RA
patients
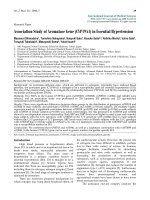
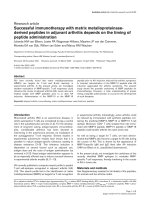
Immunohistochemistry analysis revealed significant
TXCND5 expression in the t hick lining layer and in
many of the fibroblast-like cells of synovial membranes
from RA patients (n = 10). Although detectable in the
thin lining layer and some endothelial cells of small
blood vessels, expression was very weak in the synovial
membranes of OA patients (n = 10). In AS patients (n =
10), TXNDC5 expression was relatively low in synovial
membranes and was mainly limited in endothelial cells of
small blood vessels. These observations were confirmed
by immunofluorescent labeling. Results are shown in
Figure 1A. SimplePC (Hamamatsu Photonics, Sewickley,
PA, USA), software designed to measure the signal den-
sity of the expression in a semi-quantitative manner,
detected signif icantly higher levels of TXNDC5 in syno-
vialtissuesfromRApatientscomparedtoOAandAS
patients (Figure 1B).
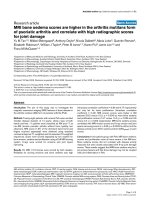
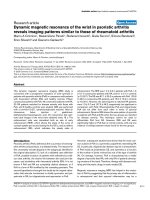
Western blots revealed a p rotein with a molecular
weight of 50 kDa. in each of the synovial tissues analyzed.
Using GADPH as a reference, significantly incre ased
TXNDC5 expression was detected in the synovial mem-
branes of RA patients (n = 10), relative to the samples
from OA (n = 10) and AS (n = 10) patients. These results
were consistently observed in all of the synovial mem-
branes examined (Figures 2A, B).
Transcription of TXNDC5 was quantified using real-
time PCR. Similar to the Western blotting and immuno-
labeling results, all RA samples (n =10)exhibiteda
higher degree o f TXNDC5 mRNA expression compare d
to the OA (n =10)andAS(n =10)samples(Figure2C).
TXNDC5 was expressed at a low level in all OA samples.
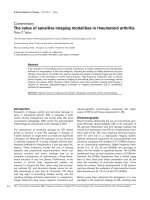
TXNDC5 levels in blood samples from RA patients
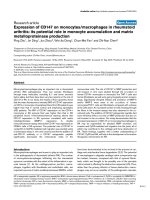
A sandwich ELISA was used to measure levels of
TXNDC5 in the blood of RA patients with chronic
inflammation. Levels of TXNDC5 were significantly
increased in samples from RA patients compared to sam-
ples from OA, AS and SLE patients. Serum TXNDC5
expression in RA patients was also significantly elevated
compared to healthy controls (Figure 3A). An ELISA was
used to measure serum anti-TXNDC5 antibody levels of
the patients. These were not significantly different from
serum levels from RA, OA, and AS patients and healthy
controls (Figure 3B).
Genotyping of SNPs located in TXNDC5
We genotyped 96 SNPs across the TXNDC5 gene from
267 Ha n Chinese patients with RA, 51 patients and 160
control individuals. All SNPs yielded genotype data, and
the study sample success rate was 99.1%. Differenc es in
allele frequencies and genotype frequencies between
cases and controls were compared. Overall, nine SNPs
(rs9505298, rs41302895, rs1225936, rs1225938, rs372578,
rs443861, rs408014, rs9392189 and rs2743992) were
found to be significantly associated with RA (P < 0.05). A
total of 16 SNPs (rs1044104, rs1225937, rs1225938,
rs372578, rs89715, rs378963, rs1225944, rs1225947,
rs1238994, rs369086, rs408014, rs368074, rs1225954,
rs1225955, rs13209404 and rs3812162) were found to be
significantly associated with AS (P < 0.05). Among the
genotyped SNPs, three SNPs (rs1225938, rs372578 and
rs408014) had significant association with both RA and
AS. All SNPs retained in the analysis were in Hardy-
Weinberg equilibrium (P > 0.05) in th e overall samples.
The allele and genotype frequencies of the associated
SNPs between cases and controls are shown in Tables 2
and 3. Other SNPs of the TXNDC5 gene polymorphisms
did not disclose significant differences in allelic frequen-
cies and genotype frequencies between the RA patients
and controls or between AS patients and controls.
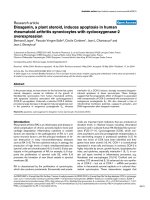
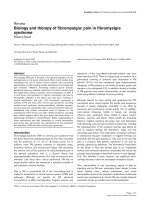
Linkage disequilibrium (LD) analysis was performed
within the tested SNPs. Pairwise D’ values between all
SNPs were calculated to determine the extent of LD. LD
analysis defined eight blocks in TXNDC5 within the RA
population. Rs372578, rs408014 and rs2743992, which
showed strong association with RA, were in Blocks 3, 4 and
8, respectively. LD analysis defined 10 blocks in TXNDC5
within the studied AS population. Block 2 contained
rs372578, rs89715, ra378963 and rs1225944, while Block 3
contained rs1238994, rs369086, rs408014 rs368074,
rs1225954, rs12 25955, rs13209404 and rs3812162, SNPs
that showed strong association within AS patients. These
results are shown in Figure 4 A, B.
In the RA population, haplotype analysis defined 27
haplotypes (frequency > 1%) in the TXNDC5 gene by LD.
Haplotype AA (frequency 79.3%) in Block 2, haplotype
GAAG (frequency 56.4%) in Block 3, haplotypes
GAGGGGA and AGCAAAC (frequencies 56.6% and
23.1%, respectively) in Block 4 and haplotype AG (fre-
quency 79.3%) in Block 8 provide significant evidence to be
associated with RA risk (P = 0.0446, 0.0125, 0.0112, 0.0081
and 0.0336, respectively). Haplotype analysis defined 40
haplotypes (frequency > 1%) within the RA cohort by LD in
the control population. Haplotypes AAAGAAG and
GAAAGGA (frequencies 44.1% and 33.3%, respectively) in
Chang et al. Arthritis Research & Therapy 2011, 13:R124
/>Page 6 of 16
Block 2, haplotypes AGGAGGGGA and CGAGCAAAC
(frequencies 48.9% and 29.3%, respectively) in Block 3, hap-
lotype GG (frequency 56.9) in Block 4, and haplotype AGA
(frequency 4%) in Block 5 provided significant evidence to
be associated with AS risk (P = 0.0198, 0.0043, 0.0044,
0.0018, 0.0187 and 0.0053, respectively). The haplotype fre-
quencies in a case-control cohort of patients with RA and
AS are shown in Tables 4 and 5. The raw microarray data
Figure 1 Immunodetection of TXNDC5 in synovial membranes from patients with RA, OA and AS.(A) Immunolocalization of TXNDC5 in
synovial membranes. The left lane indicates results of immunohistochemistry, and the right lane indicates results of immunofluorescent labeling.
Original magnification: 100×. Arrows indicate the upper layer of synovial membranes. (B) Semi-quantitative analysis of immunofluorescent signals
of TXNDC5. TXNDC5 had significantly higher expression in the synovial tissue of RA patients compared to the synovial tissues of OA and AS
patients. AS, ankylosing spondylitis; OA, osteoarthritis; RA, rheumatoid arthritis.
Chang et al. Arthritis Research & Therapy 2011, 13:R124
/>Page 7 of 16
Figure 2 Quantitative analysis of TXNDC5 expression.(A) TXNDC5 at molecular weight of 50 kDa was detected in synovial tissues of RA, OA
and AS patients using Western blot analysis. Sample loading was normalized using GADPH at molecular weight of 37 kDa. (B) TXNDC5
expression was semi-quantitatively analyzed by normalizing the signal density of TXNDC5 to that of GADPH. (C) TXNDC5 mRNA expression was
measured in synovial tissues using real time PCR. The expression was normalized to that of b-actin. TXNDC5 had significantly higher expression
in the synovial tissue of RA patients compared to the synovial tissues of OA and AS patients. AS, ankylosing spondylitis; OA, osteoarthritis; RA,
rheumatoid arthritis.
Chang et al. Arthritis Research & Therapy 2011, 13:R124
/>Page 8 of 16
were available as an Additional file 2 to perform associa-
tion,LDandhaplotypeanalysis.
We performed additional genotyping for four SNPs
(rs2277105, rs369086, rs443861 and rs11962800) in an
independent case-control study using the TaqMan
method. The study was conducted within 951 patients
with RA and 898 healthy controls. Allelic frequencies and
gene frequencies of the four tag SNPs did not deviate
from Hardy-Weinberg equilibrium in both case and the
controls. Allelic frequency of the tag SNPs was compared
between RA patients and controls. Among the polymorph-
isms identified, the allele frequency and gene frequency for
tag SNP rs443861 demonstrated statistically significant
evidence for association with RA (P = 0.008320, and
0.010110. This SNP was also determined to have signifi-
cant association with RA by Illumina 96-SNP VeraCode
microarray. The tag SNPs of rs2277105, rs36 9086 and
rs11962800 did not disclose significant differences in alle-
lic frequencies and gene frequencies between RA patients
and controls (Table 6).
Discussion
In the present study, TXNDC5 expression was quantita-
tively assessed both at the transcriptional level and trans-
lational level. In comparison to synovial tissue samples
from OA and AS patients, TXNDC5 expression was sig-
nificantly increased in the synovial tissues of RA patients
as determined by immunohistochemistry and Western
blotting. Real time PCR also detected increased TXNDC5
mRNA le vels in the synovial membranes of RA patients.
Furthermore, sandwich ELISA detected increased expres-
sion of TXNDC5 in both the synovial fluid and blood of
RA patients [6]. Taken together, these results confirm the
increased expression of TXNDC5 in the synovium and
blood of RA patients. In the present study, we did not
detect increased levels of autoantibodies directed against
TXNDC5 in the blood of RA patients, indicating that the
over-expression o f TXNDC5 does not directly cause an
autoimmune response as an autoantigen like some citrul-
linated proteins [13]. We proce ssed Western blotting
with protein extracted from the whole synovial tissue.
The immunohistochemistry focuses on the expression of
TXNDC5 in the lining area and the deep lining area of
the synovial membrane. Immunofluorescent immunocy-
tochemistry semi-quantified the expression level in one
tissue region rather than the whole tissue. In addition,
synovial tissues of RA and AS have significantly increased
angiogenesis in which endothelial cells of blood vessels
have strong expression of TXNDC5. Thus, it is possible
the result of semi-quantification of immunofluorescent
immunocytochemistry is a little different from the result
of Western blotting.
TXNDC5 expression is up-regulated by hypoxia and has
a protective effect on endothelial cells by inducing folding
and chaperone activity in hypoxia-induced anti-apoptotic
molecules [1,2]. RA is thought to decrease the oxygen sup-
ply, leading to synovial hypoxia and hypoperfusion [7,8].
Using co-immunoprecipitation followed by mass spectro-
metry, Charlton et al. found that TXNDC5 interacts with
the N-terminal residues of AdipoR1. Further, transient
knockdown of TXNDC5 in HeLa cells increased the levels
of AdipoR1 and AdipoR2, which correlated with the
increased adiponectin-stimulated phosphorylation of
AMPK. However, adiponectin-stimulated phosphorylation
of p38MAPK was reduced following TXNDC5 knockdown
[4]. Recent reports indicate that AdipoR1 and AdipoR2
mediate the insulin-sensitizing adipokine adiponectin. RA
is associated with the increased production of adipokines,
cytokine-like mediators that are produced mainly in adi-
pose tissue and synovial cells [14]. Frommer et al. demon-
strated that adiponectin was present in inflamed synovium
at sites of cartilage invasion in lymphocyte infiltrates and
in perivascular areas. Adiponectin stimulates synovial
fibroblasts to secrete chemokines, proinflammatory cyto-
kines, prostaglandin synthases, growth factors and factors
Figure 3 Serum levels of TXNDC5 and anti-TXNDC5 antibody in
patients with arthritic diseases and healthy controls.TXNDC5
levels are represented by OD values of absorbance at 405 nm and are
expressed as the mean ± standard error of the mean. (A) A sandwich
ELISA detected increased level of TXNDC5 in blood samples from RA
patients compared to samples from OA, AS and SLE patients, as well as
from healthy controls. (B) An ELISA indicated that levels of anti-
TXNDC5 antibodies were not significantly different among blood
samples from RA, OA and AS patients and the healthy controls. AS,
ankylosing spondylitis; OA, osteoarthritis; RA, rheumatoid arthritis.
Chang et al. Arthritis Research & Therapy 2011, 13:R124
/>Page 9 of 16
for bone metabolism and matrix remodelling. This adipo-
nectin-mediated effect was p38 MAPK and protein kinase
C dependent. Adiponectin promotes inflammation
through cytokine and chemokine production that attracts
inflammatory and pro-destructive cells to the synovium,
which, in turn promotes matrix destruction at sites of car-
tilag e invasion [15]. Choi et al. reported that adiponectin
might contribute to synovitis and joint destruction in RA
Table 2 Allele and genotype frequencies in a case-control cohort of patients with RA
dbSNP identity Allele/
Genotype
Numbers of patients
with RA (%)
Numbers of controls (%) Fisher’s P-value Odds ratio (95% CI)
rs9505298 A 75 (0.144) 10 (0.032) 1.83E-07 5.157303 (2.624041 to 10.136190)
G 445 (0.856) 306 (0.968) 5.157303 (2.624041 to 10.136190)
AA 1 (0.004) 0 (0.000) 3.13E-07
AG 73 (0.281) 10 (0.063)
GG 186 (0.715) 148 (0.937)
rs41302895 A 64 (0.120) 9 (0.028) 3.32E-06 4.725546 (2.317854 to 9.634252)
T 468 (0.880) 311 (0.972) 4.725546 (2.317854 to 9.634252)
AA 1 (0.004) 0 (0.000) 9.11E-06
AT 62 (0.233) 9 (0.056)
TT 203 (0.763) 151 (0.944)
rs1225936 A 24 (0.045) 2 (0.006) 0.001438 7.494071 (1.759029 to 31.927328)
C 506 (0.955) 316 (0.994) 7.494071 (1.759029 to 31.927328)
AC 24 (0.091) 2 (0.013) 0.001201 7.817427 (1.821928 to 33.542572)
CC 241 (0.909) 157 (0.987) 7.817427 (1.821928 to 33.542572)
rs1225938 A 270 (0.509) 190 (0.594) 0.016879 0.710526 (0.536647 to 0.940745)
G 260 (0.491) 130 (0.406) 0.710526 (0.536647 to 0.940745)
AA 53 (0.200) 52 (0.325) 0.013717
AG 164 (0.619) 86 (0.537)
GG 48 (0.181) 22 (0.138)
rs372578 A 224 (0.424) 109 (0.341) 0.015688 1.426364 (1.068889 to 1.903392)
G 304 (0.576) 211 (0.659) 1.426364 (1.068889 to 1.903392)
AA 45 (0.170) 21 (0.131) 0.029497
AG 134 (0.508) 67 (0.419)
GG 85 (0.322) 72 (0.450)
rs443861* A 117 (0.221) 48 (0.150) 0.011538 1.605327 (1.109766 to 2.322179)
G 413 (0.779) 272 (0.850) 1.605327 (1.109766 to 2.322179)
AA 6 (0.023) 3 (0.019) 0.016509
AG 105 (0.396) 42 (0.263)
GG 154 (0.581) 115 (0.719)
rs408014 A 303 (0.574) 211 (0.659) 0.013531 0.695671 (0.521353 to 0.928274)
G 225 (0.426) 109 (0.341) 0.695671 (0.521353 to 0.928274)
AA 86 (0.326) 72 (0.450) 0.03402
AG 131 (0.496) 67 (0.419)
GG 47 (0.178) 21 (0.131)
rs9392189* A 116 (0.221) 103 (0.322) 0.001239 0.598991 (0.438317 to 0.818563)
G 408 (0.779) 217 (0.678) 0.598991 (0.438317 to 0.818563)
AA 16 (0.061) 18 (0.113) 0.007146
AG 84 (0.321) 67 (0.419)
GG 162 (0.618) 75 (0.469)
rs2743992* A 230 (0.437) 163 (0.509) 0.041455 0.748425 (0.566338 to 0.989055)
G 296 (0.563) 157 (0.491) 0.748425 (0.566338 to 0.989055)
AA 43 (0.163) 44 (0.275) 0.022536
AG 144 (0.548) 75 (0.469)
GG 76 (0.289) 41 (0.256)
160 controls and 266 cases were observed; *represents tag SNP.
95% CI, 95% confidence interval; RA, rheumatoid arthritis; SNP, single nucleotide polymorphism.
Chang et al. Arthritis Research & Therapy 2011, 13:R124
/>Page 10 of 16
Table 3 Allele and genotype frequencies in a case-control cohort of patients with AS
dbSNP identity Allele/Genotype Numbers of patients
with RA (%)
Numbers of controls (%) Fisher’s P-value Odds Ratio (95% CI)
rs1044104 A 49 (0.480) 103 (0.322) 0.0037 1.947793 (.237327 to 3.066204)
G 53 (0.520) 217 (0.678) 1.947793 (.237327 to 3.066204)
AA 13 (0.255) 20 (0.125) 0.022555
AG 23 (0.451) 63 (0.394)
GG 15 (0.294) 77 (0.481)
rs1225937 A 67 (0.657) 252 (0.787) 0.007503 0.516553 (0.316863 to 0.842090)
G 35 (0.343) 68 (0.212) 0.516553 (0.316863 to 0.842090)
AA 22 (0.431) 99 (0.619) 0.027945
AG 23 (0.451) 54 (0.338)
GG 6 (0.118) 7 (0.044)
rs1225938 A 46 (0.451) 190 (0.594) 0.011468 0.562030 (0.358612 to 0.880834)
G 56 (0.549) 130 (0.406) 0.562030 (0.358612 to 0.880834)
AA 11 (0.216) 52 (0.325) 0.013973
AG 24 (0.471) 86 (0.537)
GG 16 (0.314) 22 (0.138)
rs372578 A 50 (0.490) 109 (0.341) 0.006659 1.861327 (1.184652 to 2.924518)
G 52 (0.510) 211 (0.659) 1.861327 (1.184652 to 2.924518)
AA 14 (0.275) 21 (0.131) 0.029107
AG 22 (0.431) 67 (0.419)
GG 15 (0.294) 72 (0.450)
rs89715 A 52 (0.510) 212 (0.662) 0.005544 0.529811 (0.337112 to 0.832662)
G 50 (0.490) 108 (0.338) 0.529811 (0.337112 to 0.832662)
AA 15 (0.294) 73 (0.456) 0.026647
AG 22 (0.431) 66 (0.412)
GG 14 (0.275) 21 (0.131)
rs378963 A 63 (0.643) 253 (0.791) 0.002897 0.476680 (0.291090 to 0.780596)
G 35 (0.357) 67 (0.209) 0.476680 (0.291090 to 0.780596)
AA 20 (0.408) 100 (0.625) 0.012477
AG 23 (0.469) 53 (0.331)
GG 6 (0.122) 7 (0.044)
rs1225944 A 35 (0.357) 66 (0.206) 0.002276 2.138047 (1.304553 to 3.504071)
G 63 (0.643) 254 (0.794) 2.138047 (1.304553 to 3.504071)
AA 6 (0.122) 7 (0.044) 0.010406
AG 23 (0.469) 52 (0.325)
GG 20 (0.408) 101 (0.631)
rs1225947 A 51 (0.500) 108 (0.338) 0.0032 1.962963 (1.249087 to 3.084832)
C 51 (0.500) 212 (0.662) 1.962963 (1.249087 to 3.084832)
AA 13 (0.255) 21 (0.131) 0.017854
AC 25 (0.490) 66 (0.412)
CC 13 (0.255) 73 (0.456)
rs1238994 A 52 (0.510) 210 (0.656) 0.007966 0.544762 (0.346807 to 0.855709)
C 50 (0.490) 110 (0.344) 0.544762 (0.346807 to 0.855709)
AA 15 (0.294) 71 (0.444) 0.031615
AC 22 (0.431) 68 (0.425)
CC 14 (0.275) 21 (0.131)
rs369086* A 35 (0.343) 66 (0.208) 0.005322 1.994573 (1.221370 to 3.257261)
G 67 (0.657) 252 (0.792) 1.994573 (1.221370 to 3.257261)
AA 6 (0.118) 7 (0.044) 0.022037
AG 23 (0.451) 52 (0.327)
GG 22 (0.431) 100 (0.629)
rs408014 A 50 (0.500) 211 (0.659) 0.004146 0.516588 (0.327716 to 0.814312)
Chang et al. Arthritis Research & Therapy 2011, 13:R124
/>Page 11 of 16
by stimulating vascul ar endothelial growth factor, matrix
metalloproteinase-1, and matrix metalloproteinase-13
expression in fibrob last-like synoviocytes [16]. Addition-
ally, Tian et al. also reported that increased PDI activity in
myocardial endothelial cells in mice stimulates angiogen-
esis under hypoxia condition [17]. These results support
the possibility that the increase of TXNDC5 expression in
the synovial tissues of RA patients stimulates the synovial
ocular pannus, pro-inflammation and bone degradation.
However, the detailed mechanism requires further
investigation.
TXNDC5 is a newly identified member of this protein
family. TXNDC5 has been genetically mapped to chro-
mosome 6p24.3. The gene encoding TXNDC5 is
approximately 845.2 k bp, and it i s divided into 13
exons. The present study genotyped 96 SNPs flanking
the TXNDC5 gene through Illumina GoldenGate assays.
Further, the study also genotyped four tag SNPs in the
TXNDC5 gene using the Taqman method to confirm
association to RA in a large number of samples. Both
methods revealed the strong association of rs443861
with RA, indicating a genetic effect of TXNDC5 on RA
risk. Although the genetic data of the present study
indicated the possible association of TXNDC5 to RA,
not enough data support the idea that the increased
expression was caused by a genetic mechanism. The
increased expression of TXNDC5 could be induced by
hypoxia in RA rather t han genetic variation of the gene.
To determine whether variations in the TXNDC5 g ene
contributed to the risk of developing nonsegmental viti-
ligo (NSV), Jeong et al. conducted a case-control asso-
ciation study within a Korean population. They
genotyped seven SNPs and found that three exonic
SNPs (rs1043784, rs77641 28 and rs8643) were statisti-
cally associated with NSV. The haplotypes AGG and
GAA, consisting of rs1043784, rs7764128 and rs8643,
demonstrated a significant association with NSV [18].
Lin et al. reported that SNP rs13873 and haplotypes
rs1225934 to rs13873 of BMP6-TXNDC5 genes were
significantly associated with schizophrenia [19]. These
reports indicate that TXNDC5 plays a role in the patho-
genesis of other diseases . Our results demonstrated that
Table 3 Allele and genotype frequencies in a case-control cohort of patients with AS (Continued)
G 50 (0.500) 109 (0.341) 0.516588 (0.327716 to 0.814312)
AA 14 (0.280) 72 (0.450) 0.020441
AG 22 (0.440) 67 (0.419)
GG 14 (0.280) 21 (0.131)
rs368074 C 50 (0.500) 109 (0.341) 0.004146 1.935780 (1.228031 to 3.051425)
G 50 (0.500) 211 (0.659) 1.935780 (1.228031 to 3.051425)
CC 14 (0.280) 21 (0.131) 0.020441
CG 22 (0.440) 67 (0.419)
GG 14 (0.280) 72 (0.450)
rs1225954 A 50 (0.500) 109 (0.341) 0.004146 1.935780 (1.228031 to 3.051425)
G 50 (0.500) 11 (0.659) 1.935780 (1.228031 to 3.051425)
AA 14 (0.280) 21 (0.131) 0.020441
AG 22 (0.440) 67 (0.419)
GG 14 (0.280) 72 (0.450)
rs1225955 A 50 (0.500) 108 (0.338) 0.003427 1.962963 (1.244946 to 3.095092)
G 50 (0.500) 212 (0.662) 1.962963 (1.244946 to 3.095092)
AA 14 (0.280) 21 (0.131) 0.018534
AG 22 (0.440) 66 (0.412)
GG 14 (0.280) 73 (0.456)
rs13209404 A 30 (0.300) 59 (0.184) 0.013556 1.895884 (1.135508 to 3.165434)
G 70 (0.700) 261 (0.816) 1.895884 (1.135508 to 3.165434)
AA 4 (0.080) 7 (0.044) 0.043599
AG 22 (0.440) 45 (0.281)
GG 24 (0.480) 108 (0.675)
rs3812162* A 70 (0.700) 268 (0.838) 0.002475 0.452736 (0.268969 to 0.762060)
C 30 (0.300) 52 (0.163) 0.452736 (0.268969 to 0.762060)
AA 23 (0.460) 114 (0.713) 0.004576
AC 24 (0.480) 40 (0.250)
CC 3 (0.060) 6 (0.037)
160 controls & 266 cases were observed; *represents tag SNP. 95% CI, 95% confidence interval; AS, ankylosing spondylitis; SNP, single nucleotide polymorphism.
Chang et al. Arthritis Research & Therapy 2011, 13:R124
/>Page 12 of 16
Figure 4 LD plot of the 96 genotyped SNPs in the TXNDC5 gene.(A) Linkage disequilibrium in the RA group. (B) Linkage disequilibrium in the AS
group. Red areas representing higher levels of LD. Blue areas represent LD comparisons with low confidence of estimation. Dark triangles represent
haplotype blocks. Numbers in squares are D’ values. AS, ankylosing spondylitis; RA, rheumatoid arthritis; SNP, single nucleotide polymorphism.
Table 4 Haplotype frequencies in a case-control cohort of patients with rheumatoid arthritis
Haplotype Freq. Case, Control Ratio Counts Case, Control Frequencies P-Value
Block 1
AGG 0.827 426.9: 101.1, 273.0: 45.0 0.808, 0.858 0.0625
GAA 0.145 81.0: 447.0, 42.0: 276.0 0.153, 0.132 0.3939
AAG 0.012 7.8: 520.2, 2.0: 316.0 0.015, 0.006 0.2649
Block 2
AA 0.814 418.9: 109.1, 269.9: 48.1 0.793, 0.849 0.0446
GG 0.155 87.9: 440.1, 42.9: 275.1 0.166, 0.135 0.2187
AG 0.024 15.1: 512.9, 5.1: 312.9 0.029, 0.016 0.2441
Block 3
GAAG 0.597 297.7: 230.3, 207.0: 111.0 0.564, 0.651 0.0125
AGGA 0.236 135.3: 392.7, 64.0: 254.0 0.256, 0.201 0.0674
AGAG 0.146 83.8: 444.2, 40.0: 278.0 0.159, 0.126 0.1902
AAAG 0.012 6.1: 521.9, 4.0: 314.0 0.012, 0.013 0.8831
Chang et al. Arthritis Research & Therapy 2011, 13:R124
/>Page 13 of 16
Table 4 Haplotype frequencies in a case-control cohort of patients with rheumatoid arthritis (Continued)
Block 4
GAGGGGA 0.6 296.8: 227.2, 207.0: 109.0 0.566, 0.655 0.0112
AGCAAAC 0.202 120.9: 403.1, 49.0: 267.0 0.231, 0.155 0.0081
GGCAAGA 0.149 83.0: 441.0, 42.0: 274.0 0.158, 0.133 0.3157
AGCAAGA 0.022 10.1: 513.9, 8.0: 308.0 0.019, 0.025 0.5599
AGCAAAA 0.017 6.0: 518.0, 8.0: 308.0 0.012, 0.025 0.1299
Block 5
GG 0.669 344.6: 183.4, 220.9: 97.1 0.653, 0.695 0.2075
AA 0.213 112.6: 415.4, 67.6: 250.4 0.213, 0.213 0.9829
AG 0.117 69.7: 458.3, 29.4: 288.6 0.132, 0.092 0.0828
Block 6
AA 0.715 380.5: 145.5, 222.8: 95.2 0.723, 0.701 0.4774
AG 0.18 88.7: 437.3, 63.5: 254.5 0.169, 0.200 0.2564
GG 0.1 53.3: 472.7, 31.5: 286.5 0.101, 0.099 0.9173
Block 7
AA 0.699 374.8: 153.2, 216.9: 101.1 0.710, 0.682 0.3934
AG 0.214 110.9: 417.1, 70.1: 247.9 0.210, 0.220 0.7211
GG 0.085 41.1: 486.9, 30.9: 287.1 0.078, 0.097 0.3288
Block 8
AG 0.531 294.0: 232.0, 153.8: 164.2 0.559, 0.484 0.0336
AA 0.376 187.8: 338.2, 129.2: 188.8 0.357, 0.406 0.1518
GA 0.092 42.9: 483.1, 34.8: 283.2 0.082, 0.109 0.1742
Table 5 Haplotype frequencies in a case-control cohort of patients with ankylosing spondylitis
Haplotype Freq. Case, control ratio counts Case, control frequencies P-value
Block 1
AGGG 0.755 75.0: 27.0, 242.0: 76.0 0.735, 0.761 0.5994
GAAA 0.136 15.0: 87.0, 42.0: 276.0 0.147, 0.132 0.7006
AAGG 0.1 11.0: 91.0, 31.0: 287.0 0.108, 0.097 0.7616
Block 2
AAAGAAG 0.541 45.0: 57.0, 182.2: 135.8 0.441, 0.573 0.0198
GAAAGGA 0.23 34.0: 68.0, 62.5: 255.5 0.333, 0.196 0.0043
GGGAGAG 0.126 13.0: 89.0, 40.0: 278.0 0.127, 0.126 0.9686
GAAGAAG 0.065 6.0: 96.0, 21.3: 296.7 0.059, 0.067 0.7731
Block 3
AGGAGGGGA 0.609 49.7: 51.9, 206.0: 112.0 0.489, 0.648 0.0044
CGAGCAAAC 0.187 29.8: 71.8, 49.0: 269.0 0.293, 0.154 0.0018
CAGGCAAGA 0.134 14.3: 87.3, 42.0: 276.0 0.140, 0.132 0.829
CGAGCAAAA 0.022 1.2: 100.4, 8.0: 310.0 0.012, 0.025 0.4324
CGAGCAAGA 0.017 4.0: 97.6, 3.0: 315.0 0.039, 0.010 0.0408
CAAGCAAGA 0.012 0.0: 101.6, 5.0: 313.0 0.000, 0.016 0.2042
Block 4
GG 0.664 58.0: 44.0, 221.0: 97.0 0.569, 0.695 0.0187
AA 0.228 28.0: 74.0, 67.7: 250.3 0.275, 0.213 0.1962
AG 0.108 16.0: 86.0, 29.3: 288.7 0.157, 0.092 0.067
Block 5
AAA 0.523 45.9: 56.1, 173.7: 144.3 0.450, 0.546 0.0915
AGC 0.29 33.3: 68.7, 88.6: 229.4 0.327, 0.279 0.3548
GGC 0.097 7.6: 94.4, 33.0: 285.0 0.075, 0.104 0.3851
AAC 0.072 10.7: 91.3, 19.4: 298.6 0.105, 0.061 0.1339
AGA 0.013 4.1: 97.9, 1.3: 316.7 0.040, 0.004 0.0053
Chang et al. Arthritis Research & Therapy 2011, 13:R124
/>Page 14 of 16
Table 5 Haplotype frequencies in a case-control cohort of patients with ankylosing spondylitis (Continued)
Block 6
AAA 0.709 77.9: 24.1, 219.8: 98.2 0.764, 0.691 0.159
AGG 0.101 9.5: 92.5, 32.9: 285.1 0.093, 0.104 0.7639
GGG 0.096 9.4: 92.6, 30.9: 287.1 0.092, 0.097 0.8872
AGA 0.084 5.0: 97.0, 30.1: 287.9 0.049, 0.095 0.1475
Block 7
AA 0.683 70.0: 32.0, 217.0: 101.0 0.686, 0.682 0.9415
AG 0.221 23.0: 79.0, 70.0: 248.0 0.225, 0.220 0.9096
GG 0.095 9.0: 93.0, 31.0: 287.0 0.088, 0.097 0.7819
Block 8
GAAGA 0.49 53.9: 48.1, 151.8: 166.2 0.529, 0.477 0.3656
GAAAA 0.198 21.1: 80.9, 62.1: 255.9 0.206, 0.195 0.8077
AAAAG 0.14 14.0: 88.0, 44.9: 273.1 0.137, 0.141 0.9123
AAAAA 0.059 3.0: 99.0, 22.0: 296.0 0.029, 0.069 0.14
ACGAA 0.057 5.0: 97.0, 19.0: 299.0 0.049, 0.060 0.6831
AAGAA 0.042 4.0: 98.0, 13.9: 304.1 0.039, 0.044 0.8369
Block 9
AT 0.517 53.0: 49.0, 164.0: 154.0 0.520, 0.516 0.9455
GA 0.28 26.6: 75.4, 91.0: 227.0 0.261, 0.286 0.6165
GT 0.203 22.4: 79.6, 63.0: 255.0 0.220, 0.198 0.6357
Block 10
AG 0.802 78.2: 23.8, 258.5: 59.5 0.767, 0.813 0.3066
GA 0.161 18.7: 83.3, 48.8: 269.2 0.184, 0.153 0.4683
GG 0.032 3.8: 98.2, 9.5: 308.5 0.037, 0.030 0.7032
Table 6 Allele and genotype frequencies in a case-control cohort of patients with RA
dbSNP identity Allele/
Genotype
No. of patients with RA (%) No. of controls (%) Fisher’s P-value
rs2277105 C 1581 (0.840) 1512 (0.848) 0.491098
O(freq) 19 (0.010) 12 (0.007)
T 283 (0.150) 260 (0.146)
CC 670 (0.719) 650 (0.734) 0.549842
CT 241 (0.259) 212 (0.239)
TT 21 (0.023) 24 (0.027)
rs11962800 A 1568 (0.831) 1523 (0.853) 0.173781
O(freq) 15 (0.008) 11 (0.006)
G 304 (0.161) 251 (0.141)
AA 656 (0.701) 656 (0.740) 0.184145
AG 256 (0.274) 211 (0.238)
GG 24 (0.026) 20 (0.023)
rs443861 A 357 (0.190) 275 (0.154) 0.00832
O(freq) 19 (0.010) 12 (0.007)
G 1507 (0.800) 1497 (0.839)
AA 51 (0.055) 26 (0.029) 0.01011
AG 255 (0.274) 223 (0.252)
GG 626 (0.672) 637 (0.719)
rs369086 A 485 (0.257) 460 (0.258) 0.510123
O(freq) 18 (0.010) 11 (0.006)
G 1381 (0.733) 1314 (0.736)
AA 61 (0.065) 71 (0.080) 0.260584
AG 363 (0.389) 318 (0.359)
GG 509 (0.546) 498 (0.561)
898 controls and 951 RA cases observed. RA, rheumatoid arthritis; SNP, single nucleotide polymorphism
Chang et al. Arthritis Research & Therapy 2011, 13:R124
/>Page 15 of 16
rs1043784, rs7764128, rs1225934 and rs8643 were not
significantly associated with RA and AS.
Conclusions
Our study demonstrated significantly increased TXNDC5
expression in the synovium and blood of RA patients,
which m ay contribute to the i rregular angiogenesis and
abnormal cell differentiation observed in the synovial
membrane. T he study also revealed the genetic effect of
TXNDC5 on RA and AS risk.
Additional material
Additional file 1: Supplementary materials and methods. This table
summarizes the clinical data of patients with RA, OA and AS.
Additional file 2: Supplementary results. This table provides the raw
microarray data to perform association, LD and haplotype analysis. We
genotyped 96 SNPs across the TXNDC5 gene from 267 Han Chinese
patients with RA, 51 patients and 160 control individuals. All SNPs
yielded genotype data, and the study sample success rate was 99.1%.
Abbreviations
AS: ankylosing spondylitis; DMARD: disease-modifying anti-rheumatic drug;
KLH: keyhole limpet hemocyanin; LD: linkage disequilibrium; MAF: minor
allele frequencies; NSAID: non-steroidal anti-inflammatory drugs; NSV:
nonsegmental vitiligo; OA: osteoarthritis; PDI: disulfide isomerase domain; RA:
rheumatoid arthritis; SDS-PAGE: sodium dodecyl sulphate polyacrylamide gel
electrophoresis; SLE: systemic lupus erythematosus; SNP: single nucleotide
polymorphism; TXNDC5: Thioredoxin domain containing 5; UTR:
untranslational regions
Acknowledgements
This study was supported by the National Natural Science Foundation of
China (NTFC) (30972720), the National Basic Research Program of China
(2010CB529105), the Provincial Natural Science Foundation of Shandong
(ZR2010CM1032, Y2007C132, Y2008C130) and the Shandong Taishan
Scholarship.
Author details
1
National Laboratory for Bio-Drugs of Ministry of Health, Provincial
Laboratory for Modern Medicine and Technology of Shandong, Research
Center for Medicinal Biotechnology, Shandong Academy of Medical
Sciences, Jingshi Road 18877, Jinan, Shandong, 250062. P. R. China.
2
Orthopedic Surgery Center of Shandong Qianfoshan Hospital. Jingshi Road
16766, Jinan, Shandong, 250014. P. R. China.
Authors’ contributions
XC designed and executed the study and prepared the manuscript. JP and
KF performed the genotyping. YZ and LW performed the Western blots and
real time PCR. XY collected tissue samples. All authors have read and
approved the final manuscript for publication.
Competing interests
The authors declare that they have no competing interests.
Received: 11 January 2011 Revised: 24 February 2011
Accepted: 29 July 2011 Published: 29 July 2011
References
1. Edman JC, Ellis L, Blacher RW, Roth RA, Rutter WJ: Sequence of protein
disulphide isomerase and implications of its relationship to thioredoxin.
Nature 1985, 317:267-270.
2. Freedman RB, Hirst TR, Tuite MF: Protein disulphide isomerase: building
bridges in protein folding. Trends Biochem Sci 1994, 19:331-336.
3. Knoblach B, Keller BO, Groenendyk J, Aldred S, Zheng J, Lemire BD, Li L,
Michalak M: ERp19 and ERp46, new members of the thioredoxin family
of endoplasmic reticulum proteins. Mol Cell Proteomics 2003, 2:1104-1109.
4. Charlton HK, Webster J, Kruger S, Simpson F, Richards AA, Whitehead JP:
ERp46 binds to AdipoR1, but not AdipoR2, and modulates adiponectin
signalling. Biochem Biophys Res Commun 2010, 392:234-239.
5. Veale DJ, Fearon U: Inhibition of angiogenic pathways in rheumatoid
arthritis: potential for therapeutic targeting. Best Pract Res Clin Rheumatol
2006, 20:941-947.
6. Chang X, Cui Y, Zong M, Zhao Y, Yan X, Chen Y, Han J: Identification of
proteins with increased expression in rheumatoid arthritis synovial
tissues. J Rheumatol 2009, 36:872-880.
7. Muz B, Khan MN, Kiriakidis S, Paleolog EM: The role of hypoxia and
HIF-dependent signaling events in rheumatoid arthritis. Arthritis Res Ther
2009, 11:201.
8. Hitchon CA, El-Gabalawy HS, Bezabeh T: Characterization of synovial tissue
from arthritis patients: a proton magnetic resonance spectroscopic
investigation. Rheumatol Int 2009, 29:1205-1211.
9. The International HapMap Consortium: The International HapMap Project.
Nature 2003, 426:789-796.
10. The International HapMap Consortium: Integrating ethics and science in
the International HapMap Project. Nat Rev Genet 2004, 5:467-475.
11. Barrett JC, Fry B, Maller J, Daly MJ: Haploview: analysis and visualization of
LD and haplotype maps. Bioinformatics 2005, 21:263-265.
12. Li Z, Zhang Z, He Z, Tang W, Li T, Zeng Z, He L, Shi Y: A partition-ligation-
combination-subdivision EM algorithm for haplotype inference with
multiallelic markers: update of the SHEsis. Cell Res 2009, 19:519-523.
13. Alivernini S, Fedele AL, Cuoghi I, Tolusso B, Ferraccioli G: Citrullination: the
loss of tolerance and development of autoimmunity in rheumatoid
arthritis. Reumatismo 2008, 60:85-94.
14. Senolt L, Pavelka K, Housa D, Haluzík M: Increased adiponectin is
negatively linked to the local inflammatory process in patients with
rheumatoid arthritis. Cytokine 2006, 35:247-252.
15. Frommer KW, Zimmermann B, Meier FM, Schröder D, Heil M, Schäffler A,
Büchler C, Steinmeyer J, Brentano F, Gay S, Müller-Ladner U, Neumann E:
Adiponectin-mediated changes in effector cells involved in the
pathophysiology of rheumatoid arthritis. Arthritis Rheum 2010,
62:2886-2899.
16. Choi HM, Lee YA, Lee SH, Hong SJ, Hahm DH, Choi SY, Yang HI, Yoo MC,
Kim KS: Adiponectin may contribute to synovitis and joint destruction in
rheumatoid arthritis by stimulating vascular endothelial growth factor,
matrix metalloproteinase-1, and matrix metalloproteinase-13 expression
in fibroblast-like synoviocytes more than proinflammatory mediators.
Arthritis Res Ther 2009, 11:R161.
17. Tian F, Zhou X, Wikström J, Karlsson H, Sjöland H, Gan LM, Borén J,
Akyürek LM: Protein disulfide isomerase increases in myocardial
endothelial cells in mice exposed to chronic hypoxia: a stimulatory role
in angiogenesis. Am J Physiol Heart Circ Physiol 2009, 297:H1078-1086.
18. Jeong KH, Shin MK, Uhm YK, Kim HJ, Chung JH, Lee MH: Association of
TXNDC5 gene polymorphisms and susceptibility to nonsegmental
vitiligo in the Korean population. Br J Dermatol 2010, 162:759-764.
19. Lin SH, Liu CM, Liu YL, Shen-Jang Fann C, Hsiao PC, Wu JY, Hung SI,
Chen CH, Wu HM, Jou YS, Liu SK, Hwang TJ, Hsieh MH, Chang CC,
Yang WC, Lin JJ, Chou FH, Faraone SV, Tsuang MT, Hwu HG, Chen WJ:
Clustering by neurocognition for fine mapping of the schizophrenia
susceptibility loci on chromosome 6p. Genes Brain Behav 2009, 8:785-794.
doi:10.1186/ar3429
Cite this article as: Chang et al.: Investigating a pathogenic role for
TXNDC5 in rheumatoid arthritis. Arthritis Research & Therapy 2011 13:R124.
Chang et al. Arthritis Research & Therapy 2011, 13:R124
/>Page 16 of 16