Báo cáo y học: " Pathophysiological classification of chronic rhinosinusitis" pot
Bạn đang xem bản rút gọn của tài liệu. Xem và tải ngay bản đầy đủ của tài liệu tại đây (383.33 KB, 14 trang )
BioMed Central
Page 1 of 14
(page number not for citation purposes)
Respiratory Research
Open Access
Research
Pathophysiological classification of chronic rhinosinusitis
James N Baraniuk* and Hilda Maibach
Address: Georgetown University Proteomics Laboratory, Division of Rheumatology Immunology and Allergy, Room B105, Lower Level Kober-
Cogan Building, Georgetown University, 3800 Reservoir Road, NW Washington, DC 20007-2197, USA
Email: James N Baraniuk* - ; Hilda Maibach -
* Corresponding author
Abstract
Background: Recent consensus statements demonstrate the breadth of the chronic rhinosinusitis
(CRS) differential diagnosis. However, the classification and mechanisms of different CRS
phenotypes remains problematic.
Method: Statistical patterns of subjective and objective findings were assessed by retrospective
chart review.
Results: CRS patients were readily divided into those with (50/99) and without (49/99) polyposis.
Aspirin sensitivity was limited to 17/50 polyp subjects. They had peripheral blood eosinophilia and
small airways obstruction. Allergy skin tests were positive in 71% of the remaining polyp subjects.
IgE was<10 IU/ml in 8/38 polyp and 20/45 nonpolyp subjects (p = 0.015, Fisher's Exact test). CT
scans of the CRS without polyp group showed sinus mucosal thickening (probable glandular
hypertrophy) in 28/49, and nasal osteomeatal disease in 21/49. Immunoglobulin isotype deficiencies
were more prevalent in nonpolyp than polyp subjects (p < 0.05).
Conclusion: CRS subjects were retrospectively classified in to 4 categories using the algorithm of
(1) polyp vs. nonpolyp disease, (2) aspirin sensitivity in polyposis, and (3) sinus mucosal thickening
vs. nasal osteomeatal disease (CT scan extent of disease) for nonpolypoid subjects. We propose
that the pathogenic mechanisms responsible for polyposis, aspirin sensitivity, humoral
immunodeficiency, glandular hypertrophy, eosinophilia and atopy are primary mechanisms
underlying these CRS phenotypes. The influence of microbial disease and other factors remain to
be examined in this framework. We predict that future clinical studies and treatment decisions will
be more logical when these interactive disease mechanisms are used to stratify CRS patients.
Introduction
The syndrome of chronic rhinosinusitis (CRS) has been
defined by mucopurulent anterior or posterior nasal dis-
charge, regional facial or dental pain, sinus region tender-
ness, fetid odor, and other symptoms that do not respond
to 12 weeks of adequate therapy [1,2]. This clinical defini-
tion has been updated to divide CRS into those with
("CRSwNP") and without nasal polyposis ("CRSsNP"; "s"
= without) [3-5]. However, additional differences in pres-
entation, natural history, background of atopy or other
phenotypes, eosinophilia, pathophysiological mecha-
nisms, and responses to therapy may occur within each
subset. A classification based on pathophysiological
mechanisms would be valuable for stratifying patients for
optimal treatment and for clinical study [5-8].
Published: 19 December 2005
Respiratory Research 2005, 6:149 doi:10.1186/1465-9921-6-149
Received: 16 June 2005
Accepted: 19 December 2005
This article is available from: />© 2005 Baraniuk and Maibach; licensee BioMed Central Ltd.
This is an Open Access article distributed under the terms of the Creative Commons Attribution License ( />),
which permits unrestricted use, distribution, and reproduction in any medium, provided the original work is properly cited.
Respiratory Research 2005, 6:149 />Page 2 of 14
(page number not for citation purposes)
The complexity of CRS is apparent from the many individ-
ual risk factors that have been associated with this diagno-
sis, and the inability of any single risk factor to explain the
syndrome. Factors include atopy, humoral immunodefi-
ciency and other immune deviations, autocrine and para-
crine eosinophilic disease, aspirin and other nonsteroidal
antiflammatory drug (NSAID) sensitivity ("Triad
Asthma"), nasal polyposis, and glandular hypertrophy
[7,8]. Many reductionist studies have investigated individ-
ual aspects of CRS, but these were generally not designed
to simultaneously examine multiple clinical and objective
variables that may discriminate between phenotypes.
Because of the wide spectrum of opinions in the literature,
we chose to return to "first principles" and evaluate, rank
and classify subjects into logical subsets of CRS pathology.
We hypothesized that the analysis of multiple variables in
well characterized CRS subjects would lead to a better
understanding of the relationships between variables.
These insights may generate new hypotheses to explain
the discrete histopathological subsets of CRS [1-8].
This first pilot study was a retrospective analysis of the last
100 consecutive chronic sinusitis subjects seen by one
allergist in a tertiary care setting. Limitations due to poten-
tially biased patient referral patterns and examination of
more severe patients than commonly seen in general prac-
tice were recognized at the onset. However, retrospective
analysis was required to define the most critical factors
associated with CRS so that prospective studies could
focus on the most relevant issues. Variables included
demographics, aspirin – NSAID sensitivity, allergy skin
test results, pulmonary function tests, serum IgE and other
immunoglobulin (Ig) subclass levels, and peripheral
blood eosinophilia. Data were collated and variables con-
verted to qualitative measures to facilitate contingency
table (Chi
2
) analysis. This identified the most prevalent
variables, and permitted logical subdivision of the study
population. The aim was to identify the most coherent
algorithm for clinical evaluation of CRS subjects.
The study population was split into groups with nasal pol-
yps, and the remainder who did not have nasal polyps [3-
5]. The polyposis group was subdivided by the presence of
aspirin sensitivity into those with nasal polyps and aspi-
rin sensitivity (NPasa), and nasal polyps with other fea-
tures (NPother). Subjects without polyps were subdivided
based on CT scan evidence of nasal disease only, or nasal
+ sinus mucosal thickening > 5 mm. The group with only
narrowing of the osteomeatal complex (OMC) was sepa-
rated from subjects with sinus involvement (CRSsNP).
This represents a modification of consensus guidelines
[4,5] by limiting the CRSsNP group to those with radio-
logical evidence of sinus involvement. In the absence of
nasal polyposis, we proposed that the sinus thickening in
the CRSsNP group was due to glandular hypertrophy
[7,8].
Portions of this work have been presented as abstracts at
scientific meetings [9,10].
Methods
Subjects
Charts from 100 consecutive chronic sinusitis subjects
were assessed retrospectively. The clinical diagnosis of
chronic sinusitis was made by contemporary criteria [1,2]
based on chronic nasal discharge, sinus region pain and
tenderness, and poor symptomatic responses to antibiot-
ics and other therapies for at least 12 weeks. Most gave a
history of recurrent acute sinusitis that progressed to CRS
over a period of several years. Patients were referred by
otolaryngologists, pulmonologists, general internists, and
by self-referral. Subjects with allergic rhinitis or nonaller-
gic rhinitis without chronic sinusitis complaints were
excluded.
Independent groups of CRS, allergic rhinitis, and healthy
subjects with neither condition provided representative
control groups. They were recruited to concurrent clinical
research studies of fatigue, pain sensitivity, irritant rhini-
tis, and tobacco sensitivity that did not include CRS as an
inclusion or exclusion criterion [11,13-18]. However,
because of the nature of their studies, they did not have
the same extensive laboratory evaluation at the clinical
CRS patients.
Variables
CT scan severity was used as a study variable and so was
not required for the clinical diagnosis of sinusitis [1,2].
Coronal CT scans were scored according to the May classi-
fication [20] in order to be consistent with our previous
studies [7,8]. Normal nasal and sinus CT scans were
scored as Grade 0. Grade 1 indicated osteomeatal narrow-
ing without sinus mucosal thickening (OMC). Thickening
or opacification limited to the ethmoid sinuses was Grade
2 disease. Grade 3 required bilateral disease involving
mucosal thickening, air-fluid levels, or opacification of
individual larger sinuses. Pansinusitis with opacification
of ethmoid, maxillary, frontal and potentially sphenoid
sinuses was classified as Grade 4. In practical terms, 3
groups were identified. The OMC group had nasal disease
only (Grade 1). Sinus involvement (Grades 2 to 4) was
present in both the polyp and CRSsNP groups.
Other variables included age; gender; race and ethnicity;
strong and convincing history of aspirin or NSAID sensi-
tivity causing airway or angioedema symptoms; the pres-
ence of polyps by visual, rhinoscopic, or surgical
examination; blood eosinophilia; serum immunoglobu-
lin (Ig) concentrations; pulmonary function tests; and
Respiratory Research 2005, 6:149 />Page 3 of 14
(page number not for citation purposes)
allergy skin test results. The highest eosinophil counts and
most deleterious pulmonary function and Ig results were
recorded in order to emphasize distinctions between sub-
jects. Eosinophil counts over 4% were scored as elevated
(score = 1 vs. ≤ 4% = normal; score = 0). The mean value
was determined for all subjects with counts >4%.
The serum concentrations of IgE, IgA, IgM, IgG1, IgG2,
IgG3, and IgG4 were measured at 3 clinical laboratories.
Unfortunately, over the time period of this study, the
ranges of normal for each isotype changed in each labora-
tory. This may have reflected each laboratory's individual
efforts to define normal ranges. As a result, we qualita-
tively defined Ig isotype levels as either "normal" or below
the lower limits of normal for each laboratory ("defi-
cient"). Since there is no absolute lower limit of normal
for IgE, these concentrations were converted to a qualita-
tive, logarithmically-based scale with levels of <0 IU/ml
("absent IgE") [19], 10 to 99.9 ("normal"), and > 100 IU/
ml ("elevated"). The independent control subjects had IgE
measured in parallel using the same laboratories [13,14].
The other immunoglobulin isotypes were measured and
qualitatively scored as normal or elevated (score = 1), or
below the lower limit of normal (score = 0) for the specific
laboratory doing the test.
Puncture skin tests to geographically significant allergens
were scored on a 0 to 4 point scale as previously described
[11,12]. The allergens were birch, maple, oak, grass mix,
rye grass, ragweed, plantain, cat, dog, cockroach, Dermat-
ophagoides farinae, D. pteronyssinus, Alternaria, Aspergillus,
Epicoccum, Fusarium, Helminthosporium, Monilia, and Peni-
cillium (Hollister-Stier, Spokane, WA). If the histamine
was 2+ or less and no allergen test was > 3+, then intrader-
mal tests were performed with mixed trees, Southern grass
mix #5, ragweed, mixed weeds, cat, dog, cockroach, the 2
dust mites, and mixed molds. If 2 or more tests had results
at the 3+ or 4+ levels, then the subject was considered
"skin test positive". Both the quantitative number of pos-
itive skin tests, and the qualitative, nominal "positive"
(score = 1) and "negative" (score = 0) results were
recorded. Data were then tabulated for trees, grasses,
weeds, ragweed, fungi, cat (included all dog sensitive sub-
jects), D. farinae and D. pteronyssinus (included all cock-
roach reactors).
Spirometry was recorded as the FEV1/FVC ratio, and abso-
lute and percent of predicted values for FVC, FEV1, and
FEF
25%–75%
. Percent predicted values were qualitatively
scored as positive (score = 1) when < 70%, and normal
(negative, 0) when ≥ 70%.
Data analysis
All subject data were hand entered without patient identi-
fiers into Excel (Microsoft, Redmond, WA) spreadsheets,
and assigned random, anonymous 5 digit identification
codes. No patient identifiers were included on the work-
sheets, and the codes were not recorded in patient charts.
The data were visually inspected and verified. One subject
did not meet the review criteria at this stage and was
removed from consideration. Some CRS subjects did not
have data for all the variables, but were retained in the
database. The issue of missing data points was addressed
in subset analysis by including only those subjects with
the pertinent data. The data were transferred into a SAS
9.0 (Carey, NC) database for a further review of internal
consistency and statistical analysis.
The frequency of each variable was determined for the
study population. Frequencies in females and males were
compared to assess gender effects. Continuous variables
such as the number of positive skin tests and pulmonary
function test results were compared between the NPasa,
NPother, CRSsNP and OMC categories by ANOVA fol-
lowed by 2-tailed, unpaired Student's t-tests. Bonferroni
corrections for multiple comparisons were not used for
this pilot investigation. Means or geometric means and
95% confidence intervals were displayed with significance
defined for p < 0.05. Qualitative data (0, 1) such as the
presence or absence of reduced airflow (e.g. FEV1/FVC ≤
70% of predicted) or the presence of atopy were com-
pared between these 4 categories by Fisher's Exact test
between groups. The tables displayed these significance
levels using a standard format for footnotes. Significant
ANOVA results for the 4 groups were identified by super-
script capital letters. Fisher's Exact test results were given in
[] when proportions were compared to NPasa data, and
{} when compared to NPother. T-test results were shown
as footnotes for NPasa vs. the other 3 groups, OMC vs.
NPother and CRSsNP, and NPother vs. CRSsNP.
Multivariate and principal component analyses were used
to determine the variables that best characterized each
group of patients. Factor analysis permitted inferences
about potential common mechanisms within each cate-
gory. Multilogistic and multilinear regression analysis
were also applied, but the complexity of the interactions
between variables did not define any significant, predic-
tive models (e.g. general linear modeling).
Results
Demographics
The average age of the study population (n = 99) was 45.1
yr (42 to 47; mean and 95% C.I.) with 27% males. The
racial composition was 88% Caucasian, 8% African-
American, 3% Asian, and 5% Hispanic ethnicity. Drugs
used by the 99 subjects were topical nasal glucocorticoids
(n = 79), antihistamines (72), daily nasal saline irrigation
(52), inhaled glucocorticoids (51), short- and long-acting
Respiratory Research 2005, 6:149 />Page 4 of 14
(page number not for citation purposes)
bronchodilators (48), ipratropium bromide nasal spray
(39), and leukotriene receptor antagonists (32).
Stratification by physical examination, CT scan and
presumed histology
As described in the introduction, CRS subjects were read-
ily subdivided based on (a) polyposis (50% prevalence),
(b) aspirin sensitivity (17% prevalence), and (c) the May
grade of sinus CT scan severity (Grades 2, 3 and 4 versus
Grade 1) (Table 1). The 1
st
decision level was the presence
(50/99) or absence (49/99) of polyps. Aspirin sensitivity
was the 2
nd
decision level, and was present in 34% of
polyp but only 4% of nonpolyp subjects (p = 0.0001,
Chi
2
). The polyp group was divided into those with aspi-
rin/nonsteroidal anti-inflammatory drug sensitivity
(NPasa; n = 17) and those without this sensitivity
(NPother; n = 33). All the NPasa subjects had severe
asthma or laryngospasm symptoms upon NSAID expo-
sure. Two nonpolyp subjects had aspirin sensitivity, but
their reactions were limited to urticaria and angioedema.
They had no airway symptoms.
The NPasa and NPother subjects had May CT scan Grades
of 2, 3 and 4. The nonpolyp subjects were divided into 21
subjects with May Grade 1 (OMC, nasal disease only), and
28 subjects with May Grades 2, 3 and 4 (CRSsNP). Since
Malekzadeh has demonstrated that polyp and glandular
hypertrophy subsets were mutually exclusive [7,8], the
CRSsNP subjects were assumed to have glandular hyper-
trophy. May CT scan severity grades were significantly
higher for NPasa (3.35) and NPother (3.00) than CRSsNP
(2.43) and OMC (1) groups (table 1). The NPasa group
was significantly older than the NPother and CRSsNP
groups.
Peripheral eosinophilia > 4% was qualitatively present in
65% of NPasa subjects. This was significantly higher than
the CRSsNP (33%) and OMC (20%) (p < 0.01 for each
comparison). Peripheral eosinophilia > 4% was interme-
diate in the NPother group (39%). When eosinophils
were elevated, their mean concentration was 10.9% (8.9
to 12.9; n = 34 total).
Stratification by spirometry
Asthma was highly prevalent in CRS (range 68% to 88%,
table 2). "Triad Asthma" was present in 15/17 NPasa sub-
jects. The qualitative finding of FEV
1
/FVC ratios < 70%
was present in 75% of the NPasa group. This group had
significantly worse airflow obstruction than the NPother
(41%), CRSsNP (21%) and OMC (14%) groups (p =
0.004 by ANOVA). FEF
25%–75%
was below < 70% of pre-
dicted in 91% of NPasa, compared to 55% of NPother,
29% of CRSsNP, and 43% of OMC (p = 0.014 by
ANOVA).
Table 1: Clinical subdivisions of chronic rhinosinusitis based on nasal polyposis and aspirin – sensitivity (mean with 95% CI, or % of
group).
1
st
Decision Chronic Rhinosinusitis (CRS; n = 99)
Nasal Polyps Present: N = 50 Absent: N = 49
2
nd
Decision Nasal Polyps with Aspirin
Sensitivity (NPasa)
Nasal Polyps with Other
Features (NPother)
CRS without (s) Nasal Polyps
(CRSsNP)
Osteomeatal Complex
Disease (OMC)
Aspirin Sensitivity 17/17 (100%) (airways) 0/33 (0%) [<10
-9
] (airways) 1/28 (4%) [<10
-9
] (urticaria) 1/21 (5%) [<10
-9
] (urticaria)
May CT Scan Grade
A
3.35 (3.02 to 3.69) 3.10 (2.85 to 3.34)
¶¶
2.43 (2.22 to 2.64)
§§§ † ¶
1 (1 to 1)
§§§
Blood Eos > 4%
B
11/17 (65%) 13/33 (39%) 9/27 (33%) [0.03] 4/20 (20%) [0.006]
% Males 4/17 (24%) 12/33 (36%) 8/28 (29%) 3/21 (14%)
Age (yr)
C
53.0 (48.1 to 57.9) 43.7 (39.1 to 48.3)
§
40.5 (35.7 to 45.4)
§§
46.7 (39.4 to 54.1)
ANOVA:
A
= 10
-20
;
B
= 0.042;
C
= 0.031. [p] = Fisher's Exact test vs. NPasa. Two-tailed, unpaired Student's t-tests:
§
p = 0.02;
§§
p = 0.002 and
§§§
p <
2 × 10
-5
vs. NPasa;
¶
p = 0.005 and
¶¶
p < 10
-13
vs. OMC;
†
p = 0.005 vs. NPother.
Table 2: Asthma and spirometry in chronic rhinosinusitis subsets (mean, 95% CI; or percentage).
Nasal Polyps with Aspirin
Sensitivity (NPasa)
Nasal Polyps with Other
Features (NPother)
CRS without Nasal Polyps
(CRSsNP)
Osteomeatal Complex
Disease (OMC)
Clinical Asthma 15/17 (88%) Triad Asthma 23/32 (72%) 19/28 (68%) 14/20 (70%)
Spirometry N = 12 N = 22 N = 14 N = 14
FEV
1
/FVC (%)
A
64.4% (59.8 to 69.0) 70.9% (65.3 to 76.5) 78.0% (72.3 to 83.6)
§
79.8% (73.6 to 86.0)
§§
FEV
1
/FVC<70%
A
9/12 (83%) 9/22 (41%) [<0.05] 3/14 (21%) [0.008] 2/14 (14%) [0.003]
FEF
25%–75%
(%) 48.4% (35.9 to 60.8) 59.7% (47.9 to 71.5) 73.9% (58.0 to 89.7) 69.5% (55.8 to 83.2)
FEF
25%–75%
<70%
B
10/11 (91%) 11/20 (55%) [0.04] 4/14 (29%) [0.002] 6/14 (43%) [0.02]
ANOVA:
A
= 0.005;
B
= 0.014. [p] = Fisher's Exact test vs. NPasa. Two-tailed, unpaired Student's t-tests:
§
p = 0.002, and
§§
p = 0.0009 vs. NPasa.
Respiratory Research 2005, 6:149 />Page 5 of 14
(page number not for citation purposes)
Stratification by positive allergy skin test results
The separate set of healthy control subjects had a fre-
quency of positive allergy skin tests of 42.9% (41.9 to 43.9
n = 792). This "background rate" of positive results was
compared to the CRS categories.
Skin tests were positive in 53 of 92 subjects (58%) (table
3). The remainder refused skin testing or had RAST tests.
The latter were not used to determine atopy status because
of variations between clinical laboratories over time
regarding grading and the levels for positive results.
The control level of 43% was the same as for NPasa (44%)
and OMC (41%). This suggested that atopy was present in
each category, but may have been a coincidental co-mor-
bidity. Allergic rhinitis may have been present, but was
unlikely to be a primary mechanism of CRS pathogenesis
in these two categories. Instead, other nonallergic mecha-
nisms must have predominated.
Positive skin tests were more common in the NPother
(71%) and CRSsNP (68%) groups. The proportion of
excess cases associated with atopy was 28% for NPother
(71% minus 43%) and 25% (68% minus 43%) for
CRSsNP. Atopy may have had a more significant patho-
genic role in these two categories by modifying or exacer-
bating other mechanisms responsible for polyposis and
glandular hypertrophy.
Dust mites, cat, trees, ragweed and grasses were the groups
of allergens with the highest frequencies of positive results
in the NPother and CRSsNP categories (table 3). Overall,
55% of CRS subjects had responses to "persistent" dust
mite, cat, and fungal allergens. Only 4% had solely sea-
sonal allergen reactivity. A clinical relationship was noted
between autumn (ragweed) and persistent (perennial,
dust mites, cat, fungi) allergen sensitization, viral upper
respiratory tract infections, and exacerbations of chronic
sinusitis that peaked between October and December in
our locale (personal observation).
Curiously, 6 subjects with IgE < 10 IU/ml had positive
allergy skin tests (bottom line, table 3). Three were in the
CRSsNP group. We speculate that these represented per-
sons who had lost the ability to synthesize substantial
amounts of circulating IgE, but still had allergen-specific
IgE bound to their cutaneous mast cells. This may indicate
a dynamic collapse of IgE production or B cell function in
hypertrophic chronic sinusitis (CRSsNP). Two of these
subjects had late phase responses indicating maintenance
of allergen-specific Th2 lymphocyte reactivity.
Eosinophil counts and the logarithm of IgE concentra-
tions were assessed. They were positively correlated only
for those subjects with negative allergy skin tests (ρ = 0.46;
p < 0.05). Peripheral blood eosinophilia was independent
of skin test reactivity. This suggested that unknown nonal-
lergic mechanism(s) contributed to both eosinophilia
and higher IgE levels in CRS.
Stratification by immunoglobulin deficiencies
About two-thirds of the population had measurements of
immunoglobulin isotypes including IgG subclasses. The
proportions of subjects per category with isotype levels
below the lower limits of normal and/or IgE < 10 IU/ml
were shown in table 4. The median number of low iso-
types per subject was 1.5 in NPasa, 0.5 in NPother, 2.5 in
CRSsNP and 1.0 in OMC. Strikingly, IgE was low in 44%
Table 3: Numbers of subjects per group with positive allergy skin tests (%).
Nasal Polyps with Aspirin
Sensitivity (NPasa)
Nasal Polyps with Other
Features (NPother)
CRS without (s) Nasal
Polyps (CRSsNP)
Osteomeatal Complex
Disease (OMC)
Group Sizes (N)16312817
N (%) Positive 7 (44%) 22 (71%) {0.03} 19 (68%) 7 (41%)
Trees 5 (31%) 12 (39%) {0.04} 10 (36%) 2 (12%)
Grasses 6 (38%) 10 (32%) 10 (36%) 4 (24%)
Ragweed 2 (13%) 11 (36%) 8 (29%) 2 (12%)
Weeds 4 (25%)5 (16%)7 (25%)2 (12%)
Mites (Df, Dp) 6 (38%) 15 (48%) 14 (50%) 5 (29%)
Cat 4 (25%) 13 (42%) 9 (32%) 3 (18%)
Dog 3 (19%) 6 (20%) 4 (14%) 0 (0%)
Fungi 3 (19%) 6 (20%) 10 (36%) 4 (24%)
Cockroach 1 (6%) 4 (13%) 5 (18%) 2 (12%)
Persistent
§
6 (38%) 21 (68%) [0.04] 17 (61%) 7 (41%)
Subjects with IgE <10 IU/ml
but positive skin tests
#1. Trees, grasses, weeds,
Df, Dp, cat
#1. Grasses #1. Trees, Df, Dp
#2. Cat
#3. Trees, grasses
#1. Grasses, ragweed,
weed, fungi, cat
[p] = Fisher's Exact test vs. NPasa; {p} vs. OMC. Df, Dermatophagoides farinae; Dp, D. pternonyssinus;
§
Persistent was defined as at least 1 positive
result to fungi, cat, D. farinae or D. pteronyssinus.
Respiratory Research 2005, 6:149 />Page 6 of 14
(page number not for citation purposes)
of CRSsNP and 45% of OMC subjects. These proportions
were significantly higher than NPother (17%; p = 0.03 by
Fisher's Exact tests). NPasa had an intermediate frequency
and lower sample size, and so was not significantly differ-
ent. Low serum IgE was most frequent in nonpolypoid
CRS groups.
Immunoglobulin subclass deficiencies were more fre-
quent in CRSsNP than NPother for IgG3 (44% vs. 14%),
IgA (28% vs. 10%), and IgM (39% vs. 14%). Low IgM was
more prevalent in CRSsNP than NPasa (39% vs. 8%). The
small numbers of subjects per group precluded statistical
significance. However, subjects with low IgE (<10 IU/ml)
plus low levels of either IgG1 or IgG3 were found more
frequently in the CRSsNP group (44%; p = 0.02 by
ANOVA). It was surprising to find such a high proportion
of CRS subjects with low levels of IgE and IgG subclasses
compared to IgA deficiency (table 5) [19,21,22]. The
numbers of subjects in each group with multiple isotypes
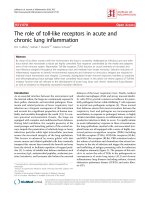
below the lower limits of normal were assessed. Both the
CRSsNP and OMC groups had higher proportions of sub-
jects with several low isotypes compared to the NPasa and
NPother groups (p < 0.05 for each comparison). This was
demonstrated by plotting the proportion of each group
who had low isotypes against the number of these defi-
ciencies per individual (figure 1). Curves were compared
at the midpoint of this range (20% cumulative proportion
for each group). These humoral immune deficits may
have played a permissive role in the development of the
glandular hypertrophy that was presumed to occur in
CRSsNP [7,8].
Table 4: Frequencies of immunoglobulin isotypes below the lower limits of normal.
Nasal Polyps with Aspirin
Sensitivity (NPasa)
Nasal Polyps with Other
Features (NPother)
CRS without (s) Nasal
Polyps (CRSsNP)
Osteomeatal Complex
Disease (OMC)
IgE<10 IU/ml 4/14 (29%) 4/24 (17%) 11/25 (44%) {0.03} 9/20 (45%) {0.03}
IgA 2/12 (17%) 2/21 (10%) 5/18 (28%) 2/14 (14%)
IgM 1/12 (8%) 3/21 (14%) 7/18 (39%) 3/14 (21%)
IgG1 4/12 (33%) 5/21 (24%) 8/18 (44%) 5/14 (36%)
IgG2 2/12 (17%) 2/21 (10%) 4/18 (22%) 2/14 (14%)
IgG3 3/12 (25%) 3/21 (14%) 8/18 (44%) 3/14 (21%)
IgG4 1/12 (8%) 3/21 (14%) 5/18 (28%) 3/14 (21%)
IgE+IgG1/3 *
A
2/12 (17%) 1/19 (5%) 8/18 (44%) {0.007} 2/14 (14%)
* IgE <10 IU/ml plus either low IgG1 or IgG3. ANOVA:
A
= 0.02. {p} = Fisher's Exact test vs. NPother.
Table 5: Qualitative stratification of clinical disorders and positive allergy skin tests by serum IgE (geometric mean, 95% C.I.).
IgE < 10 IU/ml 10 ≤ IgE ≤ 100 IU/ml IgE > 100 IU/ml
IgE 1.7 (0.8 to 2.9) 35.1 (28.1 to 43.7) 277 (212 to 364)
Clinical Asthma
B
14/29 (48%) 23/28 (82%) [0.005] 24/29 (83%) [0.005]
FEV1/FVC ≤ 70% 5/17 (29%) 7/18 (39%) 10/18 (56%)
FEF
25%–75%
≤ 70% 7/17 (41%) 11/17 (65%) 12/18 (67%)
Nasal Polyps 9/29 (31%) 15/28 (54%) 17/29 (59%) [0.02]
Eosinophilia > 4% 8/28 (29%) 12/28 (43%) 16/29 (55%) [0.03]
Positive Allergy Skin Test Results
N per group 28 26 26
+ Results/subject † 0.74 (0.10 to 1.30) 3.5 (1.82 to 5.43)
†
5.08 (3.90 to 6.27)
††
Trees
C
3 (11%) 6 (23%) {0.01} 15 (58%) [0.0003]
Grasses
A
4 (14%) 8 (31%) 12 (46%) [0.009]
Weeds 2 (7%) 7 (27%) [0.047] 4 (15%)
Ragweed
C
0 (0%) 8 (31%) [0.002] 12 (46%) [0.00003]
Fungi
B
1 (4%) 5 (19%) {0.049} 11 (42%) [0.0006]
Cat
B
3 (11%) 7 (27%) 13 (50%) [0.0002]
D. farinae
D
1 (4%) 12 (46%) [0.0002] 18 (69%) [10
-6
]
D. pteronyssinus
D
2 (7%) 10 (39%) [0.006] {0.03} 17 (65%) [10
-5
]
"Persistent"
§D
4 (14%) 15 (58%) [0.001] {0.01} 23 (88%) [10
-8
]
ANOVA:
A
= 0.04;
B
= 0.004;
C
= 0.0003;
D
< 0.00003. [p] = Fisher's Exact test vs. IgE<10 IU/ml; {p} vs. IgE>100 IU/ml. † Number of positive allergy
skin test results per subject (mean; 95% CI):
†
p = 0.003 and
††
p = 10
-7
vs. IgE<10 IU/ml by 2-tailed, unpaired Student's t-test.
Respiratory Research 2005, 6:149 />Page 7 of 14
(page number not for citation purposes)
Stratification by IgE concentrations
Subject results were stratified by the logarithmically trans-
formed serum IgE levels into <10 (low), 10 to 100 (nor-
mal), and >100 IU/ml (elevated) subsets (table 5).
Clinical asthma had half the prevalence in the low IgE
group compared to the normal and elevated IgE groups (p
= 0.004 by ANOVA). This suggested the presence of non-
atopic asthma. Measures of airways obstruction, polyposis
and peripheral eosinophilia were not significantly differ-
ent between IgE subsets. As expected, the low IgE group
had lower rates of positive allergy skin tests and fewer pos-
itive results per subject. Reactivity was highest in the high
IgE group.
Factor analysis of the entire population
Principal component analysis of the entire population
was performed to determine if a second, independent sta-
tistical method would verify the results of the stratifica-
tion process, and provide additional mechanistic insights.
The initial analysis started with all variables, and could be
forced to a final result of 2 factors: (i) polyposis, and (ii)
positive allergy skin tests. Additional analyses were run to
improve the efficiency and balance by eliminating co-var-
iates (e.g. asthma and pulmonary function test results),
redundant (individual qualitative assessments of reduced
immunoglobulin isotype concentrations), and insignifi-
cant (age, gender and ethnicity) variables. The final anal-
ysis had optimal efficiency and balance between six
factors (table 6).
The factors were consistent with the stratification process.
Factor 1 represented active persistent rhinitis symptoms
with positive allergy skin tests to indoor and year-round
allergens. The rhinitis symptoms plus positive skin tests
supported the diagnosis of allergic rhinitis. Seasonal aller-
gies were represented by Factor 3. These results were con-
sistent with the rate of atopy in this (59%, table 3) and the
control populations (43%).
Factor 2 related large and small airways obstruction with
nasal polyposis. The association of more severe asthma
with polyposis implied an association of milder or no
asthma in the nonpolypoid group. Factor 5 was aspirin
sensitivity which justified the designation of an independ-
ent category of nasal polyposis (NPasa).
Factor 4 of peripheral blood eosinophilia > 4% was inde-
pendent of other variables. This was understandable,
since mechanisms of aspirin sensitivity, polyposis,
asthma, and allergic rhinitis may all cause eosinophilia.
Factor 6 was the qualitative assessment that an individual
had one or more immunoglobulin isotype below the nor-
mal range. More complete, quantitative immunoglobulin
data may have generated stronger relationships given the
frequencies of abnormal results in the nonpolypoid
CRSsNP and OMC subjects (table 2).
Factor analysis of asthma and atopy in each subgroup
Asthma and positive allergy skin test results were impor-
tant defining variables in the preceding factor analysis.
Additional factor analyses were performed for each of the
CRS subgroups to better define potential mechanistic
interactions. Measures of lung function, immunoglobu-
lins and eosinophils were excluded to maintain the focus
on patterns of allergy skin test results.
NPasa
Clinical asthma was present in 15 of 17 NPasa subjects
("Triad Asthma"). This suggested that the nonallergic
mechanism(s) of aspirin sensitivity was highly associated
with the pathology of both the chronic sinusitis and
asthma. These mechanisms could include autonomous
eosinophilia, tissue remodeling by other resident cells,
and glucocorticoid resistance. Factor analysis defined only
one additional significant factor: older age. These defining
features accounted for essentially all of the explained var-
iance within the NPasa group. Atopy was not a defining
factor for NPasa.
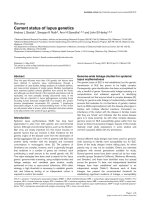
The number of low isotypes was plotted against the propor-tion of each group having these deficienciesFigure 1
The number of low isotypes was plotted against the propor-
tion of each group having these deficiencies. Low isotypes (n
= 7) were identified in 3 CRSsNP and 1 NPother subject.
Fewer nasal polyp subjects had low isotypes compared to the
nonpolypoid pair of groups. This was demonstrated by the
95% confidence intervals at the midpoint of these curves
(bars with error bars at 20%). Polyp and nonpolyp confidence
intervals did not overlap. Most of the subjects had no
humoral immune deficits (zero low isotypes, not depicted).
0
1
2
3
4
5
6
7
0% 10% 20% 30% 40%
Cumulative %
Number of Low Isotypes
NPasa
NPother
CRSsNP
OMC
Respiratory Research 2005, 6:149 />Page 8 of 14
(page number not for citation purposes)
NPother
Factor 1 was defined by positive allergy skin test results to
cat, tree, grass, and ragweed (loading factor = 1.0 for
each). Atopy may have contributed to, or exacerbated,
nasal polyp formation, CRS, and/or asthma in the 23 skin
test positive NPother subjects (n = 32; table 3). Factor 2
suggested an independent mechanism with older age
(0.95), higher CT scan severity grades (0.85), positive skin
tests to weeds (0.88) but negative loadings for dust mites
(-0.88 for each; i.e. not sensitive to dust mites). A nonat-
opic mechanism was suggested by the negative loading
factor for dust mites. The significance of the reactivity to
weeds in this model was questionable since this set of
allergens had the lowest frequency of positive skin tests. It
would be of interest to determine if the nonatopic
NPother subset defined by Factor 2 (9/32 subjects) had
subclinical aspirin sensitivity.
Nonpolypoid subjects
Positive skin test reactivity was evident in the nonpoly-
poid group. Factor 1 contained both of the dust mites.
Factor 2 contained the seasonal pollens. Factor 3 was
defined by cat and fungi. Factors 1 and 3 were compo-
nents of the "persistent" allergen grouping.
CRSsNP
Factor 1 encompassed positive skin tests to fungi and trees
plus the absence of Chronic Fatigue Syndrome (explained
variance = 27%). Factor 2 included weed and grass sensi-
tivity (20%); Factor 3 dust mites (20%); and Factor 4 rag-
weed and cat (19%). The cumulative explained variance
was 86% indicating the strong influence or co-variance of
atopy in the CRSsNP group. The negative loading of
Chronic Fatigue Syndrome was an important finding indi-
cating that atopy, immunoglobulin dysfunction, polypo-
sis and sinusitis (May grades 2, 3 or 4) were unlikely to be
of pathological significance in this syndrome. Instead,
mechanisms such as nociceptive hyperalgesia and allody-
nia were more likely to be responsible for "sinus" com-
plaints in Chronic Fatigue Syndrome.
OMC
The OMC group was similar to CRSsNP. Factor 1 incorpo-
rated weed, tree, cat, and fungal sensitivity (32%). Factor
2 was hypersensitivity to D. farinae, D. pteronyssinus and
ragweed (27%). Factor 3 was distinct since it involved age
(0.95) and FEV
1
/FVC (-0.93) (20%). Factor 3 related older
age to worse airways obstruction.
Discussion
Limitations
This descriptive, observational study was limited by the
amount of information that could be collected in a relia-
ble manner. Surgical, intramaxillary sinus puncture, path-
ological (e.g. presence of allergic mucin), and microbial
culture results were not available on a consistent basis.
Smears, brushings or Rhinoprobe scrapings of the nasal
mucosa, especially directed towards the osteomeatal com-
plex were not routinely performed. Identification of sig-
nificant nasal eosinophilia or neutrophilia would have
added another inflammatory dimension to the analysis.
Subjects with nonallergic rhinitis with eosinophilia syn-
drome (NARES) or with blood eosinophilia (BENARES)
were not identified. Factor analysis demonstrated that
fungal sensitivity and polypoid disease were not associ-
ated in this population. This was consistent with the low
frequencies of clinical allergic fungal sinusitis and positive
allergy skin tests to fungi in this unique set of patients
(table 3).
Pulmonary function, peripheral blood immunoglobulin
and eosinophil information were incomplete for the
entire population. This was overcome by stating the num-
bers of subjects involved in each statistical comparison.
Table 6: Factor analysis for the entire CRS population. The variables that predicted CRS in the most similar fashion were grouped
together as Factors. Factors 1 (persistent dust mite) and 3 (seasonal pollens) implicated allergic rhinitis mechanisms. Factor 2 related
asthma with polyposis. Independent factors were eosinophilia, aspirin sensitivity and low immunoglobulins.
Factors Variables Loading factors Explained variance Eigenvalue
Factor 1 Positive dust mite skin test
Positive skin tests for persistent allergens (dust mites, cat, and fungi)
Clinical diagnosis of allergic rhinitis
0.93
0.91
0.90
29% 3.5
Factor 2 FEV
1
/FVC ratio (continuous range)
FEF
25%–75%
≤ 70% of predicted (score = 1)
Polyposis
-0.93
0.92
0.77
26% 3.2
Factor 3 Positive skin test results to weeds
Positive skin test results to grasses
0.91
0.79
15% 1.6
Factor 4 Blood eosinophils > 4% (qualitative) 0.92 12% 0.9
Factor 5 Aspirin sensitivity 0.90 10% 0.8
Factor 6 Any immunoglobulin < lower limits of normal 0.70 8% 0.6
Respiratory Research 2005, 6:149 />Page 9 of 14
(page number not for citation purposes)
The wide ranges for some of the data required stratifica-
tion, logarithmic transformation, and qualitative analysis
to identify significant trends.
Stratification
The most informative stratification tactic was to divide
CRS subjects into those with and without polyps as sug-
gested by recent consensus statements [3,4]. Polyposis can
be identified by direct visualization, rhinoscopy or at sur-
gery. Polypoid changes may be inferred from CT scans
unless the changes were early or copious mucus secretions
obscured the outlines of polypoid masses. Early polypoid
changes such a middle turbinate (May Grade 1) or eth-
moid disease (May Grade 2) may require medial middle
turbinate biopsy and histological examination for diagno-
sis [8,23,24].
The polypoid subjects were subdivided based on their sen-
sitivity to aspirin and other nonsteroidal anti-inflamma-
tory drugs. The histories of asthma or laryngospasm after
taking one or more of these drugs were convincing. The
pulmonary function tests and review of current medica-
tions confirmed the presence of reversible airflow obstruc-
tion in the NPasa subset. The prevalence of aspirin
sensitivity in adult asthma was recently estimated at 21%
(14% to 29%; 95% CI) [23]. Our results suggest that 17%
of CRS and one third of all nasal polyp subjects have aspi-
rin sensitivity. Nonpolyp subjects did not have aspirin –
induced airway symptoms.
The overall rate of positive allergy skin tests was 59% in
this population. Aspirin sensitivity with asthmatic or
laryngeal symptoms were present in 7/55 skin test positive
and 10/44 skin test negative subjects. Factor analysis dem-
onstrated that aspirin sensitivity was not associated with
any reproducible pattern of skin test responses. Positive
allergy skin tests were present in only one third of the
NPasa group, but in two thirds of the remainder of the
nasal polyp (NPother) group. This suggested that mecha-
nism(s) responsible for polyp formation predominated in
NPasa and NPother, but that atopy modified the expres-
sion of CRS in the allergic NPother subset. We suggest that
subclinical aspirin sensitivity may occur in NPother sub-
jects with negative skin tests, and that aspirin provoca-
tions may be required for diagnosis [25]. The presence of
aspirin sensitivity was not examined in previous studies
that found allergic rhinitis in 84% of endoscopic sinus
surgery patients [26], 54% of CRS outpatients [27], or
37% of children with sinusitis [28].
These findings raise the important question of what con-
stitutes allergic rhinitis in subjects with potential nonat-
opic nasal and sinus disease but positive allergy skin tests.
The presence of "asymptomatic" allergic rhinitis, and sub-
jects with incidentally positive skin tests requires further
investigation [10,29,30]. Allergy skin tests may not be the
optimal method for assessing Type I hypersensitivity and
other immune responses to fungi [31].
In one approach, we have used a Rhinitis Score to assess
symptom severity [32,33]. A predefined threshold defined
a positive Rhinitis Score [11]. When matched with skin
test results in a 2 × 2 table, we defined those with positive
skin tests and Rhinitis Scores as "allergic rhinitis", positive
Rhinitis Scores with negative skin tests as "nonallergic
rhinitis", negative Rhinitis Scores but positive skin tests as
"potential atopy" (asymptomatic allergic rhinitis?), and
negative Rhinitis Scores and skin tests as "non-rhinitis"
subjects. Shortcomings included: (i) the vagaries of retro-
spective symptom reviews; (ii) patient preconceptions of
"allergy" and "sinus" problems; (iii) difficulty in correlat-
ing the timing of symptoms with pollen, dander and mite
allergen triggers; (iv) long-term severity assessments in
seasonal as opposed to perennial allergic or nonallergic
rhinitis; (v) relatively milder symptom scores by younger
subjects even when active allergic rhinitis was present; (vi)
the need for nasal allergen provocation tests to confirm
the diagnosis of allergic rhinitis in borderline allergen
skin test positive or negative subjects [34]; and (vii) and
the absence of an independent, objective indicator of
nasal inflammation such as eosinophilia by nasal scrap-
ings or allergen-specific IgE in nasal secretions.
Allergic disease may be over diagnosed if only a single
positive allergy skin test or radioimmunoadsorbant test
result was used as the threshold criterion. Two positive
skin tests to geographically relevant seasonal or year-
round aeroallergens that correlated with typical allergic
symptoms represented our minimum criteria [11]. The
rate of positive allergy tests in the general population has
been widely reported in studies of the prevalence of atopy
in CRS. These factors make it difficult to infer causality
between the two common, but potentially independent
disorders of atopy and polyposis. This difficulty has been
compounded in clinical studies by lumping all CRS sub-
jects together. The far right column of table 7 illustrates
this effect. These cumulative data obscure the results from
specific individual variables (e.g. aspirin sensitivity) best
discriminate between the phenotypic categories of CRS.
Eosinophilia was a common finding in CRS, but again
was most frequently associated with aspirin sensitive
polyposis (NPasa). Syndromes such as NARES and
BENARES may be precursor states for CRS with nasal poly-
posis [6]. IL-5 is a powerful eosinophilopoeitic factor, and
elevated tissue levels may predict a poor prognosis after
surgery [35]. Release of local eosinophil chemotactic and
survival factors may initiate a self-sustaining eosinophilic
inflammatory state independent of Th2 or other lym-
phocytes [36]. This hypothesis challenges the potential
Respiratory Research 2005, 6:149 />Page 10 of 14
(page number not for citation purposes)
pathological link between eosinophilic allergic rhinitis
and eosinophilic CRS [37,38]. Similarities in the tissue
cytokine profiles between eosinophilic (allergic and not
allergic) and neutrophilic nasal polyps (as in cystic fibro-
sis) raise additional doubts about the role of atopic mech-
anisms in CRS [38,39]. Other CRS classification systems
have reached a similar conclusion. Kountakis et al. pro-
posed that CRS be stratified in a 2 × 2 factorial manner by
the presence or absence of polyps and eosinophilic vs.
noneosinophilic (neutrophilic) histopathology [39]. A
potential confounding factor may be the preoperative use
of oral glucocorticoids to reduce mucosal inflammation
and eosinophilia [40]. However, significant differences
were noted despite this treatment. CRS with eosinophilia,
neuropathy, granulomas, and other findings may suggest
Churg-Straus syndrome, Wegener's granulomatosis, and
other rare systemic disorders [41].
These findings make it clear that strict subject characteri-
zation with data stratification will be imperative for future
investigations into mechanisms of CRS.
This conclusion was reinforced by the discovery that non-
polypoid ("hyperplastic") thickening of the mucosa may
represent glandular hypertrophy [7,8,42,43]. Those with
polypoid changes had destruction of the normal mucosal
architecture even in the early stages before gross polyps
were identified [7,8,24]. This replacement of normal
mucosal glands, nerves, and venous sinusoids by the
expanding "edematous sac" would have definite detri-
mental effects on normal nasal functions such as humidi-
fication, glandular exocytosis of host defense proteins,
and normal nasal airflow. The "hypertrophic", nonpoly-
poid subject group was found to have relatively normal
mucosal structures except for greatly enlarged areas
devoted to submucosal glands. The percent area of Alcian
Blue-staining mucous cells was significantly higher in the
glandular hypertrophy than the polypoid subjects [8].
Additional radiological, histological, and mRNA microar-
ray data support Malekzadeh's hypothesis of polypoid
and glandular hypertrophic forms of CRS [6,7,24,42-47].
Inclusion of these two distinct histopathological subtypes
within a single, monolithic category of CRS may be a
Table 7: Proposed algorithm for the classification of chronic rhinosinusitis. The numbers of subjects in each category and for each
variable were extrapolated to a sample size of 100 based on the current data. The 4 categories were generated from the 3
rd
Decision.
The numbers of projected subjects per category (and % per category) were shown in each column. The far right column gives the sum
for each variable per 100 CRS subjects.
Chronic Rhinosinusitis (CRS; n = 100)
1
st
Decision: Polyps CRS with Nasal Polyps CRS without Nasal Polyps N
Present: N = 50.5 Absent: N = 49.4 50.5
2
nd
Decision: Aspirin sensitivity Nasal Polyps with
Aspirin Sensitivity
(NPasa)
Nasal Polyps with
Other Features
(NPother)
CRS without (s) Nasal
Polyps (CRSsNP)
Osteomeatal
Complex Disease
(OMC)
17.1 (airways) 0 3.6 (urticaria) 4.8 (urticaria) 25.5
3
rd
Decision: Sinus mucosal thickening 17.1 33.3 28.3 21.2 (normal sinuses) 78.7
4
th
Decision:
FEV
1
/FVC<70%
FEF
25%–75%
<70%
12.8 (75%)
15.6 (91%)
13.7 (41%)
18.3 (55%)
5.9 (21%)
8.2 (29%)
3.0 (14%)
9.1 (43%)
35.4
51.2
5
th
Decision:
Peripheral eosinophils >4% Eos. +
asthma:
a. atopic
b. nonatopic
c. Eos/no asthma
11.1 (65%)
3.0 (18%)
8.0 (47%)
0.0 (0%)
13.1 (39%)
6.9 (21%)
3.0 (9%)
3.0 (9%)
9.4 (33%)
5.9 (21%)
2.0 (7%)
1.0 (4%)
4.0 (19%)
0 (0%)
2.0 (9%)
2.0 (9%)
37.6
15.8
15.0
6.0
6
th
Decision:
IgE < 10 IU/ml
Low IgE + low IgG1 or IgG3
4.9 (29%)
2.4 (14%)
5.5 (17%)
1.4 (4%)
12.5 (44%)
9.0 (32%)
9.5 (45%)
2.1 (10%)
32.4
14.9
7
th
Decision:
Positive allergy skin tests
a. seasonal only
b. persistent
c. negative
d. Excess atopy cases per group
7.5 (44%)
1.0 (6%)
6.5 (38%)
9.6 (56%)
-0.3 (-2%)
23.6 (71%)
1.0 (3%)
22.6 (68%)
9.7 (29%)
7.9 (24%)
19.2 (68%)
2.0 (7%)
17.3 (61%)
9.1 (32%)
7.1 (25%)
8.7 (41%)
0 (0%)
8.7 (41%)
12.5 (59%)
-2.0 (-9%)
59.0
4.0
55.1
40.9
12.7
Total per Group 17.1 (100%) 33.3 (100%) 28.3 (100%) 21.2 (100%) 99.9
Respiratory Research 2005, 6:149 />Page 11 of 14
(page number not for citation purposes)
major cause for the controversies surrounding the pathol-
ogy, diagnosis and treatment algorithms developed for
CRS. "Lumping" of all results into a single disease entity
would also explain the difficulty in developing construc-
tive models when limited sets of CRS data were assessed
without stratification [24-26,32,35].
A remarkable finding in the nonpolypoid CRS subjects
was the high frequency of reduced IgE levels (< 10 IU/ml)
and IgG subclass deficiencies. The association of CRS with
humoral deficiencies of IgA, IgG subclasses, and all
immunoglobulins (e.g. common variable hypogamma-
globulinemia, Bruton's agammaglobulinemia) has long
been recognized [20,22,48,49]. Precise mechanisms lead-
ing to these low antibody levels may include dysfunc-
tional antigen presentation, T cell help, B cell heavy chain
switching or other potential mechanisms [50]. Inactiva-
tion of these systems may induce compensatory but inap-
propriate or ineffective immune mechanisms.
Overactivity of inappropriately triggered, poorly regu-
lated, or effusive immune responses may contribute to
some forms of CRS [51]. Distinct patterns of cytokine
mRNAs and cellular protein production in different CRS
phenotypes support this contention [52,53].
The nonpolypoid group was divided into those with sig-
nificant sinus disease by CT scan (May Grades 2, 3 or 4),
and those with mild disease limited to the osteomeatal
complex (OMC, May Grade 1). The CRSsNP group had
higher frequencies of immunoglobulin deficits and posi-
tive allergy skin tests. We propose that this group had a
reduced capacity to sterilize their sinuses due to dysfunc-
tional humoral immune mechanisms, and that they
developed alternative, overcompensating, but inappropri-
ate, chronic immune responses. Multiple mediator path-
ways [54] may have led to a final common pathway of
glandular hypertrophy with mucosal thickening and
increased mucus production. The immune deficits may
have been progressive, since several of these subjects have
progressed to common variable hypogammaglobuline-
mia (reduced levels of all seven isotypes).
OMC may represent a hybrid group that could progress to
polypoid or glandular hypertrophy pathologies, develop
allergic rhinitis alone, or regress. It would be necessary to
perform middle turbinate biopsies with longitudinal fol-
low-up to answer this question of disease progression.
These subjects represent a legitimate category of CRS [55-
60]. However, some of these subjects may have had inci-
dental alterations or false positive CT scans. Incidental
abnormalities including asymptomatic pansinusitis have
been noted in the common cold and up to 32% of sub-
jects having CT or MRI scans to assess headache, orbital,
and intracranial disease [61-64]. Nasal blockage was the
only questionnaire item to be significantly associated with
abnormal scans [65]. "Blockage" has been associated with
persistent allergic rhinitis, while "sneezing and running"
was more typical in intermittent allergic rhinitis where
histaminergic mechanisms may predominate [66]. These
findings illustrate the need to use multiple, rigorously
defined historical, physical examination, questionnaire,
radiological, and other criteria for evaluating CRS.
A final group of subjects have been separately identified
[58]. They have severe, continued nasal, sinus and facial
complaints suggestive of CRS [11], sinus region tender-
ness (regional hyperalgesia) [16], minimal sinus disease
by CT scan (JNB, personal observation), and mucosal
secretory dysfunction [18] despite surgery, antibiotics and
other standard treatments. We have proposed that this
group may be a component of the chronic fatigue syn-
drome spectrum of illnesses. Chronic fatigue syndrome
criteria were met by 26% of this CRS population. This was
much higher than in the general population (estimated
2%) [67]. Factor analysis of the CRSsNP group excluded
chronic fatigue syndrome subjects since they had a nega-
tive loading factor. This provided evidence that this syn-
drome was not related to mucosal hypertrophy, humoral
immunity, or atopy. Instead, these subjects may have dys-
functional spinal dorsal horn and central nervous system
regulation of pain (systemic hyperalgesia), autonomic
instability, limbic, anterior cingulate, amygdala and other
cortical disruptions. [68]. These changes contribute to
defective emotional, memory and executive decision
making processes. Neural dysfunction may augment the
magnitude of sinus region hyperalgesia and allodynia
complaints, parasympathetic reflex-mediated glandular
secretion, and responses to nociceptive nasal provoca-
tions in chronic fatigue syndeom [18]. However, the
pathogenesis and mechanisms of regional and systemic
hyperalgesia in chronic fatigue syndrome were unlikely to
be related to CRS, since CT scan severity scores and pain
symptoms were not correlated in CRS [69]. Rhinitis and
sinusitis complaints in these syndromes likely represent
irritant rhinitis [15] that must be discriminated from aller-
gic and CRS disease.
Diagnostic algorithm
The stratification and factor analyses were used to develop
an algorithm for the evaluation of CRS, and to predict the
provisional distributions of CRS subjects using this classi-
fication scheme (table 7). The order of decisions was
based on the frequency of each variable and their ability
to define subgroups based on potential pathogenic mech-
anisms.
The 1
st
decision regarded polyps. Their presence or
absence divided the CRS group in half.
Respiratory Research 2005, 6:149 />Page 12 of 14
(page number not for citation purposes)
The 2
nd
decision was whether there was a strong history or
evidence from provocation testing of aspirin or other non-
steroidal anti-inflammatory drug sensitivity with airway
obstruction. Positive subjects represented the NPasa cate-
gory. Other causes must have predominated in the
remainder of polyp subjects (i.e. NPother). Angioedema
did not discriminate between groups.
The 3
rd
decision was based on a CT scan that showed sinus
mucosal thickening > 5 mm or more extensive and severe
abnormalities (May Classes 2, 3 and 4). This extent of dis-
ease in the absence of polyps defined the CRSsNP group.
The OMC group (May Class 1) was limited to nasal dis-
ease. These three decisions defined our four major catego-
ries.
The 4
th
decision was based on pulmonary function. The
NPasa group had significantly worse airway function that
the other groups. The qualitative reduction of FEV
1
/FVC
ratio to below 0.70 was the single most significant dis-
criminating variable. Small airways function was present
in 91% of NPasa, and near 50% in the other three groups
(table 2). Independent polypoid and atopic mechanisms
may contribute to the links between CRS and asthma in
the 4 categories.
The 5
th
decision was to determine if the peripheral blood
eosinophil count was > 4%. Other thresholds such as
absolute cell counts may be more sensitive, but were not
examined here. Eosinophilia was associated with asthma
and negative skin tests in 47% of the NPasa group. By con-
trast, 21% of the NPother and CRSsNP groups had eosi-
nophilia and asthma with positive skin tests (atopic
asthma). Tissue eosinophilia may have been an even
more discriminating marker [39].
The 6
th
decision was immune status. IgE was < 10 IU/ml
in 44% of the nonpolypoid CRS subgroup, compared to
21% when polyps were present (p = 0.015 by Fisher's
Exact test). The small number of subjects per group meant
that statistical significance was lost when each CRS group
was compared. Groups of at least 30 subjects each should
facilitate investigation of this finding. The combination of
low IgE plus either low IgG1 or IgG3 was more prevalent
in the CRSsNP group.
The 7
th
decision was based on skin test reactivity (table 3
and factor analysis). Positive skin tests to the persistent
allergens (dust mites, cat, and fungi) dominated with only
4% of CRS subjects having solely seasonal patterns (trees,
grasses, weeds). Based on the extrapolations of table 7, the
allergic contingents within the NPother and CRSsNP cate-
gories accounted for 43% of the CRS population, and con-
tributed 12.7 excess cases of atopy per 100 subjects
compared to the normal reference population. The major-
ity were sensitized to dust mites.
The low rating for this 7
th
decision should be cautionary.
The NPother and CRSsNP groups were almost identical in
their patterns of allergic sensitization. However, these
similarities do not explain why half develop polyps, while
the other half do not. It may be that the mucosal microen-
vironment promotes Th2 reactivity and atopic sensitiza-
tion to persistent allergens. However, other
environmental, genetic, and molecular influences that
remain to be discovered may force the inflammatory cas-
cade to diverge into the mutually exclusive polypoid and
glandular hypertrophy histological subtypes of CRS [7,8].
The perplexing prevalence of low IgE in the otherwise
highly allergic CRSsNP group was distinctly different from
the NPother group. It suggests that immune dysregulation
may contribute to CRSsNP pathophysiology.
Conclusion
This retrospective analysis provides justification for the
consensus division of CRS into groups with and without
nasal polyps. Information about aspirin sensitivity, clini-
cal asthma, airflow obstruction, the extent of the sinusitis
disease process, immunoglobulin isotype deficiencies,
and allergy skin test results provided logical criteria for the
subdivision of these two groups. Polyposis subjects were
subdivided based on the presence (NPasa) or absence of
historical aspirin sensitivity (NPother). NPother subjects
were further subdivided by factor analysis into subsets
with (2/3) and without (1/3) allergy. The non-polypoid
subjects were divided based on CT scan severity. The
CRSsNP group had sinus mucosal thickening (May Class
2, 3, or 4), reduced immunoglobulin levels, and allergy.
Those with disease limited to the nasal osteomeatal com-
plex for the last group (OMC). Immunoglobulin deficien-
cies and atopy were present to some extent in all these
groups, but were most significantly associated with non-
polypoid disease. These distinctions also have relevance
to asthma studies, where atopic (n = 500/700) and nonat-
opic (n = 200/700) asthmatics can be clinically distin-
guished [70]. The current results provide a logical
framework for stratification of CRS subjects for future
studies of disease diagnosis, treatment and pathogenic
mechanisms.
Abbreviations
CRS, chronic rhinosinusitis; NPasa, nasal polyps with
aspirin sensitivity; NPother, polypoid CRS in the absence
of aspirin sensitivity; CRSsNP, nonpolypoid CRS with
sinus mucosal involvement by CT scan ("s"=without);
OMC, nonpolypoid CRS with osteomeatal complex nar-
rowing on CT scan; NARES, nonallergic rhinitis with eosi-
nophilia syndrome; BENARES, blood eosinophilia with
NARES.
Respiratory Research 2005, 6:149 />Page 13 of 14
(page number not for citation purposes)
Competing interests
The author(s) declare that they have no competing inter-
ests.
Authors' contributions
JNB conducted the clinical project. HM supervised the
confidential and anonymous entry of data, and its statisti-
cal review. The manuscript was written jointly by the two
authors.
Acknowledgements
United States Public Health Service Awards RO1 AI42403, 1 M01-
RR13297-01A1 from the General Clinical Research Center Program of the
National Center for Research Resources, National Institutes of Health, and
P50 DC006760-01A1 from the Monell Chemical Senses Center. The
authors made all decisions about preparation and submission of this manu-
script.
References
1. Kaliner MA, Osguthorpe JD, Fireman P, Anon J, Georgitis J, Davis ML,
Naclerio R, Kennedy D: Sinusitis: bench to bedside. Current
findings, future directions. Otolaryngol Head Neck Surg 1997,
116:S1-20.
2. Kaliner MA, Osguthorpe JD, Fireman P, Anon J, Georgitis J, Davis ML,
Naclerio R, Kennedy D: Sinusitis: bench to bedside. Current
findings, future directions. J Allergy Clin Immunol 1997,
99:S829-48.
3. Meltzer EO, Hamilos DL, Hadley JA, Lanza DC, Marple BF, Nicklas
RA, Bachert C, Baraniuk J, Baroody FM, Benninger MS, Brook I,
Chowdhury BA, Druce HM, Durham S, Ferguson B, Gwaltney JM,
Kaliner M, Kennedy DW, Lund V, Naclerio R, Pawankar R, Piccirillo
JF, Rohane P, Simon R, Slavin RG, Togias A, Wald ER, Zinreich SJ: Rhi-
nosinusitis: Establishing definitions for clinical research and
patient care. J Allergy Clin Immunol 2004:S156-S212.
4. Meltzer EO, Hamilos DL, Hadley JA, Lanza DC, Marple BF, Nicklas
RA: Rhinosinusitis: Establishing definitions for clinical
research and patient care. Otolaryngol Head Neck Surg 2004,
131:S1-S62.
5. Staevska M, Baraniuk JN: Perennial nonallergic rhinitis. Curr
Allergy Asthma Rep 2005, 5:233-242.
6. Ferguson BJ: Categorization of eosinophilic chronic rhinosi-
nusitis. Curr Opin Otolaryngol Head Neck Surg 2004, 12:237-242.
7. Malekzadeh S, McGuire JF: The new histologic classification of
chronic rhinosinusitis. Curr Allergy Asthma Rep 2003, 3(3):221-226.
8. Malekzadeh S, Hamburger MD, Whelan PJ, Biedlingmaier JF, Baraniuk
JN: Density of middle turbinate subepithelial mucous glands
in patients with chronic rhinosinusitis. Otolaryngol Head Neck
Surg 2002, 127:190-195.
9. White K, Baraniuk JN: Chronic sinusitis subtypes and airway
function. J Allergy Clin Imunol 2004, 113:S203.
10. Baraniuk JN, Naranch K, Ali M, Le U: Pathophysiology of rhinosi-
nusitis: Baseline symptoms and secretions in acute sinusitis
(S), allergic rhinitis (AR), the nonallergic rhinitis of Chronic
Fatigue Syndrome (CFS) and normal subjects. Am J Respir Crit
Care Med 2004, 169:A820.
11. Baraniuk JN, Clauw JD, Gaumond E: Rhinitis symptoms in chronic
fatigue syndrome. Ann Allergy Asthma Immunol 1998, 81:359-365.
12. Lierl MB: Allergy of the upper respiratory tract. Manual of
Allergy and Immunology Boston 1995:94-111.
13. Baraniuk JN, Clauw DJ, MacDowell-Carneiro A-L, Bellanti J, Pandiri P,
Foong S, Ali M: Serum IgE concentrations in chronic fatigue
syndrome. J CFS 1998, 4:13-21.
14. Repka-Ramirez MS, Naranch K, Park Y-J, Velarde A, Clauw D, Bara-
niuk JN: IgE levels are the same in Chronic Fatigue Syndrome
(CFS) and control subjects when stratified by allergy skin
test results and rhinitis types. Ann Allergy Asthma Immunol 2001,
87:218-221.
15. Baraniuk JN, Naranch K, Maibach H, Clauw D: Irritant rhinitis in
allergic, nonallergic, control and Chronic Fatigue Syndrome
populations. J CFS 2000, 7:3-31.
16. Naranch K, Park Y-J, Repka-Ramirez SM, Velarde A, Clauw D, Bara-
niuk JN: A tender sinus does not always mean sinusitis.
Otolaryngol Head Neck Surg 2002, 127:387-397.
17. Repka-Ramirez MS, Naranch K, Park Y-J, Clauw D, Baraniuk JN:
Cytokines in nasal lavage fluids from acute sinusitis, allergic
rhinitis, and Chronic Fatigue Syndrome subjects. Allergy
Asthma Proc 2002, 23:185-190.
18. Baraniuk JN, Petrie KN, Le U, Tai C-F, Park Y-J, Yuta A, Ali M,
VandenBussche CJ, Nelson B: Neuropathology in rhinosinusitis.
Am J Respir Crit Care Med 2005, 171:5-11.
19. Smith JK, Krishnaswamy GH, Dykes R, Reynolds S, Berk SL: Clinical
manifestations of IgE hypogammaglobulinemia. Ann Allergy
Asthma Immunol 1997, 78:313-318.
20. May M, Levine HL, Schaitkin B: Results of surgery. In Rhinology and
Sinusology Edited by: Levine H, May M. Thieme Medical Publishing.
New York; 1993:105-125.
21. Chee L, Graham SM, Carothers DG, Ballas ZK: Immune dysfunc-
tion in refractory sinusitis in a tertiary care setting. Laryngo-
scope 2001, 111:233-235.
22. Luethviksson BR, Arason GJ, Thorarensen O, Ardal B, Valdimarsson
H: Allergic diseases and asthma in relation to serum immu-
noglobulins and salivary immunoglobulin A in pre-school
children: a follow-up community-based study. Clin Exp Allergy
2005, 35:64-69.
23. Biedlingmaier JF, Trifillis A: Comparison of CT scan and electron
microscopic findings on endoscopically harvested middle
turbinates. Otolaryngol Head Neck Surg 1998, 118:165-73.
24. Bachert C, Gevaert P, van Cauwenberge P: Nasal polyposis – a
new concept on the formation of polyps. ACI International 1999,
11:130-135.
25. Jenkins C, Costello J, Hodge L: Systematic review of prevalence
of aspirin induced asthma and its implications for clinical
practice. BMJ 2004, 328:434.
26. Emanuel IA, Shah SB: Chronic rhinosinusitis: Allergy and sinus
computed tomography relationships. Otolaryngol Head Neck
Surg 2000, 123:687-691.
27. Benninger MS: Rhinitis, sinusitis, and their relationships to
allergies. Am J Rhinol 1992, 6:37-43.
28. Rachelefsky GS: Chronic sinusitis. The disease of all ages. Am J
Dis Child 1989, 143:886-888.
29. Krouse JH, Shah AG, Kerswill K: Skin testing in predicting
response to nasal provocation with alternaria. Laryngoscope
2004, 114:1389-1393.
30. von Bubnoff D, Fimmers R, Bogdanow M, Matz H, Koch S, Bieber T:
Asymptomatic atopy is associated with increased indoleam-
ine 2,3-dioxygenase activity and interleukin-10 production
during seasonal allergen exposure. Clin Exp Allergy 2004,
34:1056-1063.
31. von Bubnoff D, Scheler M, Hinz T, Matz H, Koch S, Bieber T: Com-
parative immunophenotyping of monocytes from sympto-
matic and asymptomatic atopic individuals. Allergy 2004,
59:933-939.
32. Wasserfallen JB, Gold K, Schulman KA, Milzman D, Baraniuk JN:
Development and validation of a rhinoconjunctivitis and
asthma symptom score for use as an outcome measure in
clinical trials. J Allergy Clin Immunol 1997, 100:16-22.
33. Wasserfallen JB, Gold K, Schulman KA, Baraniuk JN: Item respon-
siveness of a rhinitis and asthma symptoms score during a
pollen season. J Asthma 1999, 36:459-465.
34. Litvyakova L, Baraniuk JN: Human nasal allergen provocation
for determination of true allergic rhinitis: methods for clini-
cians. Curr Allergy Asthma Rep 2002, 2:194-202.
35. Lavigne F, Nguyen CT, Cameron L, Hamid Q, Renzi PM: Prognosis
and prediction of response to surgery in allergic patients
with chronic sinusitis. J Allergy Clin Immunol 2000, 105:746-751.
36. Di Lorenzo G, Drago A, Pellitteri ME: Measurement of inflamma-
tory mediators of mast cells and eosinophils in native nasal
lavage fluid in nasal polyposis. Int Arch Allergy Immunol 2001,
125:164-175.
37. Voegels RL, Santoro P, Butugan O, Formigoni LG: Nasal polyposis
and allergy: Is there a correlation? Am J Rhinol 2001, 15:9-14.
38. Rudack C, Sachse F, Alberty J: Chronic rhinosinusitis – need for
further classification? Inflamm Res 2004, 53:111-117.
39. Kountakis SE, Arango P, Bradley D, Wade ZK, Borish L: Molecular
and cellular staging for the severity of chronic rhinosinusitis.
Laryngoscope 2004, 114:1895-1905.
Publish with BioMed Central and every
scientist can read your work free of charge
"BioMed Central will be the most significant development for
disseminating the results of biomedical research in our lifetime."
Sir Paul Nurse, Cancer Research UK
Your research papers will be:
available free of charge to the entire biomedical community
peer reviewed and published immediately upon acceptance
cited in PubMed and archived on PubMed Central
yours — you keep the copyright
Submit your manuscript here:
/>BioMedcentral
Respiratory Research 2005, 6:149 />Page 14 of 14
(page number not for citation purposes)
40. Benson M: Pathophysiological effects of glucocorticoids on
nasal polyps: an update. Curr Opin Allergy Cln Immunol 2005,
5:31-35.
41. Alobid I, Guilemany JM, Mullol J: Nasal manifestations of sys-
temic illnesses. Curr Allergy Asthma Rep 2004, 4:208-216.
42. Malekzadeh S, Hamburger M, Biedlingmaier JF, Baraniuk JN: Density
of middle turbinate subepithelial mucous glands in patients
with chronic sinusitis and polyposis. Otolaryngology Society, South-
ern meeting 1997. proceedings
43. Malekzadeh S, Hamburger M, Biedlingmaier JF, Trifillis A, Baraniuk JN:
Epithelial and glandular metaplasia in the middle turbinates
of chronic sinusitis patients correlate with CT scan severity
(May classification). J Allergy Clin Immunol 1998, 101:S250.
44. Berger G, Kattan A, Bernheim J, Ophir D: Polypoid mucosa with
eosinophilia and glandular hyperplasia in chronic sinusitis: A
histopathological and immunohistochemical study. Laryngo-
scope 2002, 112:738-745.
45. Cousin JN, Har-El G, Li J: Is there a correlation between radio-
graphic and histologic findings in chronic sinusitis? J Otolaryn-
gol 2000, 29:170-173.
46. Eichel BS: A proposal for a staging system for hyperplastic rhi-
nosinusitis based on the presence or absence of intranasal
polyposis. Ear Nose Throat J 1999, 78:262-8.
47. Lui Z, Kim J, Sypek JP, Wang IM, Horton H, Oppenheim FG, Bochner
BS: Gene expression profiles in human nasal polyp tissues
studied by means of DNA microarray. J Allergy Clin Immunol
2004, 114:783-790.
48. Karlsson G, Brandtzaeg P, Hansson G, Petruson B, Bjorkander J, Han-
son LA: Humoral immunity in nasal mucosa of patients with
common variable immunodeficiency. J Clin Immunol 1987,
7:29-36.
49. May A, Zielen S, von Ilberg C, Weber A: Immunoglobulin defi-
ciency and determination of pneumococcal antibody titers in
patients with therapy-refractory recurrent rhinosinusitis.
Eur Arch Otorhinolaryngol 1999, 256:445-449.
50. Cooper MD, Lanier LL, Conley ME, Puck JM: Immunodeficiency
disorders. Hematology (Am Soc Hematol Educ Program)
2003:314-330.
51. Bachert C, Gevaert P, van Cauwenberge P: Staphylococcus aureus
superantigens and airway disease. Curr Allergy Asthma Rep 2002,
2:252-258.
52. Watelet JB, Claeys C, Perez-Novo C, Gevaert P, Van Cauwenberge
P, Bachert C: Transforming growth factor beta1 in nasal
remodeling: differences between chronic rhinosinusitis and
nasal polyposis. Am J Rhinol 2004, 18:267-272.
53. Hamilos DL, Leung DYM, Wood R, Cunningham L, Bean DK, Yasruel
Z, Hamid Q: Evidence for distinct cytokine expression in aller-
gic versus nonallergic chronic sinusitis. J Allergy Clin Immunol
1995, 96:537-44.
54. Fageras Bottcher M, Hmani-Aifa M, Lindstrom A, Jenmalm MC, Mai
XM, Nilsson L, Zdolsek HA, Bjorksten B, Soderkvist P, Vaarala O: A
TLR4 polymorphism is associated with asthma and reduced
lipopolysaccharide-induced interleukin-12(p70) responses in
Swedish children. J Allergy Clin Immunol 2004, 114:561-567.
55. Stewart MG, Donovan DT, Parke RB Jr, Bautista MH: Does the
severity of sinus computed tomography findings predict out-
come in chronic sinusitis? Otolaryngol Head Neck Surg 2000,
123:81-84.
56. Bhattacharyya T, Piccirillo J, Wippold FJ: Relationship between
patient-based descriptions of sinusitis and paranasal sinus
CT. Arch Otolaryngol Head Neck Surg 1997, 123:1189-1192.
57. Steward MG, Sicard MW, Piccirillo JF, Diaz-Marchan PJ: Severity
staging in chronic sinusitis: are CT scan findings related to
patient symptoms? Am J Rhinol 1999, 13:161-167.
58. Acquardo MA, Montgomery WW: Treatment of chronic parana-
sal sinus pain with minimal sinus CT changes. Ann Otol Rhinol
Laryngol 1996, 105:607-614.
59. Tarabichi M: Characteristics of sinus-related pain. Otolaryngol
Head Neck Surg 2000, 122:842-847.
60. West B, Jones NS: Endoscopy-negative, computed tomogra-
phy-negative facial pain in a nasal clinic. Laryngoscope 2001,
111:581-586.
61. Patel K, Chavda SV, Violaris N, Pahor AL: Incidental paranasal
sinus inflammatory changes in the a British population. J
Laryngol Otol 1996, 110:649-651.
62. Maly PV, Sundgren PC: Changes in paranasal sinus abnormali-
ties found incidentally on MRI. Neuroradiology 1995, 37:471-474.
63. Gordts F, Clement PA, Buisseret T: Prevalences of sinusitis signs
in a non-ENT population. ORL J Otorhinolaryngol Relat Spec 1996,
58:315-319.
64. Jones NS, Strobl A, Holland I: A study of the CT findings in 100
patients with rhinosinusitis and 100 controls. Clin Otolaryngol
1997, 22:47-51.
65. Tarp B, Fiirgaard B, Christensen T, Jensen JJ, Black FT: The preva-
lence and significance of incidental paranasal sinus abnor-
malities on MRI. Rhinology 2000, 38:33-38.
66. Khanna P, Shah A: Categorization of patients with allergic rhin-
itis: a comparative profile of "sneezers and runners" and
"blockers". Ann Allergy Asthma Immunol 2005, 94:60-64.
67. Reyes M, Gary HE Jr, Dobbins JG, Randall B, Steele L, Fukuda K, Hol-
mes GP, Connell DG, Mawle AC, Schmid DS, Stewart JA, Schon-
berger LB, Gunn WJ, Reeves WC: Descriptive epidemiology of
chronic fatigue syndrome: CDC surveillance in four cities.
Morbidity Mortality Weekly Report Surveillance Summaries 1997, 46:1-13.
68. Clauw DJ, Engel CC Jr, Aronowitz R, Jones E, Kipen HM, Kroenke K,
Ratzan S, Sharpe M, Wessely S: Unexplained symptoms after ter-
rorism and war: an expert consensus statement. J Occup Envi-
ron Med 2003, 45:1040-1048.
69. Shields G, Seikaly H, LeBoeuf M, Guinto F, LeBoeuf H, Pincus T, Cal-
houn K: Correlation between facial pain or headache and
computed tomography in rhinosinusitis in Canadian and U.S.
subjects. Laryngoscope 2003, 113:943-945.
70. Nieves A, Magnan A, Boniface S, Proudhon H, Lanteaume A, Romanet
S, Vervloet D, Godard P, ARIA: Phenotypes of asthma revisited
upon the presence of atopy. Respir Med 2005, 99:347-354.