Báo cáo y học: "Assessment of tissue oxygen tension: comparison of dynamic fluorescence quenching and polarographic electrode technique" potx
Bạn đang xem bản rút gọn của tài liệu. Xem và tải ngay bản đầy đủ của tài liệu tại đây (243.43 KB, 5 trang )
Critical Care February 2001 Vol 6 No 1 Shaw et al.
Research article
Assessment of tissue oxygen tension: comparison of dynamic
fluorescence quenching and polarographic electrode technique
Andrew D Shaw*, Zheng Li*, Zach Thomas* and Craig W Stevens
†
*Department of Critical Care Medicine, The University of Texas M.D. Anderson Cancer Center, Houston, Texas, USA
†
Department of Radiation Oncology, The University of Texas M.D. Anderson Cancer Center, Houston, Texas, USA
Correspondence: Dr Andrew Shaw FRCA,
Introduction
Accurate measurement of PO
2
in biologic tissues has been of
interest to both researchers and clinicians for many years [1].
For basic scientists measurement of P
O
2
provides insight into
the complexities of oxygen flux at the tissue level, whereas for
clinicians it moves the monitoring window a step closer to the
cell. P
O
2
monitoring has been exploited most effectively by
radiation oncologists, who have used intratumoral P
O
2
mea-
surements to plan and guide radiotherapy [2]. Many articles
in the anesthesia and critical care literature report the applica-
tion of different technologies designed to measure tissue P
O
2
[1,3–14], but the clinical use of PO
2
measurement has largely
been limited to assessment of brain tissue [15,16].
Existing technologies for measuring tissue P
O
2
are either too
expensive for everyday clinical use [14] or are based on
polarographic principles [17], meaning that oxygen is con-
sumed in the measurement process. In time this oxygen con-
sumption affects the signal itself, and this effect persists as
tissue P
O
2
decreases, perhaps making polarographic devices
less suitable for detection of tissue hypoxia. We hypothesized
that a P
O
2
measurement technique based on dynamic fluo-
rescence quenching would provide a way to overcome the
limitations of the current polarographic technique. We report
here a head-to-head bench comparison of P
O
2
measurement
using polarography versus measurement using dynamic fluo-
rescence quenching. We also present preliminary data from
an animal model of tissue ischemia and hypoxia that provide
FiO
2
=fractional inspired oxygen; PO
2
=partial oxygen tension.
Abstract
Introduction and methods Dynamic fluorescence quenching is a technique that may overcome some
of the limitations associated with measurement of tissue partial oxygen tension (P
O
2
). We compared
this technique with a polarographic Eppendorf needle electrode method using a saline tonometer in
which the P
O
2
could be controlled. We also tested the fluorescence quenching system in a rodent
model of skeletal muscle ischemia–hypoxia.
Results Both systems measured P
O
2
accurately in the tonometer, and there was excellent correlation
between them (r
2
= 0.99). The polarographic system exhibited proportional bias that was not evident
with the fluorescence method. In vivo, the fluorescence quenching technique provided a readily
recordable signal that varied as expected.
Discussion Measurement of tissue P
O
2
using fluorescence quenching is at least as accurate as
measurement using the Eppendorf needle electrode in vitro, and may prove useful in vivo for
assessment of tissue oxygenation.
Keywords clinical measurement methodology, fiberoptic measurement, fluorescence quenching, ischemia,
Stern–Volmer, tissue oxygenation
Received: 25 October 2001
Accepted: 11 December 2001
Published: 10 January 2002
Critical Care 2002, 6:76-80
© 2002 Shaw et al., licensee BioMed Central Ltd
(Print ISSN 1364-8535; Online ISSN 1466-609X)
Available online />evidence of a potentially useful application of fluorescence
quenching as a monitor of tissue integrity.
Methods
Tonometry apparatus
We constructed an equilibration tonometer (from a sealed,
inverted 50-ml syringe part filled with 0.9% saline and a
length of tubing ending in a diffusing stone) and immersed it
in a water bath maintained at a constant temperature (37°C).
We then connected the tubing to a low pressure oxygen/
nitrogen gas mixer, such that gas bubbled through the stone
and saline solution. A loose cover maintained the gas mixture
above the saline but was not so tight as to cause the pres-
sure to rise above atmospheric pressure. In an earlier experi-
ment we determined that the P
O
2
in the saline solution
equilibrated within 90 s (unpublished observations). An
oxygen fluorescence quenching probe (FOXY; Ocean Optics
Inc., Dunedin, FL, USA), electronic thermometer, and polaro-
graphic (Eppendorf Instruments, Hamburg, Germany) needle
electrode were inserted through the tonometer cover. The
oxygen concentration of the inflow gas was measured in-line
with a conventional fuel cell oxygen analyzer and this was
used to calculate a predicted P
O
2
(PO
2 pred
) in the saline
according to the following equation:
P
O
2 pred
= FiO
2
× (PB – PH
2
O) (1)
Where Fi
O
2
is the oxygen concentration in the inflow gas, PB
is the atmospheric pressure recorded in the laboratory on the
day of the experiment, and P
H
2
O
is the water vapor pressure.
Dynamic fluorescence quenching optode
The optode consists of a 200-µm aluminum-coated, ruthenium-
tipped glass fiber with a medical-grade silicone covering on the
tip. The response time of the device is about 45 s in a liquid
medium. The light source is a dedicated light-emitting diode
that emits pure blue light at a wavelength of 470 nm. When
excited the ruthenium emits light (fluoresces) with peak inten-
sity at 600 nm that is quenched by the presence of oxygen. The
fluorescence signal is then converted to a P
O
2
value by special-
ized software (OOISENSORS; Ocean Optics Inc.).
Polarographic needle electrode
This system has been described in detail elsewhere [18].
Briefly, it comprises a needle electrode mounted on a step-
ping motor that sequentially advances and then retracts the
needle tip. This allows the system to create a histogram of
P
O
2
recordings from the tissue of interest. The current pro-
duced by the needle electrode is linearly related to the P
O
2
value in the medium surrounding the electrode tip.
Bench comparison experiment
Calibration
For the fluorescence quenching system we used a 1%
weight/volume solution of sodium sulfite as zero P
O
2
for the
low calibration standard. This chemical does not affect the
optical sensing system. Sterile water in equilibration with lab-
oratory air was used as a high calibration standard, using
equation 1 with Fi
O
2
set to 0.21. Although it is theoretically
reasonable to calibrate the sensor in one medium (e.g.
gaseous) and then measure P
O
2
in another (e.g. liquid), we
have no experimental data to support this.
The needle electrode was calibrated according to the manu-
facturer’s instructions [19]. As described above, our labora-
tory bench tonometer was kept at a constant temperature of
37 ± 1°C. It was thus not necessary to correct for tempera-
ture in this experiment.
Measurement protocol
Once both measurement systems had been calibrated and
inserted into the saline tonometer, the system was allowed to
come to equilibrium for 5 min. We then varied the concentra-
tion of oxygen in the inflow gas so that the P
O
2
in the saline
would rise or fall. After each change, we waited 3 min for the
system to equilibrate before recording the P
O
2
value from
each device and the P
O
2 pred
value from the inflow gas. We
repeated these steps to record 58 consecutive data triplets.
Finally, we re-measured the low and high calibration solutions
to assess drift in P
O
2
values across the duration of the experi-
ment.
In vivo
application
Animal model
The experimental protocol was approved by The University of
Texas M.D. Anderson Cancer Center Animal Care and Use
Committee. Male outbred Sprague–Dawley rats (n =3)
weighing 410–440 g were anesthetized using inhaled isoflu-
rane in a mixture of 35% oxygen and 65% nitrogen. Each
animal was placed on a homeothermic blanket (Harvard
Apparatus Inc., Holliston, MA, USA); the trachea was then
intubated (using a modified neonatal laryngoscope and 14-
gauge cannula) and the lungs were mechanically ventilated. A
small midline laparotomy was performed to allow for place-
ment of a vascular clip on the infrarenal aorta. Cannulae (PE
20; Harvard Apparatus Inc.) were placed in the left femoral
artery and vein to allow measurement of arterial pressure
(MLT-1050 transducer; AD Instruments, Mountain View, CA,
USA) and administration of 1 ml/100 g per h 0.9% saline.
Neuromuscular blockade was achieved using 0.2 mg/kg pan-
curonium bromide by intravenous bolus, supplemented later
as needed. Finally, the dynamic fluorescence quenching
optode was attached to a micromanipulator and inserted (via
a 19-gauge needle) percutaneously into the right hind limb
skeletal muscle bed.
Experimental protocol
Once surgery was complete, the animal was allowed to
recover for 20 min before the experiment began. Following an
initial baseline period of 5 min the aorta was cross-clamped
for 30 min, after which the vascular clip was removed. After a
20-min period of reperfusion, the animal was ventilated with
Critical Care February 2001 Vol 6 No 1 Shaw et al.
100% nitrogen for 90 s and then the Fi
O
2
was returned to
0.35. After a further period of ventilation, the animal was killed
by isoflurane overdose and exsanguination via the arterial line.
Data analysis
To identify relationships between the two measurement tech-
niques and P
O
2 pred
, we calculated product–moment correla-
tion statistics. To investigate differences between the two
systems and P
O
2 pred
, we constructed Bland–Altman plots
[20]. For the animal data we performed one-way analysis of
variance with Newman–Keuls post-testing to detect differ-
ences within groups. Analyses were performed in Excel 2000
(Microsoft Inc., Redmond, WA, USA) using the Analyse-It sta-
tistical add-in (Analyse-It Software Ltd, Leeds, UK) and
GraphPad Prism 3.02 (GraphPad Software Inc., San Diego,
CA, USA).
Results
Bench comparison data
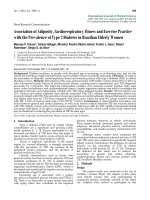
Fig. 1A shows the changes in P
O
2 pred
, fluorescence quench-
ing P
O
2
, and polarographic P
O
2
values plotted against time.
There was remarkable agreement between the data gener-
ated by the quenching technique and that generated by the
polarographic technique (r
2
= 0.99, P < 0.0001; Fig. 1B), but
this analysis hides a difference that only becomes apparent
on consideration of the Bland–Altman plot of the two mea-
surement techniques (Fig. 1C). Bias proportional to the mag-
nitude of the signal was clearly evident, but it remained
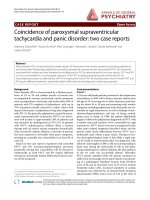
unclear which device was responsible for it. Plots of both
techniques compared with P
O
2 pred
revealed an apparent pro-
portional bias in the polarographic data but not in the quench-
ing data (Figs 2A and 2B). As suggested by Bland and
Altman [20], log transformation (Fig. 2C) shows correction of
the bias in the polarographic plot, suggesting that the error
arose from the polarographic dataset. The fluorescence
quenching system showed minimal drift across the course of
the experiment (low points were 0.0 and 0.08 kPa and high
points were 20.2 and 20.9 kPa at the start and finish, respec-
tively). The polarographic system required recalibrating after
approximately 30 data sets, so we were unable to measure
the drift of the device.
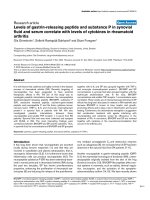
In vivo
data
A plot of tissue P
O
2
against time is depicted in Fig. 3A. The
baseline value of 11.2 kPa reflects the baseline Fi
O
2
of 0.35
and is higher than resting values in similar in vivo studies that
used 0.21 as their baseline Fi
O
2
[21]. This is an important
concept because arterial P
O
2
has a profound and incompletely
understood effect on tissue P
O
2
. The tissue PO
2
fell very
quickly after the aorta was cross-clamped, and it began to rise
again when tissue perfusion was re-established. Soon after the
animals breathed 100% nitrogen, the tissue P
O
2
fell sharply
and rose again when oxygen was reintroduced into the inspired
gas mixture. Fig. 3B shows the data presented by intervention.
For this graph, the mean values of the last three data points
before a change were taken to reflect that intervention.
Discussion
There is increasing interest in the use of tissue PO
2
as a
monitor of critical illness [15,16,22–24]. The most favorable
tissue in which to record this variable has yet to be deter-
mined, and candidates include the gut [25], subdermis [26],
skeletal muscle [27], wound margins [11], brain [15], and
bladder mucosa [28]. We demonstrated that dynamic fluo-
rescence quenching is at least as accurate as the polaro-
graphic system for measuring P
O
2
.
The optical device used in this experiment measures P
O
2
using the principle of dynamic fluorescence quenching. As a
triplet molecule, oxygen is able to quench efficiently the phos-
phorescence and fluorescence of certain luminophores, and
it is this concept that underlies the principle used by optical
systems such as ours to measure P
O
2
. When an oxygen mol-
ecule collides with a fluorophore in its excited state, there is a
non-radiative transfer of energy that leads to a reduction in
the fluorescence displayed by the fluorophore. The P
O
2
value
in the medium that contains the fluorophore is inversely pro-
portional to the intensity of fluorescence exhibited. This rela-
tionship is described by the Stern–Volmer equation:
Figure 1
(A) Plot of fluorescence, polarographic and predicted partial oxygen
tension (PO
2
) against time. (B) Correlation plot of polarographic and
fluorescence measurement techniques. (C) Bland–Altman plot of
polarographic and fluorescence techniques demonstrating proportional
bias arising from one (or both) of the techniques.
I
0
/I = 1 + k·PO
2
(2)
where I
0
is the fluorescence intensity recorded at zero oxygen
tension, I is the intensity at oxygen tension P, and k is the
Stern–Volmer constant. According to this equation, the rela-
tionship between P
O
2
and signal intensity is linear, but this
assumption is only valid for lower values of P
O
2
(below
approximately 20 kPa). For partial pressures greater than
20 kPa, it is necessary to employ a second-order polynomial
algorithm:
I
0
/I = 1 + k
1
(PO
2
) + k
2
(PO
2
)
2
(3)
where I
0
is the fluorescence intensity recorded at zero oxygen
tension, I is the intensity at oxygen tension P, k
1
is the first
coefficient and k
2
is the second coefficient. Sinaasappel and
lnce [29] pointed out that oxygen is 10% less soluble in
serum than in water [30], and thus recommended the use of
concentration rather than tension as a unit of measurement
for in vivo work. The solubility of oxygen in interstitial fluid (in
the tissue milieu) is not known, and it is uncertain whether it
differs from that of oxygen in water or serum. Even if it does, it
is improbable that the solubility would differ from one type of
tissue to the next because that would require a difference in
the composition of the extracellular fluid, which is unlikely.
Thus, the effect of any unmeasured differences in oxygen sol-
ubility would be (at most) to introduce a small systematic bias
into the data. The intensity of the fluorescence signal
increases as the P
O
2
decreases, and this is reflected by the
increasing accuracy of optical systems at low P
O
2
levels. This
feature of dynamic fluorescence quenching, coupled with the
fact that it does not consume oxygen in the measurement
process, makes it attractive for the detection and monitoring
of hypoxia.
According to the manufacturer, the accuracy of the fluores-
cence quenching technique is affected by the calibration pro-
cedure, the resolution (random noise), and deviations from
the Stern–Volmer relationship, which occur primarily at higher
P
O
2
values. It is reasonable to assume that this technique
would work in vivo, and our representative animal data,
although limited, suggest that this approach is feasible and
Available online />Figure 2
(A) Bland–Altman plot of fluorescence technique and predicted partial
oxygen tension (PO
2
), demonstrating close limits of agreement and no
systematic or proportional bias over the measurement range. (B)
Bland–Altman plot of polarographic technique and predicted PO
2
demonstrating clear proportional bias, which corrects with logarithmic
transformation of the data (C).
Figure 3
Data are expressed as means ± SEM from three animals. (A) Plot of
skeletal muscle partial oxygen tension (PtO
2
) against time, showing
clear reduction in signal during both ischemic (cross clamp) and
hypoxic epochs. (B) Pt
O
2
plotted by intervention. Significant
differences were found between PtO
2
values for each group and the
baseline PtO
2
value, and between each intervention group and the
group immediately preceding it.
accurate, at least in skeletal muscle. Predictably, the tissue
P
O
2
dropped during both the period of presumed ischemia
(aortic cross-clamping) and hypoxia (Fi
O
2
= 0.0), and we con-
clude from this that the fluorescence quenching method is
able to detect changes in a biologically plausible signal.
The technique of oxygen measurement described here is at
least as accurate as the accepted polarographic technique, is
cheaper and more wieldy, does not consume oxygen, and
may be combined with existing devices (such as a nasogas-
tric tube) more easily. We believe that this approach is a
useful addition to the available techniques and that it might
allow more widespread use of tissue P
O
2
measurement, both
as a marker of tissue integrity and an indicator of impending
pathology. In vivo studies of fluorescence quenching P
O
2
measurement under different pathophysiologic conditions are
currently underway in our laboratory.
We believe our data illustrate an important concept in the
interpretation of method comparison studies. Reliance on the
correlation coefficient alone may lead to the erroneous con-
clusion that there is no difference between the techniques
[20]. Close correlation (with a high value for r
2
) merely identi-
fies a close relationship between two variables. The method
of Bland and Altman reveals differences between the two
techniques, and we believe that close limits of agreement
with a small overall bias should be characteristic features of a
dataset that leads to a conclusion of no difference between
the two methods under consideration. Our data revealed a
proportional bias in the standard technique, and we were
able to demonstrate this by comparing both techniques with
a theoretical (but constant for each system) variable.
Competing interests
None declared.
Acknowledgements
The present study was supported by Institutional Research Grants 4-
3721202 and 1-8779701 to Dr Shaw. We gratefully acknowledge the
help of Dr P. Dougherty, PhD, and the Office of Scientific Publications,
M.D. Anderson Cancer Center with preparation of the manuscript. This
work was presented in part at The American Society of Anesthesiolo-
gists 2001 Annual Meeting, October 13–17 2001, New Orleans,
Louisiana, USA.
References
1. Levy JM, Simmons JA: A compact oxygen tension sensor. Med
Biol Eng 1972, 10:121-122.
2. Nordsmark M: Direct measurements of tumor-tissue PO
2
: a
way of selecting patients for hyperoxic treatment. Strahlenther
Onkol 1996, 172(suppl 2):8-9.
3. Kram HB, Shoemaker WC: Method for intraoperative assess-
ment of organ perfusion and viability using a miniature
oxygen sensor. Am J Surg 1984, 148:404-407.
4. Holden BA, Sulonen J, Vannas A, Sweeney DF, Efron N: Direct in
vivo measurement of corneal epithelial metabolic activity
using a polarographic oxygen sensor. Ophthalm Res 1985, 17:
168-173.
5. Piasecki C: First experimental results with the oxygen elec-
trode as a local blood flow sensor in canine colon. Br J Surg
1985, 72:452-453.
6. Fiddian-Green RG, Baker S: Predictive value of the stomach
wall pH for complications after cardiac operations: compari-
son with other monitoring. Crit Care Med 1987, 15:153-156.
7. Gunter JB: A buccal sensor for measuring arterial oxygen sat-
uration. Anesth Analg 1989, 69:417-418.
8. Stefansson E, Peterson JI, Wang YH: Intraocular oxygen
tension measured with a fiber-optic sensor in normal and dia-
betic dogs. Am J Physiol 1989, 256:H1127-H1133.
9. Hjortdal VE, Timmenga EJ, Kjolseth D, Brink Henriksen T, Stender
Hansen E, Djurhuus JC, Gottrup F: Continuous direct tissue
oxygen tension measurement: a new application for an
intravascular oxygen sensor. Ann Chir Gynaecol 1991, 80:8-
13.
10. Golde AR, Mahoney JL: The oxygen optode: an improved
method of assessing flap blood flow and viability. J Otolaryn-
gol 1994, 23:138-144.
11. Hopf HW, Hunt TK: Comparison of Clark electrode and optode
for measurement of tissue oxygen tension. Adv Exp Med Biol
1994, 345:841-847.
12. Powell CC, Schultz SC, Burris DG, Drucker WR, Malcolm DS:
Subcutaneous oxygen tension: a useful adjunct in assess-
ment of perfusion status. Crit Care Med 1995, 23:867-873.
13. McKinley BA, Parmley CL, Butler BD: Skeletal muscle PO
2
,
PCO
2
, and pH in hemorrhage, shock, and resuscitation in
dogs. J Trauma 1998, 44:119-127.
14. Griffiths JR, Robinson SP: The OxyLite: a fibre-optic oxygen
sensor. Br J Radiol 1999, 72:627-630.
15. Charbel FT, Du X, Hoffman WE, Ausman JI: Brain tissue PO
2
,
PCO
2
, and pH during cerebral vasospasm. Surg Neurol 2000,
54:432-437.
16. Edelman GJ, Hoffman WE, Rico C, Ripper R: Comparison of
brain tissue and local cerebral venous gas tensions and pH.
Neurol Res 2000, 22:642-644.
17. Lubbers DW: Oxygen electrodes and optodes and their appli-
cation in vivo. Adv Exp Med Biol 1996, 388:13-34.
18. Fleckenstein W, Weiss C: A comparison of PO
2
histograms
from rabbit hind-limb muscles obtained by simultaneous
measurements with hypodermic needle electrodes and with
surface electrodes. Adv Exp Med Biol 1984, 169:447-455.
19. Eppendorf Instruments: Eppendorf PO
2
Histograph Operating
Manual: Program Version 2.5. Eppendorf Instruments: Hamburg,
Germany; 1993: 25-26.
20. Bland JM, Altman DG: Statistical methods for assessing agree-
ment between two methods of clinical measurement. Lancet
1986, 1:307-310.
21. McKinley BA, Butler BD: Comparison of skeletal muscle PO
2
,
PCO
2
, and pH with gastric tonometric PCO
2
and pH in hemor-
rhagic shock. Crit Care Med 1999, 27:1869-1877.
22. Siegemund M, van Bommel J, Ince C: Assessment of regional
tissue oxygenation. Intensive Care Med 1999, 25:1044-1060.
23. Niehoff K, Barnikol WK: A new measuring device for non-inva-
sive determination of oxygen partial pressure and oxygen
conductance of the skin and other tissues. Adv Exp Med Biol
1999, 471:705-714.
24. Hoffman WE, Charbel FT, Edelman G, Ausman JI: Thiopental and
desflurane treatment for brain protection. Neurosurgery 1998,
43:1050-1053.
25. Frankel HL, Nguyen HB, Shea-Donohue T, Aiton LA, Ratigan J,
Malcolm DS: Diaspirin cross-linked hemoglobin is efficacious
in gut resuscitation as measured by a GI tract optode. J
Trauma 1996, 40:231-240.
26. Whitney JD, Stotts NA, Goodson WH: Effects of dynamic exer-
cise on subcutaneous oxygen tension and temperature. Res
Nursing Health 1995, 18:97-104.
27. McKinley BA, Ware DN, Marvin RG, Moore FA: Skeletal muscle
pH, PCO
2
, and PO
2
during resuscitation of severe hemor-
rhagic shock. J Trauma 1998, 45:633-636.
28. Singer M, Rosser D, Stidwill R: Bladder epithelial oxygen
tension as a marker of organ perfusion. Acta Anaesthesiol
Scand Suppl 1995, 107:77-80.
29. Sinaasappel M, Ince C: Calibration of Pd-porphyrin phospho-
rescence for oxygen concentration measurements in vivo. J
Appl Physiol 1996, 81:2297-2303.
30. Christoforides C, Laasberg LH, Hedley-Whyte J: Effect of tem-
perature on solubility of O
2
in human plasma. J Appl Physiol
1969, 26:56-60.
Critical Care February 2001 Vol 6 No 1 Shaw et al.