Báo cáo y học: "External validation of a modified model of Acute Physiology and Chronic Health Evaluation (APACHE) II for orthotopic liver transplant patients" docx
Bạn đang xem bản rút gọn của tài liệu. Xem và tải ngay bản đầy đủ của tài liệu tại đây (59.6 KB, 6 trang )
Available online />Research
External validation of a modified model of Acute Physiology and
Chronic Health Evaluation (APACHE) II for orthotopic liver
transplant patients
Yaseen Arabi
1
, Adnan Abbasi
2
, Radoslaw Goraj
3
, Abdulmajeed Al-Abdulkareem
4
,
Abudullah Al Shimemeri
5
, Munci Kalayoglu
6
and Kenneth Wood
7
1
Program Director, Critical Care Fellowship, Intensive Care Department, King Fahad National Guard Hospital, Riyadh, Kingdom of Saudi Arabia
2
Fellow, Pulmonary and Critical Care Medicine, University of Wisconsin Hospital and Clinics, Madison, USA
3
Assistant Consultant, Intensive Care Department, King Fahad National Guard Hospital, Riyadh, Kingdom of Saudi Arabia
4
Chairman, Hepatobiliary Sciences and Liver Transplantation Department, King Fahad National Guard Hospital, Riyadh, Kingdom of Saudi Arabia
5
Chairman, Intensive Care Department, King Fahad National Guard Hospital, Riyadh, Kingdom of Saudi Arabia
6
Director of Liver Transplantation, University of Wisconsin Hospital and Clinics, Madison, USA
7
Director of Critical Care Medicine, University of Wisconsin Hospital and Clinics, Madison, USA
Correspondence: Yaseen Arabi,
APACHE = Acute Physiology and Chronic Health Evaluation; CI = confidence interval; GCS = Glasgow Coma Score; ICU = intensive care unit;
OLTX = orthotopic liver transplantation; ROC = receiver operating characteristic; SMR = standardized mortality ratio.
Abstract
Introduction The purpose of the study was to validate the newly derived postoperative orthotopic liver
transplantation (OLTX)-specific diagnostic weight for the Acute Physiology and Chronic Health
Evaluation (APACHE) II mortality prediction system in independent databases.
Methods Medical records of 174 liver transplantation patients admitted postoperatively to the adult
intensive care units at King Fahad National Guard Hospital and the University of Wisconsin were
reviewed, and data on age, sex, the underlying liver disease, APACHE II scores and the hospital
outcome were collected. Predicted mortality was calculated using: 1) the original APACHE II
diagnostic weight of postoperative other gastrointestinal surgery and 2) the newly derived OLTX-
specific diagnostic category weight. Standardized mortality ratio and 95% confidence intervals were
calculated. Calibration was evaluated with the Hosmer–Lemeshow goodness-of-fit C-statistic.
Discrimination was tested by 2 × 2 classification matrices and by computing the areas under the
receiver operating characteristic curves. Patient characteristics and outcome data were compared
between the two hospitals.
Results APACHE II significantly overestimated mortality when the original diagnostic weight was used,
but provided a closer estimate of mortality with the OTLX-specific diagnostic weight. The C-statistic
analysis showed better calibration for the new approach; discrimination was also improved. The
performances of the prediction systems were similar in the two hospitals. The new model provided
more accurate estimates of hospital mortality in each hospital.
Discussion APACHE II provided an accurate estimate of mortality in liver transplant patients when the
OLTX-specific diagnostic weight was used. With the new model, APACHE II can be used as a valid
mortality prediction system in this group of patients.
Keywords APACHE II, liver transplantation, mortality, scoring systems
Received: 22 October 2001
Revisions requested: 24 January 2002
Revisions received: 25 February 2002
Accepted: 12 March 2002
Published: 8 April 2002
Critical Care 2002, 6:245-250
This article is online at />© 2002 Arabi et al., licensee BioMed Central Ltd
(Print ISSN 1364-8535; Online ISSN 1466-609X)
Critical Care June 2002 Vol 6 No 3 Arabi et al.
Introduction
With the increasing worldwide availability of liver transplanta-
tion, a standardized assessment of severity of illness is
needed to evaluate patient outcome objectively over time and
between different institutions. Cirrhosis-specific scoring
systems, such as the Child–Pugh classification and Show’s
risk score, have been shown to be good predictors of
outcome of cirrhotic patients [1]. However, when used as pre-
dictors of outcome for liver transplantation patients the results
are inconsistent [2–4]. This is partly explained by the fact that
the preoperative condition is only one factor in a series of
complex interactions that include intra-operative and postoper-
ative factors. Systems for predicting the severity of illness and
mortality, such as the Acute Physiology and Chronic Health
Evaluation (APACHE) II system, are attractive options for this
group because they rely on data collected soon after admis-
sion to the intensive care unit (ICU), which is likely to reflect
preoperative, intra-operative and postoperative contributions.
The APACHE II system was described by Knaus et al. in
1985 to predict hospital mortality in ICU patients [5]. The
multiple logistic regression equations were based on data
collected on 5050 medical and surgical patients admitted to
the ICU in 13 tertiary medical centers in the USA. This
outcome prediction system has been used to evaluate and
compare the performance of ICUs in different hospitals and
countries. In addition to general ICU patients, APACHE II has
also been studied in specific groups of patients such as
those with trauma [6], sepsis [7], and cirrhosis [8].
The APACHE II prediction equation incorporates three vari-
ables: an APACHE II score, the diagnostic category of the
patient, and whether the surgery was emergency or elective.
The APACHE II score consists of the Acute Physiology
Score, which is calculated from 14 physiologic variables that
are scored from 0 to 4 and depend upon the degree of devia-
tion from normal. Points for age and for chronic illness are
also assigned. There are 50 different diagnostic categories,
each with a different weight used in calculating the predicted
mortality. There is no specific diagnostic category weight for
liver transplantation, because there were no liver transplanta-
tion patients in the developmental database for this system.
Thus, when this system is used for postoperative liver trans-
plantation patients, the diagnostic category weight ‘postoper-
ative other gastrointestinal surgery’ is used. This approach
has been shown to overestimate mortality significantly [9].
Angus et al. recently derived a new diagnostic category
weight based on their population of liver transplantation
patients [9]. The purpose of the study was to validate the
newly derived postoperative orthotopic liver transplantation
(OLTX)-specific diagnostic weight for APACHE II in indepen-
dent databases.
Methods
King Fahad National Guard Hospital (KFNGH) is a 550-bed
tertiary care center. The 12-bed medical–surgical ICU has
600 admissions per year. The liver transplantation program
is the main program in the Kingdom of Saudi Arabia. The
University of Wisconsin (UW) liver transplantation program
is a major program in the USA. Liver transplantation patients
are admitted to the Trauma and Life Support Center, which
is a multidisciplinary ICU that admits 2000 patients per
year. Medical records of liver transplantation patients admit-
ted postoperatively to the adult ICU in the period April 1996
to January 2000 at KFNGH and April 1997 to January 2000
at UW were reviewed. Re-transplantations, kidney–liver and
living–related transplantations were excluded. The following
data were collected: age, sex, and underlying liver disease.
APACHE II scores were calculated according to the original
methodology by using the worst physiologic values in the
first ICU day. The only exception was Glasgow Coma Score
(GCS). Most of these patients were still under the influence
of postoperative sedation during the first 24 hours in ICU,
and the worst GCS would reflect the effect of sedation
more than the true underlying mental status. We therefore
used the best GCS, which we felt would be a better reflec-
tion of the patient’s mental status. All patients were given
chronic health points. Vital status at discharge from the hos-
pital was registered.
Predicted mortality was calculated with the logistic regres-
sion formula described in the original article [5]. We used two
approaches: the original APACHE II diagnostic category
weight of postoperative gastrointestinal surgery (–0.613),
and the OLTX-specific diagnostic category weight calculated
by Angus et al. (–1.076) [9]. The formulae for calculating pre-
dicted mortality (risk of death [ROD]) are as follows:
for the original approach, ln (ROD/1 – ROD) = –3.517 +
(APACHE II score × 0.146) – 0.613;
for the new approach, ln (ROD/1 – ROD) = –3.517 +
(APACHE II score × 0.146) – 1.076.
Standardized mortality ratio (SMR) was calculated by dividing
observed mortality by the predicted mortality. The 95% confi-
dence intervals (CIs) for SMRs were calculated by regarding
the observed mortality as a Poisson variable, then dividing its
95% CI by the predicted mortality [10]. The two approaches
were compared with regard to calibration (the ability to
provide a risk estimate corresponding to the observed mortal-
ity) and discrimination (the ability of the predictive system to
differentiate survivors from non-survivors). The calibration of
both systems was evaluated with the Hosmer–Lemeshow
goodness-of-fit C-statistic [11]. We calculated the C-statistic
by dividing the study population into six equal groups with
increasing predicted mortality to ensure an adequate number
of patients in each group. Discrimination was tested by 2 × 2
classification matrices at decision criteria of 10%, 30%, and
50%. Receiver operating characteristic (ROC) curves were
constructed as a measure of assessing discrimination with
10% stepwise increments in predicted mortality. The two
curves were compared by computing the areas under the
ROC curves [12,13].
The patient characteristics and outcome data from the two
participating institutions were compared, to evaluate the
overall performance of the system between the two hospitals.
Continuous variables were expressed as means ± SD. Cate-
gorical values were expressed in absolute and relative fre-
quencies. All categorical variables were analyzed by the χ
2
test. Non-parametric variables were compared by Kruskal–
Wallis test. P values of 0.05 or less were considered signifi-
cant. Minitab for Windows (Release 12.1, Minitab Inc.) was
used for statistical analysis.
Results
Patient characteristics
During the study period 174 postoperative liver transplanta-
tion patients were admitted to ICU. Patients’ characteristics,
underlying liver disease, APACHE II scores, and predicted
and observed outcomes are shown in Table 1.
Actual and predicted hospital mortality rates
The mean APACHE II score was 13.96, with an SD of 5.76.
Observed mortality was 5.75%. When the original diagnostic
weight was used, APACHE II significantly overestimated mor-
tality (predicted mortality 12.96%, SMR 0.44, 95% CI
0.22–0.80). When the new diagnostic weight was used, the
system provided a closer estimate of mortality (predicted mor-
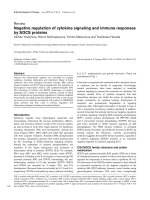
tality 8.89%, SMR 0.65, 95% CI 0.31–1.16). Fig. 1 shows
actual and predicted mortality with the use of both approaches
in the whole cohort classified according to APACHE II score.
Calibration
The goodness-of-fit analysis, with the Hosmer–Lemeshow C-
statistic, is shown in Table 2; the new system had better cali-
bration (original model, χ
2
= 11.06, P = 0.03; new model,
χ
2
= 5.92, P = 0.20).
Discrimination
Discrimination examined by 2 × 2 classification matrices
showed an improvement with the new diagnostic category
weight. This was reflected by the higher overall correct classi-
fication rate at the three examined decision criteria (see
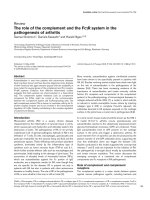
Table 3). Discrimination was also tested by ROC curves
(Fig. 2): the areas under receiver characteristic curves for the
two approaches were almost identical (0.740 and 0.744,
respectively).
Comparison between the two institutions
Table 4 shows the characteristics of patients on the basis of
their institutions. Patients from KFNGH were slightly (but sig-
nificantly) younger than patients at UW. Hepatitis C virus was
more common, and alcohol-related liver disease was less
common, as an underlying disease in patients in KFNGH than
in those at UW. APACHE II scores, and correspondingly pre-
dicted mortalities, were higher in KFNGH patients. Despite
these differences, the performances of the prediction
systems (the old and the new models) were quite similar in
the two hospitals as reflected by SMRs. The new approach
provided more accurate estimates of hospital mortality in
each hospital than the old model.
Discussion
The findings of our study can be summarized as follows:
(1) APACHE II with its original diagnostic category weight
overestimated hospital mortality in postoperative liver trans-
plantation patients; (2) when the newly derived OLTX-specific
Available online />Table 1
Characteristics of patients
Characteristic All patients Survivors Non-survivors P
Number of patients 174 164 10
Age (years) 50 ± 12 49.82 ± 2.09 49.60 ± 9.25 NS
Females/males 70/104 66/98 4/6 NS
Hepatitis C 46 (26) 42 4 NS
EtOH 22 (13) 21 1 NS
HCV–EtOH 25 (14) 23 2 NS
Other 81 (47) 78 3 NS
APACHE II score 13.81 ± 5.26 13.46 ± 5.06 19.50 ± 5.56 0.001
ROD original model 12.96 ± 10.25 12.27 ± 9.60 24.28 ± 4.12 0.001
ROD new model (%) 8.89 ± 8.08 8.37 ± 7.60 17.37 ± 11.14 0.001
SMR original model; 95% CI 0.44; 0.22–0.80
SMR new model; 95% CI 0.65; 0.31–1.16
Figures in parentheses are percentages. EtOH, alcohol liver disease; HCV, hepatitis C virus; NS, not significant; ROD, risk of death; SMR,
standardized mortality ratio.
diagnostic category weight was applied, mortality prediction,
discrimination, and calibration of APACHE II improved;
(3) despite differences in the patient populations, the perfor-
mance of the old and new models, as reflected by SMRs,
was similar in the two institutions.
The literature evaluating APACHE II in postoperative liver
transplantation patients is limited. Bein et al. [14] reviewed
the use of scoring systems in 123 liver transplantation
patients. In their study, APACHE II scores were reported;
however, no calculation of the predicted mortality was per-
formed. The study showed that APACHE II scores had good
discrimination as reflected by the areas under the curves of
the ROC curves. A second study by Sawyer et al. [15] found
that mortality correlated with the APACHE II score. However,
the predicted mortality was again not calculated.
Angus et al. [9] recently calculated the predicted mortality for
postoperative liver transplantation patients and found that
APACHE II system overestimated mortality when the original
Critical Care June 2002 Vol 6 No 3 Arabi et al.
Figure 1
Actual mortality (triangles), mortality predicted with the original model
(diamonds) and mortality predicted with the orthotopic liver
transplantation-specific diagnostic category weight (circles) in the
whole cohort stratified by APACHE II scores. The bars represent the
numbers of patients in each subgroup.
0
10
20
30
40
1–9 10–12 13–15 16–18 19–34
APACHE II score
No. of patients
0
0.1
0.2
0.3
0.4
Hospital mortality
Table 2
Lemeshow–Hosmer goodness-of-fit
C
-statistic for APACHE II in its original and new models
Predicted by APACHE II Predicted by APACHE II
Observed original model new model
Group N Died Survived Died Survived Died Survived
1 29 0 29 1.28 27.72 0.82 28.18
2 29 0 29 1.87 27.13 1.20 27.80
3 29 1 28 2.52 26.48 1.64 27.36
4 29 2 27 3.41 25.59 2.25 26.75
5 29 0 29 4.64 24.36 3.10 25.90
6 29 7 22 8.84 20.16 6.45 22.55
C-statistic 11.06 (df = 4) 5.92 (df =4)
P value 0.03 0.20
df, degrees of freedom.
Table 3
Classification matrix and sensitivity analysis for APACHE II in its original and new models
Died Alive
Model Cutpoint (%) PD PS PD PS Sensitivity (%) Specificity (%) PPV (%) NPV (%) OMCR (%) OCCR (%)
Original 10 8 2 76 88 80 54 10 98 45 55
30 3 7 7 157 30 96 30 96 8 92
50 0 10 2 162 0 99 0 94 7 93
New 10 7 3 42 122 70 74 14 98 26 74
30 2 8 3 161 20 98 40 95 6 94
50 0 10 2 162 0 99 0 94 7 93
OCCR, overall correct classification rate; OMCR, overall misclassification rate; NPV, negative predictive value; PDV, positive predictive value; PD,
predicted to die; PS, predicted to survive.
equation was used (SMR 0.73, 95% CI 0.58–0.99). This is
consistent with our findings. The inaccuracy of APACHE II
with its original equation probably arises from several factors.
The developmental database of APACHE II did not have liver
transplantation patients; the use of the system with the origi-
nal equation for liver transplantation patients therefore essen-
tially assumes that the weighted diagnostic category for liver
transplantation would be the same as for postoperative gas-
trointestinal surgery. In this study we show, as shown previ-
ously by Angus et al. [9], that this assumption is not accurate
because it leads to a significant overestimation of mortality.
We believe that the reason is related to the unique patho-
physiology of the period after liver transplantation. Marked
changes occur during the procedure, especially at the time of
reperfusion [16,17]. These include a significant decrease in
blood pressure, a decrease in systemic vascular resistance,
an increase in cardiac output, a decrease in pH, an increase
in lactate, an increase in potassium, and a prolongation of
prothrombin time [16,17]. Although some of these abnormali-
ties start to normalize during the final stages of surgery, some
will persist into to the immediate postoperative period [16]
and will be reflected on any severity of illness score such as
APACHE II. These changes start to normalize rapidly as the
graft starts to function. The multitude of the abnormalities and
the speed with which they are corrected make this group of
patients unique and explains the inaccuracy of APACHE II
when using the diagnostic category weight of ‘postoperative
gastrointestinal surgery’.
On the basis of the above, it is not surprising that a model
developed on a population of liver transplant patients would
provide more accurate and reproducible estimates. Similar
disease-specific customizations of mortality prediction
systems have been performed, such as for sepsis [18].
Available online />Table 4
Comparison between the two participating transplant centers
Characteristic KFNGH UW P
Number of patients 63 111
Age (years) 46.25 ± 13.97 51.82 ± 10.12 0.04
Females/males 27/36 43/68 NS
Hepatitis C 36 (57) 10 (9) <0.001
EtOH 0 (0) 22 (20) <0.001
HCV–EtOH 2 (3) 23 (21) 0.002
Other etiologies 25 (40) 56 (50) NS
Actual mortality 6 (9.52) 4 (3.60) NS
APACHE II score 21.09 ± 5.01 14.37 ± 3.59 <0.001
ROD, original model 20.55 ± 12.94 8.65 ± 4.38 <0.001
ROD, new model 14.54 ± 10.73 5.68 ± 3.01 <0.001
SMR, original model; 95% CI 0.46; 0.17–0.95 0.42; 0.11–1.04
SMR, new model; 95% CI 0.65; 0.25–1.35 0.63; 0.17–1.57
Figures in parentheses are percentages. EtOH, alcohol liver disease; HCV, hepatitis C virus; KFNGH, King Fahad National Guard Hospital; NS, not
significant; ROD, risk of death; SMR, standardized mortality ratio; UW, University of Wisconsin.
Figure 2
The receiver characteristic curves for the original model (dashed line)
and the new model (continuous line).
0
10
20
30
40
50
60
70
80
90
100
0 102030405060708090100
1 – Specificity (%)
(false positive rate)
Sensitivity (%)
(true positive rate)
There are several obvious advantages to the use of APACHE
II as a model of severity of illness for liver transplant patients.
These include the familiarity with the system and its wide-
spread use in ICUs. ICUs that use APACHE II as their data-
base severity of illness scoring system will find it easy to
apply the system to this subgroup of patients rather than
implementing a special disease-specific system exclusively
for OLTX patients. In general, using a system for scoring the
severity of illness is essential for monitoring transplant
program performance over time and between different institu-
tions. Such a system also can be useful for grouping patients
in clinical studies.
In conclusion, APACHE II provided an accurate estimate of
mortality in liver transplant patients when the OLTX-specific
diagnostic category weight was used.
Competing interests
None declared.
References
1. Infante-Rivard C, Esnaola S, Villeneuve JP: Clinical and statistical
validity of conventional prognostic factors in predicting short-
term survival among cirrhotics. Hepatology 1987, 17:660-664.
2. Deschenes M, Villeneuve JP, Dagenais M, Fenyves D, Lapointe R,
Pomier-Layrargues G, Roy A, Willems B, Marleau D: Lack of rela-
tionship between preoperative measures of severity of cirrho-
sis and short-term survival after liver transplantation. Liver
Transpl Surg 1997, 3:532-537.
3. Maggi U, Rossi G, Colledan M , Fassati LR, Gridelli B, Reggiani P,
Basadonna G, Colombo A, Doglia M, Ferla G: Child–Pugh score
and liver transplantation. Transplant Proc 1993, 25:1769-1770.
4. Show BW, Wood P, Stratta RJ, Pillen TJ, Langnas AN: Stratifying
the causes of death in liver transplant recipients. Arch Surg
1989, 124:895-900.
5. Knaus WA, Draper EA, Wagner DP, Zimmerman JE: APACHE II:
a severity of disease classification system. Crit Care Med
1985, 13:818-829.
6. Wong DT, Barrow PM, Gomez M, McGuire GP: A comparison of
the Acute Physiology and Chronic Health Evaluation
(APACHE) II score and the Trauma-Injury Severity Score
(TRISS) for outcome assessment in intensive care unit
trauma patients. Crit Care Med 1996, 24:1642-1648.
7. Bohnen JM, Mustard RA, Oxholm SE, Schouten BD: APACHE II
score and abdominal sepsis. Arch Surg 1988, 123:225-229.
8. Zauner CA, Apsner RC, Kranz A, Kramer L, Madl C, Schneider B,
Schneeweiss B, Ratheiser K, Stockenhuber F, Lenz K: Outcome
prediction for patients with cirrhosis of the liver in a medical
ICU: a comparison of APACHE scores and liver-specific
scoring systems. Intens Care Med 1996, 22:559-563.
9. Angus DC, Clermont G, Kramer DJ, Linde-Zwirble WT, Pinsky MR:
Short-term and long-term outcome prediction with the Acute
Physiology and Chronic Health Evaluation II system after ortho-
topic liver transplantation. Crit Care Med 2000, 28:150-156.
10. Goldhill DR, Sumner A: Outcome of intensive care patients in a
group of British intensive care units. Crit Care Med 1998, 26:
1337-1345.
11. Lemeshow S, Hosmer DW: A review of goodness of fit statis-
tics for use in the development of logistic regression models.
Am J Epidemiol 1982, 115:92-106.
12. Metz CE: Basic principles of ROC analysis. Semin Nucl Med
1978, 8:283-298.
13. Hanley JA, McNeil BJ: The meaning and use of the area under
a receiver operating characteristic (ROC) curve. Radiology
1982, 143:29-36.
14. Bein T, Frohlich D, Pomsl J, Forst H, Pratschke E: The predictive
value of four scoring systems in liver transplant recipients.
Intens Care Med 1995, 21:32-37.
15. Sawyer RG, Durbin CG, Rosenlof LK, Pruett TL: Comparison of
APACHE II scoring in liver and kidney transplant recipients
versus trauma and general surgical patients in a single inten-
sive care unit. Clin Transplant 1995, 9:401-405.
16. Kalpokas M, Bookallil M, Sheil AG, Rickard KA: Physiological
changes during liver transplantation. Anaesth Intens Care
1989, 17:24-30.
17. Rettke SR, Janossy TA, Chantigian RC, Burritt MF, Van Dyke RA,
Harper JV, Ilstrup DM, Taswell HF, Wiesner RH, Krom RA: Hemo-
dynamic and metabolic changes in hepatic transplantation.
Mayo Clin Proc 1989, 64:232-240.
18. LeGall JR, Lemeshow S, Leleug, Klar J, Huillard J, Rui M. Teres D,
Artigas A: Customized probability models for early severe
sepsis in adult intensive care patients. JAMA 1995, 273:644-
650.
Critical Care June 2002 Vol 6 No 3 Arabi et al.
Key messages
• APACHE II with its original diagnostic category weight
overestimated hospital mortality in postoperative liver
transplantation patients.
• When the newly derived OLTX specific diagnostic
category weight was applied, mortality prediction,
discrimination and calibration of APACHE II improved.
• Despite differences in the patient population, the
performance of the old and new models was similar in
the two institutions as reflected by SMRs.