Báo cáo khoa học: " Consequences of hazardous dietary calcium deficiency for fattening bulls" pdf
Bạn đang xem bản rút gọn của tài liệu. Xem và tải ngay bản đầy đủ của tài liệu tại đây (496.9 KB, 7 trang )
BioMed Central
Page 1 of 7
(page number not for citation purposes)
Acta Veterinaria Scandinavica
Open Access
Research
Consequences of hazardous dietary calcium deficiency for fattening
bulls
Teppo Heinola*
1,2
, Elias Jukola
2
, Päivi Näkki
2
and Antti Sukura*
1
Address:
1
Department of Basic Veterinary Sciences, Faculty of Veterinary Medicine, University of Helsinki, P.O. Box 66, FI-00014 University of
Helsinki, Finland and
2
LSO Foods Oy, P.O. Box 49, 01511 Vantaa, Finland
Email: Teppo Heinola* - ; Elias Jukola - ; Päivi Näkki - ;
Antti Sukura* -
* Corresponding authors
Abstract
Background: Deficient mineral supplementation on a feedlot farm resulted in severe clinical
manifestations in fattening bulls. Animals mistakenly received only 60–70% of the recommended
calcium intake, while simultaneously receiving twice the amount of phosphorus recommended.
Thus, the dietary Ca/P ratio was severely distorted. After approximately six months on such a diet,
four fattening bulls were euthanized because of severe lameness and 15% of other animals on the
farm were having clinical leg problems. Veterinary consultation revealed the mistake in mineral
supplementation.
Methods: Fattening bulls were divided into three groups depending on the time of their arrival to
the farm. This enabled the effect of mineral imbalance at different growth phases to be examined.
After slaughtering, the bones of both front and hind limbs were macroscopically evaluated.
Results: Over 80% of the animals with a calcium-deficient diet had at least one severe
osteoarthritic lesion. The economic impact of the calcium deficiency was statistically significant.
Conclusion: Calcium deficiency with distorted Ca/P ratio yielded a severe outbreak of
osteoarthritis in fattening bulls. Calcium deficiency caused a more serious lesions in age group 5–
12 months than age group 12–18 months. Besides causing obvious economic losses osteoarthritis
is also a welfare issue for feedlot animals.
Background
Lameness of fattening dairy and meat bulls is an animal
welfare issue that also has significant economic conse-
quences. Affected animals often suffer from osteoarthritis
(OA) [1]. OA is a degenerative joint disease affecting the
articular-epiphyseal cartilage complex. The aetiopatho-
genesis in growing bulls is variable, including trauma and
osteochondrosis (OC) [1]. OC is a failure of endochon-
dral ossification [2,3].
OC is believed to be multifactorial, but the exact risk fac-
tors are still under debate. Typical predisposing causes
connected to the development of OC in cattle and swine
are nutritional, environmental [4,5] and hereditary [6]. A
rapid growth rate [7], which is linked to high-intensity
feeding [8-10], is strongly associated with OC. Moreover,
calcium or phosphorus deficiency or an imbalance of
these minerals is reported to be related to OC [11]. Bulls
growing in a hard-surface environment or on slatted
floors tend to have more severe growth cartilage changes
Published: 08 December 2006
Acta Veterinaria Scandinavica 2006, 48:25 doi:10.1186/1751-0147-48-25
Received: 12 April 2006
Accepted: 08 December 2006
This article is available from: />© 2006 Heinola et al; licensee BioMed Central Ltd.
This is an Open Access article distributed under the terms of the Creative Commons Attribution License ( />),
which permits unrestricted use, distribution, and reproduction in any medium, provided the original work is properly cited.
Acta Veterinaria Scandinavica 2006, 48:25 />Page 2 of 7
(page number not for citation purposes)
[4,10]. A higher risk is also associated with tie stall systems
and lack of movement [12,13]. In addition, different
kinds of traumas can lead to OC [5]. According to some
studies, hereditary factors and gender of the animal may
have an impact on development of OC [14,7,10]. Numer-
ous interactions between different predisposing factors
also exist.
Animals suffering from OA often show such clinical
symptoms as lameness and unwillingness to move, fluid
in affected joints and difficulty in standing up. Their gait
is stiff and the lameness is frequently bilateral. Ruptures of
the Achilles tendon have also been reported [8]. Medical
and surgical therapies can be used on bulls with OA and
OC, but the prognosis is poor [10].
Clinically, OC is most often seen in animals aged 14–22
months [8], and OA in older dairy bulls which may also
have OC lesions [9]. OC as a failure of endochondral ossi-
fication is naturally associated with maturation and
growth of the skeleton [4,10]. One study suggests that
osteochondrotic changes start to emerge before weaning
[15]. In any case, the interactions between age and expo-
sures to predisposing factors are not fully understood.
In this case report, we describe the consequences of an
accidental mineral deficiency on a feedlot farm. We ana-
lyse differences between exposure groups and estimate the
economic losses due to calcium deficiency and OA.
Materials and methods
Case history
A Finnish dairy bull owner contacted the veterinarian
because the animals were having an increasing number of
leg problems. Affected animals were lame; they had diffi-
culty in getting up and spent most of their time recum-
bent. The first symptoms were noticed about one month
before contacting the veterinarian.
Four animals aged approximately 12 months were eutha-
nized because they were unable to stand. Carcasses were
sent to the slaughterhouse, where they were inspected by
a veterinarian. The first animal had a rupture of the Achil-
les tendon with suppurative inflammation and an acute,
bilateral aseptic inflammation of the stifle joints. The sec-
ond animal had a bilateral Achilles tendon rupture. The
third bull had a fractured front leg and aseptic inflamma-
tion of the stifle and elbow joints. The fourth animal had
aseptic inflammation bilaterally of the elbow joint and
the stifle joint and a ruptured Achilles tendon. The veteri-
narian sent a hind leg of the fourth animal the Finnish
Food Safety Authority, Kuopio Research Unit, for patho-
logical evaluation. Lesions in the hock joint were reported
macroscopically to be typical for osteochondrosis.
At the time of the author's farm visit (TH); six animals had
already been slaughtered due to severe lameness. At the
visit, 16 of the 106 animals were found to have some kind
of leg problems. Affected animals were lame and had dif-
ferent degrees of swelling of the joints, mainly in the hock
and stifle joints.
The unit where leg problems emerged was for fattening of
dairy bulls from the age of 6 months to slaughter. Target
weight at 18 months was 330 kg. Minerals were added to
the animals' drinking water. In this kind of system, cal-
cium should also be provided in the ration. However, in
this case, calcium was mistakenly not added, and thus,
animals aged 6–18 months were calcium-deficient. At the
time of the farm visit, confusion with the feeding of the
minerals had been ongoing for seven months, affecting
different growing phases of animals in Groups 1 and 2.
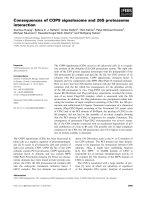
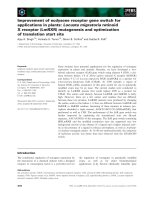
Group 3 animals entered the farm after hazard identifica-
tion (Fig. 1). Exposed animals had received only 60–70%
of the calcium needed, but the amount of phosphorus was
more than twice the recommended level. The Ca/P ratio
was thus severely distorted.
In this study, we report post-mortem macroscopic find-
ings of both front and hind limbs of the three groups of
dairy bulls. At the time of slaughter, animals were clini-
cally healthy. The first group of animals consisted of 20
bulls slaughtered between the ages of 18.3 and 19.4 (aver-
age 18.7) months. This group had received a low-calcium
diet on average from the age of 9 months to 16 months.
The second group consisted of 16 animals aged 21–22
Time and duration of exposure to a low-calcium diet in dif-ferent fattening groupsFigure 1
Time and duration of exposure to a low-calcium diet in dif-
ferent fattening groups. S( ) = mean age ± SE (days) of the
animals in the group at the time of slaughter. Each box is
equal to 30 days. The calcium-deficient period is indicated
with shading.
1 = Group 1, n=20, S (561.5
±
8.2)
2 = Group 2, n=16, S (660.4
±
9.6)
3 = Group 3, n=15, S (583.3
±
18.0)
1
2
3
Acta Veterinaria Scandinavica 2006, 48:25 />Page 3 of 7
(page number not for citation purposes)
(average 21.7) months. This group had received a low-cal-
cium diet on average from the age of 4.6 months to 11.6
months. The third group consisted of 15 animal aged
18.3–20.9 (average 19.2) months; this group had a nor-
mal, mineral-balanced diet (Fig. 1).
Diet
During the feedlot period (200–600 kg bodyweight), fat-
tening bulls are fed twice daily. Animals are divided into
two feeding groups based on their estimated weight: those
weighing 200–400 kg and those weighing over 400 kg.
Feeding of the animals is based on a feeding plan (Table
1). The home-grown components of the diet (silage and
barley) are analysed once a year. The feeding plan is also
reviewed annually. The animals' diets consisted of barley
(fresh preserved), ground rapeseed, mash and pre-dried
hay silage. To satisfy mineral requirements, drinking
water was supplemented with a balanced commercial
preparation (Hiveblend
®
, Hiven Oy, Paimio, Finland).
Calcium was mistakenly not given in the ration, and ani-
mals were therefore calcium-deficient for 8 and 7 months
in Groups 1 and 2, respectively (Table 2).
Sample collection and analyses
The bones (scapula, humerus, radius, ulna, femur, tibia,
fibula, talus, calcaneus) were removed at the abattoir. In
Group 1, the bones were collected on a group basis. In
Groups 2 and 3, the bones were collected on an animal
basis. In Group 2, all scapulas were missed because of a
sampling error. Bones were sent to the Section of Veteri-
nary Pathology at the University of Helsinki, where they
were stored below 4°C for 2–7 days prior to examination.
All joint surfaces were evaluated macroscopically. Loca-
tion, number and appearance of pathological changes
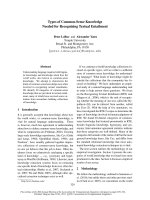
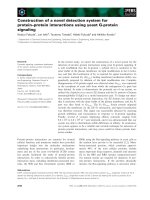
were recorded. Changes were categorized into four grades
(Fig. 2). Grade 1 was used when the lesion was minor, the
joint surface was roughened, the articular cartilage was
irregular and the lesion penetrated less than 2 mm into
the articular cartilage (Fig. 2A). Grade 2 was used when
the lesion was moderate, the joint surface was roughened
and the changed area penetrated 2–3 mm into the articu-
lar cartilage (Fig. 2B). Grade 3 was used when the lesion
was ulcerative and the change penetrated over 3 mm into
the articular cartilage (Fig. 2C). Grade 4 was used for
lesions classified as osteochondrosis dissecans (OD, Fig.
2D). The affected area was measured by using a round
hole table (Faber-Castell 906c, Germany), with holes
ranging from 1 mm to 36 mm. The depth of the affected
area was also recorded.
Statistical methods
Differences in weight gain and income between the three
groups were tested by one-way analysis of variance
(ANOVA) followed by Tukey's test. Levene's test was used
to evaluate the variance within each group. Chi-square
test was used to explore differences between groups in the
prevalence of severe lesions (lesions graded 2, 3 or 4).
McNemar's test was applied to assess the difference
between left and right leg bones. The effect of severe
lesions in different locations on weight gain in Groups 2
and 3 was determined by t-test. Results are expressed as
means or percentages (± standard errors of the mean
(SE)). P-values of less than 0.05 were considered statisti-
cally significant.
Results
The scapula was the bone most often affected (75%, Table
3). All OA lesions in scapulas were located in the glenoi-
dal cavity, on its weight-bearing surface; 83% of the
lesions were classified as grade 1 (Table 3).
Predilection sites of OA lesions in the humerus were the
medial trochlea (40% of affected bones) and the head of
the humerus (27%). OA lesions in the medial trochlea
could be divided into two locations; 66% of the changes
were found in the medial ridge and 34% in the mid-
region. However, the most severe lesions were situated in
the lateral trochlea of the humerus.
Table 1: Target composition of the feeding plan diet.
Animal weight 200–400 kg > 400 kg
Total amount of ME (MJ) 85.4 113.5
ME (MJ/kg DM) 11.7 11.7
% of roughage 40–60 40–60
% of crude protein 15.0 14.0
OIV (g/kg DM) 590 690
Calcium (g/d) 43 51
Phosphorus (g/d) 23 26
Ca/P ratio 1.8 1.8
ME = metabolizable energy
DM = dry matter
OIV = protein absorbable in small intestine
Acta Veterinaria Scandinavica 2006, 48:25 />Page 4 of 7
(page number not for citation purposes)
Predilection sites of OA lesions in the head of the radius
were the fovea capitis radii (42% of affected bones) and
the incisura trochlearis (35%).
The predilection site of OA lesions in the femur was the
trochlea ossis femoris (60% of affected bones). Lesions in
the trochlea of femoris varied from a narrow, fissure-like
vertical slit to a ≥ 10-mm crater-like ulceration and OD-
like lesions (Fig. 2D). Lesions appeared to originate in the
distal extremities of the trochlea, emerging vertically in
the proximal direction.
The predilection site of OA lesions in the tibia was the lat-
eral condyle.
The tarsal bones, specifically the talus and the calcaneus,
were often affected; predilection sites were the articular
surfaces between the tibia and these bones. Lesions in the
talus were severe; 16% were classified as grade 4 (OD).
The predilection site of OD lesions was the lateral trochlea
of the talus.
OA lesions were commonly bilateral. Only 13.8% of
lesions in the radius and 6.5% of lesions in the tarsus were
unilateral. In the femur, 28.6% of lesions were unilateral
(Table 4).
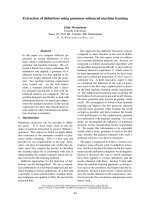
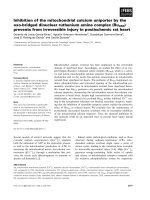
The weight gain per day varied between groups (Fig. 3).
Groups 1 and 2 had similar weight gains, but Group 3 had
a significantly (P < 0.001) higher gain. Due to carcass clas-
sification on the EUROP.e system, animals in Group 3
produced 20% better income (mean 1.42 €/d, SE 0.06)
than those in Group 2 (mean 1.19€/d, SE 0.04, P < 0.05)
and over 30% better income than those in Group 1 (mean
1.08€/d, SE 0.05, P < 0.001). Incomes in groups 1 and 2
were not statistically different.
A significant difference was present between groups in the
prevalence of severe lesions (lesions graded 2, 3 or 4).
Groups with a low-calcium diet (Groups 1 and 2) had a
significantly higher prevalence of OA lesions in the talus
A: grade 1 osteoarthritic lesions had minor roughening of the articular-epiphyseal cartilage complex (AECC) and did not penetrate deeper than 2 mm (caput, femur)Figure 2
A: grade 1 osteoarthritic lesions had minor roughening of the
articular-epiphyseal cartilage complex (AECC) and did not
penetrate deeper than 2 mm (caput, femur). B: grade 2
lesions were moderate and penetrated 2-3 mm into the
AECC (lateral trochlea, humerus). C: grade 3 lesions were
severe and penetrated over 3 mm into the AECC (lateral
condyle, tibia). D: grade 4 lesions were osteochondrosis dis-
secans-like lesions (lateral trochlea, femur).
Table 2: Actual composition of diets. The calcium-deficient period is indicated with bold letters.
Group 1 Group 2 Group 3
Duration of diet (mo) 44 3 61 8 162 7
kg DM 8.54 10.65 11.22 8.54 10.65 11.22 10.15 7.48 11.22 10.15
Total amount of ME (MJ) 96.53 120.39 125.89 96.53 120.39 125.89 107.29 83.42 125.89 107.29
ME (MJ/kg DM) 11.35 11.35 11.23 11.35 11.35 11.23 10.53 11.12 11.23 10.53
% of roughage 48.48 50.52 49.56 48.48 50.52 49.56 40.43 53.05 49.56 40.43
% of crude protein 13.66 13.19 11.87 13.66 13.19 11.87 15.64 11.89 11.87 15.64
OIV (g/kg DM) 91.59 86.76 71.25 91.59 86.76 71.25 96.48 71.02 71.25 96.48
Calcium (g/d) 29.89 34.81 52.54 29.89 34.81 52.54 57.43 47.68 52.54 57.43
Phosphorus (g/d) 48.05 54.97 41.85 48.05 54.97 41.85 40.77 34.51 41.85 40.77
Ca/P ratio 0.62 0.63 1.26 0.62 0.63 1.26 1.41 1.38 1.26 1.41
ME = metabolizable energy
DM = dry matter
OIV = protein absorbable in small intestine
Acta Veterinaria Scandinavica 2006, 48:25 />Page 5 of 7
(page number not for citation purposes)
and trochlea ossis femoris (Table 5). When Groups 1 and
2 are compared, the incidence and severity of OA are
higher in Group 2. These animals were calcium-deficient
from the age of 5–12 months.
By studying only the femurs of the bulls, 40% of affected
animals (animal having one or more severe OA lesions in
any location) were detected. By combining the findings of
femurs, tarsi and radii, the sensitivity was 100% (Table 6).
Discussion
The faulty, heavily distorted dietary Ca/P ratio yielded a
severe outbreak of OA in fattening bulls. Over 80% of the
animals with a calcium-deficient diet had at least one
severe OA lesion. However, OA lesions were prevalent
also in animals with balanced diets, 30% of these animals
having lesions.
Active discussion about the lameness of dairy cows and
steering bulls is taking place worldwide. Reports indicate
that as many as 60% of dairy cows show lameness at least
once a year [16]. Lameness is also the third most common
reason for early culling of dairy cows [17]. Steering bulls
that are lame are unable to perform. On a beef farm, a
lame steering bull can be a disaster. All of the above are
reasons for farmers to pay special attention to the health
of their animals. However, lameness in fattening dairy
and meat bulls is often diagnosed at a fairly late stage. In
modern husbandry, animals are kept in bigger groups,
complicating the observation of individual animals.
Lameness is frequently undetected until the animal can
no longer stand or walk. Consistent with a previous report
[5], OA lesions in our study were highly bilateral. Bilateral
lameness is more difficult to detect. Only the most severe
cases of OA tend to result in clearly visible lameness. The
animals in our study were considered sufficiently healthy
to be transported to the slaughterhouse; neither the owner
nor the slaughterhouse veterinarian observed obvious
signs of lameness. Animals were able to walk and put
weight on each leg. However, OA lesions were abundant;
over 80% of the animals with a calcium-deficient diet had
at least one severe OA lesion. Even in the group with a bal-
anced diet (Group 3), 30% of animals had at least one
severe OA lesion. The question then arises that should
Table 4: Bilateralism of osteoarthritic lesions in Groups 2 and 3.
Bone Bilateral lesion Unilateral lesion Bilaterally unaffected
Humerus 6.7 10.0 83.3
Radius 24.1 13.8 62.1
Femur 10.7 28.6 60.7
Tibia 0.0 3.2 96.8
Tarsus 41.9 6.5 51.6
Combined 51.6 16.1 32.3
Table 3: Number of affected bones and the location and grade of lesions.
Number of lesions
Bone Site % (a/n) Grade 1 Grade 2 Grade 3 Grade 4
Scapula
x
cavitas glenoidalis 75 (52/69) 45 7 0 0
Humerus caput humeri 27 (27/99) 25 2 0 0
medial trochlea 40 (40/99) 33 6 0 1
lateral trochlea 8 (8/99) 3 2 0 3
Radius fovea capitis radii 41 (40/97) 23 16 1 0
incisura trochlearis 36 (35/97) 30 4 1 0
Ulna processus anconeus 2 (2/97) 0 0 0 2
processus coronoideus 2 (2/97) 0 0 0 2
Femur caput femur 9 (9/98) 6 1 0 2
trochlea ossis femoris 60 (59/98) 38 13 8 0
medial condyle of trochlea 4 (4/98) 2 0 1 1
lateral condyle of trochlea 4 (4/98) 0 1 0 3
Tibia eminentia intercondylaris 1 (1/101) 0 1 0 0
medial condyle 3 (3/101) 3 0 0 0
lateral condyle 7 (7/101) 4 1 2 0
Tarsus talus 73 (74/101) 37 23 2 12
calcaneus 41 (41/101) 30 4 1 6
a = number of affected bones, n = number of examined bones
x
not available for Group 2
Acta Veterinaria Scandinavica 2006, 48:25 />Page 6 of 7
(page number not for citation purposes)
pathological changes be considered a problem if the ani-
mal is not clinically lame? We believe that even subclini-
cal OA in feedlot animals should be deemed a welfare
problem.
To enhance animal welfare, it would be beneficial if eco-
nomic losses were connected to the issue. How much does
OA affect productivity? In the present case, the economic
losses were obvious. At least six animals were euthanized
or sent to the slaughterhouse earlier than planned due to
acute lameness. Because of differences in net weight gain
per day and in carcass classification on the EUROP.e sys-
tem, animals in Group 3 produced 20% better income
than animals in Group 2 and over 30% more money than
animals in Group 1.
No significant association could be shown between OA
lesions and the growth rate of animals. In Group 2, all ani-
mals had at least one severe OA lesion; thus, no case-con-
trol comparisons could be performed. In addition, Group
3 lacked sufficient cases for a case-control comparison.
However, the overall trend does not rule out the existence
of such a connection.
Predilection sites in bovine OC literature include stifle,
hock, shoulder and elbow joints [5,7,10,18]. In the stifle
joint, OC lesions are typically found in both the medial
and the lateral trochlear ridge of the distal femur, in the
patellar groove and in the medial intercondylar eminence
of the tibia. In the hock joint, lesions have been reported
mainly in the medial and the lateral condyle of the troch-
lea tali distalis, the lateral malleolus of the distal tibia and
the coranoid process of the calcaneus [7]. In the shoulder
joint, lesion sites are the central and dorsocranial areas of
the humeral head and in the glenoidal cavity. In the elbow
joint, lesions are frequently present on the articular sur-
face of the distal radius [8,5]. The predilection sites for OA
evaluated macroscopically in this study are consistent
with previous reports of OC, indicating that many of the
lesions observed here may origin from OC lesions. OA
lesions were mainly found in the cavitas glenoidalis of the
scapula, the head and the medial condyle of the humerus,
Table 5: Morbidity rate of severe osteoarthritic (OA) lesions (grade ≥ 2) in different locations in Groups 1–3.
OA lesion grade ≥ 2
Bone Site Group 1 Group 2 Group 3 Total P-value
Scapula cavitas glenoidalis 17.5 0 10.1 0.017*
Humerus caput humeri 2.6 3.1 0 2 0.648
medial torchlea 2.6 3.1 0 2 0.648
incisura trochlearis 10.5 3.1 0 5.1 0.125
medial trochlea (combined) 13.2 6.3 0 7.1 0.112
lateral trochlea 2.6 12.5 0 5.1 0.058
Radius fovea capitis radii 0 45.2 10.3 17.5 < 0.001***
incisura trochlearis 8.1 9.7 0 6.2 0.247
Ulna processus anconeus 2.7 3.2 0 2.1 0.64
processus coronoideus 0 6.5 0 2.1 0.114
Femur caput femur 0 12.9 0 4.1 0.011*
trochlea ossis femoris 20.5 45.2 0 22.4 < 0.001***
medial condyle of trochlea 2.6 3.2 0 2 0.652
lateral condyle of trochlea 5.1 0 3.6 3.1 0.457
Tibia eminentia intercondylaris 2.6 0 0 1 0.448
medial Condyle 0 0 0 0
lateral Condyle 5.1 3.1 0 3 0.46
Tarsus talus 28.2 71.9 6.7 35.6 < 0.001***
calcaneus 10.3 12.5 6.7 9.9 0.741
Comparison of daily weight gain (mean + SE)Figure 3
Comparison of daily weight gain (mean + SE). Calcium-defi-
cient groups are indicated with shading.
0
100
200
300
400
500
600
700
Group 1
a*
Group 2
a
Group 3
b
Gain (g/d)
* Columns w ith the same letter are not significantly different (p < 0.001).
Publish with BioMed Central and every
scientist can read your work free of charge
"BioMed Central will be the most significant development for
disseminating the results of biomedical research in our lifetime."
Sir Paul Nurse, Cancer Research UK
Your research papers will be:
available free of charge to the entire biomedical community
peer reviewed and published immediately upon acceptance
cited in PubMed and archived on PubMed Central
yours — you keep the copyright
Submit your manuscript here:
/>BioMedcentral
Acta Veterinaria Scandinavica 2006, 48:25 />Page 7 of 7
(page number not for citation purposes)
the incisura trochlearis and the fovea capitis of the radius,
the trochlea of the femur, the os talus and the os cal-
caneus. For a farm-level study, the most practical and con-
venient bone to investigate prevalence of OA and OC in
dairy bulls is the femur.
Our findings suggest that calcium deficiency and mineral
imbalance are predisposing factors for OA (Table 6). The
incidence and severity of OA lesions being higher in
Group 2 indicates that calcium deficiency has a more seri-
ous outcome in the age group 5–12 months than in the
age group 12–18 months. Besides resulting in serious wel-
fare problems, the animal groups with a suboptimal Ca/P
ratio produced 30% less money than animals with an
optimal Ca/P ratio. While diagnosing OA is difficult on
the farm, OA lesions are fairly easy to spot in slaughter-
house material. Lesions in the trochlea of the femur are
particularly easy to identify and measure. To control the
growing problem of OA in feedlot farming, cooperation
between the slaughterhouse and the farmer is essential.
Acknowledgements
The authors thank the staff of the abattoir for excellent cooperation, the
staff of the Faculty of Veterinary Medicine for assistance with practical mat-
ters, Arto Ketola, MSc, for help with statistics and Carol Ann Pelli, HonBSc,
for editing the language of the manuscript.
References
1. Trostle SS, Nicoll RG, Forrest LJ, Markel MD: Clinical and radio-
graphic findings, treatment, and outcome in cattle with oste-
ochondrosis: 29 cases (1986–1996). J Am Vet Med Assoc 1997,
211:1566-1570.
2. Jensen R, Lauerman LH, Park RD, Braddy PM, Horton DP, Flack DE,
Cox MF, Einarson N, Miller GK, Rehfeld CE: Limb arthropaties
and periarticular injuries in feedlot cattle. Cornell Vet 1980,
70:329-343.
3. Ekman S, Carlson CS: The pathophysiology of osteochondrosis.
Vet Clin North Am Small Anim Pract 1998, 1:17-32.
4. White SL, Rowland GN, Whitlock RH: Radiographic, macro-
scopic, and microscopic changes in growth plates of calves
raised on hard flooring. Am J Vet Res 1984, 45:633-639.
5. Trostle SS, Nicoll RG, Forrest LJ, Markel M, Nordlund K: Bovine
osteochondrosis. Compedium on Continuing Education for the Practic-
ing Veterinarian 1998, 20:856-863.
6. Ytrehus B, Grindflek E, Teige J, Stubsjoen E, grondalen T, Carlson CS,
Ekman S: The effect of parentage on the prevalence, severity
and location of lesions of osteochondrosis in swine. J Vet Med
A 2004, 51:188-195.
7. Dutra F, Carlsten J, Ekman S: Hind limb skeletal lesions in 12
month old bulls of beef breeds. Zentralbl Veterinarmed A 1999,
46:489-508.
8. Reiland S, Stromberg B, Olsson SE, Dreimanis I, Olsson IG: Osteo-
chondrosis in growing bulls. Pathology, frequency and sever-
ity on different feedings. Acta Radiol 1978, 358:179-196.
9. Weisbrode SE, Monke DR, Dodaro ST, Hull BL: Osteochondrosis,
degenerative joint disease, and vertebral osteophytosis in
middle-aged bulls. J Am Vet Med Assoc 1982, 181:700-705.
10. Tryon KA, Farrow CS: Osteochondrosis in cattle. Vet Clin North
Am Food Anim Pract 1999, 15:265-274.
11. Davies IH, Munro R: Osteochondrosis in bull beef cattle follow-
ing lack of dietary mineral and vitamin supplementation. Vet
Rec 1999,
145:232-233.
12. ter Wee E, Wierenga HK, Smits AC, Smits MCJ: Claw a leg disor-
ders in cattle in relation to the design and construction of
floors. Zeist, Netherlands: DLO Research Institute for Animal Pro-
duction "Schoonoord"; 1989:15-18. Report B-345
13. Heinola T, Karhula H: Kasvavien lypsykarjasonnien osteokon-
droosi.[Osteochondrosis in growing dairy bulls]. Suom Eläin-
lääkäril 2002, 108:268-272.
14. Hill BD, Sutton RH, Thompson H: Investigation of osteochondro-
sis in grazing beef cattle. Aust Vet J 1998, 76:171-175.
15. Wegener KM, Heje NI: Dyschondroplasia (osteochondrosis) in
articular-epiphyseal cartillage complexes of three calves
from 24 to 103 days of age. Vet Pathol 1992, 29:562-563.
16. Vermunt J: Herd lameness- A review, major causal factors,
and guidelines for prevention and control. Proceedings of the
13th international symposium and 5th conference on lameness in rumi-
nants, Maribor, Slovenia, February 11–15, 2004 :3-18.
17. Dürr JW: Culling in Quebec Holstein herd 2. Study of pheno-
typic trends in reasons for disposal. J Anim Sci 1997, 77:601-608.
18. Scott PR, Rhind S, Brownstein D: Severe osteochondrosis in two
10 month old beef calf. Vet Rec 2000, 147:608-609.
Table 6: Concurrence of lesions in different bones.
Individual bone n* n S (%) SE
Humerus 61 37 18.9 6.4
Radius 60 36 52.8 8.3
Femur 59 37 41.7 8.2
Tibia 62 37 2.7 2.7
Tarsus 62 37 75.7 7.1
Combination of bones
Femur and humerus 58 36 58.3 8.2
Femur and tarsus 59 36 86.1 5.8
Femur and radius 57 35 77.1 7.1
Femur, tarsus and radius 57 35 100 0
Combination of articular surfaces
Trochlea os femur, talus ja fovea capitis radii 57 35 88.6 5.4
n = Number of individual bones/legs, n* = Number of affected animals
(animals with one or more osteoarthritic lesions graded ≥ 2). S =
Sensitivity of examination of individual bones/combination of bones/
combination of articular surfaces. SE = standard error of mean.