Báo cáo khoa học: "Molecular characterisation of the early response in pigs to experimental infection with Actinobacillus pleuropneumoniae using cDNA microarrays" doc
Bạn đang xem bản rút gọn của tài liệu. Xem và tải ngay bản đầy đủ của tài liệu tại đây (384.56 KB, 11 trang )
Acta Veterinaria Scandinavica
BioMed Central
Open Access
Research
Molecular characterisation of the early response in pigs to
experimental infection with Actinobacillus pleuropneumoniae using
cDNA microarrays
Jakob Hedegaard1, Kerstin Skovgaard2, Shila Mortensen2, Peter Sørensen1,
Tim K Jensen2, Henrik Hornshøj1, Christian Bendixen1 and
Peter MH Heegaard*2
Address: 1Department of Genetics and Biotechnology, Faculty of Agricultural Sciences, University of Aarhus, Research Centre Foulum, PO-Box 50,
DK-8830 Tjele, Denmark and 2Department of Veterinary Diagnostics and Research, National Veterinary Institute, Technical University of
Denmark, Bülowsvej 27, DK-1790 Copenhagen, Denmark
Email: Jakob Hedegaard - ; Kerstin Skovgaard - ; Shila Mortensen - ;
Peter Sørensen - ; Tim K Jensen - ; Henrik Hornshøj - ;
Christian Bendixen - ; Peter MH Heegaard* -
* Corresponding author
Published: 27 April 2007
Acta Veterinaria Scandinavica 2007, 49:11
doi:10.1186/1751-0147-49-11
Received: 14 November 2006
Accepted: 27 April 2007
This article is available from: />© 2007 Hedegaard et al; licensee BioMed Central Ltd.
This is an Open Access article distributed under the terms of the Creative Commons Attribution License ( />which permits unrestricted use, distribution, and reproduction in any medium, provided the original work is properly cited.
Abstract
Background: The bacterium Actinobacillus pleuropneumoniae is responsible for porcine pleuropneumonia, a widespread, highly
contagious and often fatal respiratory disease of pigs. The general porcine innate immune response after A. pleuropneumoniae
infection is still not clarified. The objective of this study was hence to characterise the transcriptional response, measured by
using cDNA microarrays, in pigs 24 hours after experimental inoculation with A. pleuropneumoniae.
Methods: Microarray analyses were conducted to reveal genes being differentially expressed in inflamed versus non-inflamed
lung tissue sampled from inoculated animals as well as in liver and tracheobronchial lymph node tissue sampled from three
inoculated animals versus two non-inoculated animals. The lung samples were studied using a porcine cDNA microarray with
5375 unique PCR products while liver tissue and tracheobronchial lymph node tissue were hybridised to an expanded version
of the porcine microarray with 26879 unique PCR products.
Results: A total of 357 genes differed significantly in expression between infected and non-infected lung tissue, 713 genes
differed in expression in liver tissue from infected versus non-infected animals and 130 genes differed in expression in
tracheobronchial lymph node tissue from infected versus non-infected animals. Among these genes, several have previously been
described to be part of a general host response to infections encoding immune response related proteins. In inflamed lung tissue,
genes encoding immune activating proteins and other pro-inflammatory mediators of the innate immune response were found
to be up-regulated. Genes encoding different acute phase reactants were found to be differentially expressed in the liver.
Conclusion: The obtained results are largely in accordance with previous studies of the mammalian immune response.
Furthermore, a number of differentially expressed genes have not previously been associated with infection or are presently
unidentified. Determination of their specific roles during infection may lead to a better understanding of innate immunity in pigs.
Although additional work including more animals is clearly needed to elucidate host response to porcine pleuropneumonia, the
results presented in this study demonstrate three subsets of genes consistently expressed at different levels depending upon
infection status.
Page 1 of 11
(page number not for citation purposes)
Acta Veterinaria Scandinavica 2007, 49:11
Background
Respiratory infectious diseases present a major problem in
modern pig production with severe effects on both animal
welfare and production economy [1]. The Gram negative
bacterium Actinobacillus pleuropneumoniae is an inhabitant
of the upper porcine respiratory tract and is the causative
agent of porcine pleuropneumonia, a frequent respiratory
infection which is highly infectious, often fatal and characterized by necrotizing, hemorrhagic bronchopneumonia and serofibrinous pleuritis [1]. Infection of the
porcine lung with A. pleuropneumoniae has previously
been reported to result in a local production of proinflammatory proteins or mRNA encoding the cytokines interleukin (IL) -1α, IL-1β, IL-6 and the chemokine IL-8 [2-5].
Likewise bioactive protein and/or mRNA coding for IL10,
IL12p35, TNF- α and INF α have been shown to be upregulated after infection with A. pleuropneumoniae in vivo
or in vitro [2-8]. These studies have focused on a few
selected genes using techniques such as quantitative realtime reverse transcriptase polymerase chain reactions (RTPCR), northern blotting or in-situ hybridisation. The
introduction of techniques for simultaneous measurements of gene expression for thousands of genes in a single analysis using microarrays allows a more
comprehensive picture of the host response during infection with A. pleuropneumoniae. Using cDNA microarrays
Moser and co-workers found 307 anonymous transcripts
in blood leukocytes from pigs to be significantly affected
after experimental infection with A. pleuropneumoniae [9].
Even though A. pleuropneumoniae has been extensively
studied and different aspects of its pathogenesis have been
described [1,2,10,11], the role of the porcine innate
immune response after A. pleuropneumoniae infection
remains poorly understood. Therefore, this response was
studied further here using cDNA microarrays. Pigs were
experimentally inoculated with A. pleuropneumoniae and
microarray analyses were conducted on inflamed versus
non-inflamed lung tissue from inoculated animals and on
liver tissue and tracheobronchial lymph node tissue from
challenged versus non-challenged pigs.
Methods
Animals, bacterial inoculation and samples
Six 10 – 12-week-old castrates of Danish Landrace/Yorkshire/Duroc crosses from a high health herd free from A.
pleuropneumoniae were used in the experiment. The Danish Animal Experiments Inspectorate approved all animal
procedures. Two non-inoculated animals (pigs 1 and 2)
were sacrificed by means of captive bolt pistol followed by
pitching and exsanguination. The animals were necropsied immediately and samples (500 mg) were taken from
/>
liver tissue and tracheobronchial lymph nodes. To investigate the effect on host responses and on the development of pathological signs of different levels of exposure
to A. pleuropneumoniae, pigs were infected with two different doses of the same isolate. Two pigs (pigs 4 and 6) were
inoculated in each nostril with 1 mL of a McFarland 0.5
suspension mixed 1:1 with Brain Heart Infusion Broth
(BHI) + 0.5% NAD containing approximately 9.6 × 10⁶
colony forming units (cfu)/mL of A. pleuropneumoniae
serotype 5B, isolate L20 [12] and two (pigs 3 and 5) were
inoculated in each nostril with 1 mL of a McFarland 0.5
suspension mixed 1:1 with BHI + 0.5% NAD containing
approximately 3.8 × 10⁷ cfu/mL of the same A. pleuropneumoniae isolate. The inoculated animals were sacrificed 24
hours after inoculation by means of captive bolt pistol followed by pitching and exsanguination. The animals were
necropsied immediately and samples (500 mg) were
taken from liver tissue, tracheobronchial lymph nodes
and from both inflamed and non-inflamed lung tissue.
Samples of non-inflamed lung tissue were taken as far as
possible away from inflamed tissue. All samples were
instantly frozen in liquid nitrogen and stored at -80°C
until use. After necropsy, samples from lung, liver, tonsils
and spleen were cultivated on PPLO agar (Difco, Detroit,
MI, USA) to re-isolate the inoculation strain, which was
serotyped using latex agglutination [13].
Microarrays
Two-colour microarray analyses were conducted to identify genes being significantly differentially expressed in
non-inflamed lung tissue relative to inflamed lung tissue
sampled from the same animal, liver tissue from noninoculated animals relative to liver tissue from inoculated
animals and tracheobronchial lymph node tissue from
non-inoculated animals relative to similar lymphoid tissue from inoculated animals. The microarray analyses
were conducted as a common reference design in tissuetype batches. The samples of lung tissue were studied by
manual hybridisation to the pig array DIAS_PIG_27K2
that contain 5375 PCR products amplified from unique
cDNA clones. Samples of liver and lymph node tissues
were hybridised to the pig array DIAS_PIG_55K2 (26879
PCR products) using a Discovery XT hybridisation station
(Ventana Discovery Systems, Illkirch CEDEX, France). The
cDNA clones used for both microarrays were selected
from the cDNA libraries generated by the Sino-Danish Pig
Genome Sequencing Consortium [14]. Total-RNA was
purified and DNase treated using RNeasy Maxi Kit (Qiagen, Ballerup, Denmark) and aminoallyl-cDNA (aacDNA) was synthesized from 10 – 20 μg of total-RNA
using the Superscript Indirect cDNA Labeling System (Invitrogen, Taastrup, Denmark). The obtained aa-cDNA was
labelled using the ARES cDNA labelling kit (Molecular
Probes/Invitrogen, Taastrup, Denmark). The reference
sample was labelled with Alexa 488 and each individual
Page 2 of 11
(page number not for citation purposes)
Acta Veterinaria Scandinavica 2007, 49:11
sample was labelled with Alexa 594. The labelled reference samples were mixed and divided into aliquots before
combining with the labelled samples. The slides were
scanned and analyzed using the histogram method with
default settings in a ScanArray Express HT system (version
3.0, Perkin Elmer, Hvidovre, Denmark). Statistical analysis was carried out in the R computing environment (version 2.3.0 for Windows) using the package Linear Models
for Microarray Analysis (Limma, version 2.4.11, [15])
which is part of the Bioconductor project [16]. The log2transformed ratios of Alexa-594 to Alexa-488 (not background corrected) were normalized within-slide using
printtip-loess with default parameters. The set of normalized log-ratios were then analyzed in Limma to identify
genes being significantly differentially expressed. The false
discovery rate was controlled using the method of Benjamini and Hochberg [17] as implemented in Limma and
a corrected P-value below 0.05 was considered significant.
Spotfire DecisionSite (ver. 8.1, Spotfire, Somerville, MA,
USA) was used for two-way hierarchical cluster analyses of
the significantly differentially expressed genes represented
by the mean log-ratios of the replicated spots (clustering
method: complete linkage; similarity measure: Pearson
product momentum correlation; ordering function: average value). The features of the arrays were mapped to a
LocusLink identifier and an annotation package was built
using the Bioconductor package AnnBuilder (version
1.9.14). A test for significantly (P < 0.05) overrepresentation of gene ontology (GO) terms among both induced
and repressed genes was conducted using the GOHyperG
function of the Bioconductor package GOstats (ver 1.5.5)
with a threshold of minimum five genes annotated at each
node. More detailed descriptions of the microarray experiments are available at the NCBIs Gene Expression Omnibus [18-20] through the GEO series accession number
GSE4577.
Results
Necropsy findings
One pig (no. 6) died within 24 hours and by necropsy the
lungs were severely affected by acute, multifocal, fibrinonecrotizing and hemorrhagic pneumonia complicated
with acute diffuse fibrinous pleuritis. The tracheobronchial lymph nodes appeared enlarged and congested. No
samples were taken from this animal due to autolysis. As
intended, the three remaining inoculated pigs were sacrificed 24 hours after challenge and necropsied immediately. The three pigs revealed characteristic, localised, lung
and pleural lesions of variable severity consistent with
acute pleuropneumonia (fibrino-necrotizing pneumonia)
whereas the surrounding lung tissue appeared normal.
The corresponding lymph nodes of the affected lungs
were enlarged and congested. The lesions in pig 4 were
multifocal and up to 4 × 5 cm while the lesions in pig 3
were lobar involving most of the right diaphragmatic
/>
lobe. Pig 5 was the less affected animal with only one
small (1 × 1 cm) focus of pleuropneumonia. No association was observed between inoculated dose and the severity of pathological changes and the three inoculated
animals were consequently considered as one group during analyses. The inoculation strain, A. pleuropneumoniae
serotype 5B, isolate L20, was re-isolated from lung tissue
of all infected animals.
Microarray profiling
Microarray analyses revealed that the experimental infection induced significant changes in the expression profiles
measured in the lung, liver and tracheobronchial lymph
node. A total of 357 genes (162 genes repressed and 195
genes induced) were found to be significantly differentially expressed in non-inflamed relative to inflamed lung
tissue of experimentally infected pigs. The largest number
of significantly differentially expressed genes was found in
the liver where 713 genes were affected (382 repressed
and 331 induced). In lymph node tissue, 130 genes were
significantly differentially expressed with 59 genes being
repressed and 71 genes being induced by the infection. It
must be stressed that the lung samples were studied using
a microarray with fewer genes represented compared to
the microarray used for studying the liver and lymph node
tissues. The lists of significantly differentially expressed
genes can be found in additional file 1
"Differentially_expressed_genes". To further elucidate the
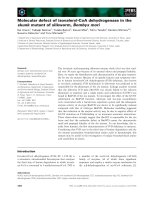
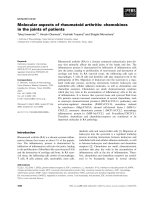
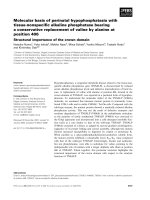
effects of infection on the expression profiles in the examined tissues, two-way hierarchical clustering was applied
to the mean log-ratio of the replicated spots from the significantly differentially expressed genes (Figures 1, 2, 3).
As expected, the clustering revealed a clear separation of
the expression profiles of the samples into two groups –
one group containing profiles from inoculated animals/
inflamed tissues and one group containing profiles from
the non-inoculated animals/non-inflamed tissues.
Expression profiles from pig 5 were seen to cluster more
distantly to the profiles from pig 3 and pig 4 in all profile
dendrograms of inflamed tissues/inoculated animals.
Interestingly, pig 5 was the less affected animal among the
inoculated animals. This indicates that the expression profiles may be associated with the severity of pathological
changes. The structure of the dendrograms of noninflamed and inflamed lung tissues (Figure 1) were found
to be identical as pig 5 cluster more distantly to pig 3 and
pig 4 in both. This indicates that the expression profile of
non-inflamed lung tissue may be affected by the local
inflammation in a distant region of the lung. Lung tissue
sampled from non-inoculated pigs could hence be
included in future experiments serving as an additional
sample of non-inflamed tissue. The expression profiles of
the genes clustered into two major groups of induces and
repressed genes with several distinct sub clusters. The profiles of different cDNA fragments representing the same
Page 3 of 11
(page number not for citation purposes)
Acta Veterinaria Scandinavica 2007, 49:11
gene were generally observed to cluster together. The
affected genes were furthermore tested for significantly
overrepresentation of GO terms among both induced and
repressed genes as presented below (Figures 4 and 5).
Non-inflamed relative to inflamed lung tissue from
inoculated animals
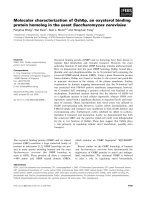
The results of the test for overrepresentation of specific
GO terms among the 357 affected genes in lung tissue can
be seen in Figure 4. As expected, terms related to the
immune response such as "response to stimulus",
"response to stress", "cell-cell signalling", "regulation of
programmed cell death" and "regulation of apoptosis"
were found to be overrepresented among the induced
genes. Furthermore, a number of terms related to metabolism were also found to be affected.
Several of the genes observed to be induced in this study
have previously been described to be induced by infection
including those encoding IL-6 and IL-6 signal transducer
(IL6ST), alveolar macrophage-derived chemotactic factorI (AMCF-I) which is the porcine homologue of human IL8 [21], IL-8 receptor beta (IL8RB), chemokine-like factor
super family 8 (CKLFSF8), IL-11 receptor alpha (IL11RA),
suppressor of cytokine signalling 3 (SOCS3), cytokine
inducible SH2-containing protein (CISH) transcript variant 2 and complement component 3 (C3). The expression
of many pro apoptotic as well as anti-apoptotic genes
(encoding BCL2L1, GAS1, P21, BID, TIAL1 and PIAP) was
also found to be induced in the inflamed lung tissue characterised by necrotic areas. The group of repressed genes
was found to comprise those encoding members of the
major histocompatibility complex (HLA-DRA, HLADQA1), numerous ribosomal proteins (L10 (RPL10); L11
(RPL11); L14 (RPL14); L17 (RPL17); L18 (RPL18); L19
(RPL19); L21 (RPL21); L23 (RPL23); L26 (RPL26); L27
(RPL27); L29 (RPL29); L30 (RPL30); L35 (RPL35); L37
(RPL37); S3 (RPS3); S4 X-linked (RPS4X); S7 (RPS7); S11
(RPS11); S12 (RPS12); S16 (RPS16); S19 (RPS19); S24
(RPS24); S26 (RPS26)), complement component 5 (C5),
IL-1 receptor-associated kinase (IRAK1) and surfactant
pulmonary-associated protein C (SFTPC). Cirera and coworkers have previously found the expression of SFTPC to
be repressed in porcine lungs with necrotic areas [22].
Liver from non-inoculated relative to inoculated animals
The test for overrepresentation of specific GO terms
among the 713 genes affected by infection (Figure 5)
revealed that terms related to the immune response such
as "response to stimulus", "response to stress", "response
to biotic stimulus", "defense response", "immune
response", "response to wounding" and "acute phase
response" were overrepresented among the induced
genes.
/>
As expected due to the presence of bacteria, tissue damage
in the lung and host expression of IL-6, the transcripts of
the following acute phase proteins were found to be accumulated in liver samples from inoculated animals: serum
amyloid A1 (SAA1, transcript variant 1 and 2); serum
amyloid A2 (SAA2) and A3 (SAA3); serum amyloid P
component (APCS); alpha-2-macroglobolin (A2M); Creactive protein (CRP); fibrinogen (FGA, FGB, FGG);
phospholipase A2, group IVA (PLA2G4A); alpha-1-antichymotrypsin 2 (SERPINA3-2); haptoglobin (HP) and
ceruloplasmin (CP). Expression of several acute phase
proteins were decreased in liver samples from inoculated
animals relative to non-inoculated animals including
albumin (ALB), transthyretin (prealbumin, TTR), alpha-2HS-glycoprotein (AHSG) and apo-lipoproteins (ApoC3,
ApoA1, APOH). A number of these up and down regulated liver genes were validated by quantitative RT-PCR
verifying these changes (data not shown, work in
progress).
Tracheobronchial lymph nodes from non-inoculated
relative to inoculated animals
Even though 130 genes were found to be significantly differentially expressed in lung lymph node tissue from noninoculated relative to inoculated animals, very few of
them seem to be involved in immune response. The genes
were analysed for significantly overrepresented GO terms,
but the number of representative genes for each significantly overrepresented GO term was below the threshold
for acceptance.
Discussion
Transcriptional profiling using DNA microarray technology has been extensively used for studying host response
to pathogenic microorganisms [23,24]. Moser and coworkers [9] studied the gene expression in porcine peripheral blood leukocytes as a response to infection by A. pleuropneumoniae using cDNA microarrays. A total of 18 pigs
were experimentally infected with A. pleuropneumoniae
and based on principal components analyses of seven
mainly phenotypic key performance measurements, two
extreme-performing animals were selected and analyzed
further using cDNA microarrays. Analysis of the gene
expression change from 0 to 24 hours post-challenge
revealed 307 anonymous genes to be significantly
affected. The results presented here are in agreement with
this as numerous genes were found to be significantly differentially expressed in liver, lung and tracheobronchial
lymph nodes depending on infection status.
A relative low number of genes were found to be differentially expressed in the tracheobronchial lymph nodes.
This might reflect the complexity of this type of tissue
compared to lung and liver tissues. Expression analysis of
lymph nodes containing a variety of cell populations may
Page 4 of 11
(page number not for citation purposes)
Acta Veterinaria Scandinavica 2007, 49:11
1
3
8
/>
357
-1
1
SFTPC
C5
HLA-DQA1
HLA-DRA
IRAK1
CKLFSF8
C3
IL8RB
SOCS3
P21
CISH
TIAL1
IL6
BCL2L1
IL11RA
GAS1
IL6ST
AMCF-1
PIAP
BID
5
-2
downregulation
0
2
4
non-inflamed
3
4
3
5
inflamed
upregulation
Figure 1
Two-way hierarchical cluster analyses of the 357 genes affected by infection in lung tissue
Two-way hierarchical cluster analyses of the 357 genes affected by infection in lung tissue. Gene expression is
shown as a matrix with rows representing profiles of genes and columns representing profiles of samples. The gene dendrogram is shown to the left of the matrix and the dendrogram of the samples is shown above the matrix. Gene expression is represented by colour, with blue indicating relative up regulation and yellow indicating relative down regulation. The abbreviated
gene names for selected genes are indicated to the right of the expression matrix. Numbers above the gene dendrogram represents cluster count and similarity. Text below the expression matrix represents pig number and class.
Page 5 of 11
(page number not for citation purposes)
Acta Veterinaria Scandinavica 2007, 49:11
1 4 9
/>
71 3
-1
1
ApoA1
ALB
AHSG
TTR
ApoC3
ApoH
ApoC3
APCS
FGA-aE
FGB, FGG
SAA1-3
SERPINA3-2
A2M
FGB
FGA-a
PLA2G4A
CP
APCS
CRP
1
-2
downregulation
0
2
2 non-inoculated
5
4
3
inoculated
upregulation
Figure 2 hierarchical cluster analyses of the 713 genes affected in liver tissue by infection
Two-way
Two-way hierarchical cluster analyses of the 713 genes affected in liver tissue by infection. Gene expression is
shown as a matrix with rows representing profiles of genes and columns representing profiles of samples. The gene dendrogram is shown to the left of the matrix and the dendrogram of the samples is shown above the matrix. Gene expression is represented by colour, with blue indicating relative up regulation and yellow indicating relative down regulation. The abbreviated
gene names for selected genes are indicated to the right of the expression matrix. Numbers above the gene dendrogram represents cluster count and similarity. Text below the expression matrix represents pig number and class.
Page 6 of 11
(page number not for citation purposes)
Acta Veterinaria Scandinavica 2007, 49:11
1 2 5
/>
1 30
-1
1
1
-1.5
0
2
1.5 not inoculated
5
3
4
inoculated
downupregulation regulation
Figure 3
Two-way hierarchical cluster analyses of the 130 genes affected in tracheobronchial lymph node tissue
Two-way hierarchical cluster analyses of the 130 genes affected in tracheobronchial lymph node tissue. Gene
expression is shown as a matrix with rows representing profiles of genes and columns representing profiles of samples. The
gene dendrogram is shown to the left of the matrix and the dendrogram of the samples is shown above the matrix. Gene
expression is represented by colour, with blue indicating relative up regulation and yellow indicating relative down regulation.
Numbers above the gene dendrogram represents cluster count and similarity. Text below the expression matrix represents
pig number and class.
Page 7 of 11
(page number not for citation purposes)
Acta Veterinaria Scandinavica 2007, 49:11
GO-term (Biological process)
macromolecule metabolism
cellular macromolecule metabolism
cellular protein metabolism
protein metabolism
biosynthesis
cellular biosynthesis
protein biosynthesis
macromolecule biosynthesis
development
response to stimulus
response to stress
morphogenesis
organ development
organogenesis
negative regulation of biological process
carbohydrate metabolism
negative regulation of cellular process
cellular carbohydrate metabolism
DNA metabolism
alcohol metabolism
cell-cell signaling
regulation of programmed cell death
neurogenesis
hexose metabolism
monosaccharide metabolism
regulation of apoptosis
vesicle-mediated transport
glucose metabolism
main pathways of carbohydrate metabolism
secretion
neurophysiological process
energy derivation by oxidation of organic
secretory pathway
cellular carbohydrate catabolism
carbohydrate catabolism
negative regulation of cell proliferation
glycolysis
response to unfolded protein
glucose catabolism
hexose catabolism
monosaccharide catabolism
alcohol catabolism
/>
0
Number of genes in node
10
20
30
40
Repressed
50
Induced
Figure 4
Overrepresented GO-terms (Biological process only) among the 357 genes affected by infection in lung tissue
Overrepresented GO-terms (Biological process only) among the 357 genes affected by infection in lung tissue.
The lengths of the bars represent the number of genes in each node. Repressed GO-terms are marked with yellow and
induced terms by blue. Detailed descriptions of the GO terms can be found at the homepage of the Gene Ontology project
[36].
Page 8 of 11
(page number not for citation purposes)
Acta Veterinaria Scandinavica 2007, 49:11
/>
GO-term (Biological process)
physiological process
negative regulation of physiological process
negative regulation of cellular process
negative regulation of biological process
negative regulation of cellular physiological process
generation of precursor metabolites and energy
alcohol metabolism
response to abiotic stimulus
response to chemical substance
secretion
secretory pathway
xenobiotic metabolism
response to xenobiotic stimulus
Golgi vesicle transport
monosaccharide metabolism
skeletal development
homeostasis
negative regulation of progression through cell
histogenesis
lipid catabolism
response to stimulus
response to stress
response to biotic stimulus
defense response
immune response
cation transport
response to wounding
enzyme linked receptor protein signaling pathway
acute-phase response
Number of genes in node
0
10
20
30
155
Repressed
Induced
Figure 5
Overrepresented GO-terms (Biological process only) among the 713 genes affected in liver tissue by infection
Overrepresented GO-terms (Biological process only) among the 713 genes affected in liver tissue by infection.
The lengths of the bars represent the number of genes in each node. Repressed GO-terms are marked with yellow and
induced terms by blue. Detailed descriptions of the GO terms can be found at the homepage of the Gene Ontology project
[36].
lead to a dilution of the expression profile from the individual cell types. Likewise, Wurmbach and co-workers
[25] found that distinguishing regulated genes from background became increasingly difficult as tissue complexity
increased.
Several innate cytokines were found to be induced in
inflamed areas of lung tissue from challenged animals.
Significant increase of IL8 and IL6 mRNA after infection
with A. pleuropneumoniae has previously been observed in
lung lavage as well as lung tissue by northern blotting and
in situ hybridisation [3,26]. SOCS3 and CISH both found
to be up-regulated in the present study are members of the
suppressor of cytokine signalling (SOCS) family of proteins whose members regulates protein turnover by targeting proteins for degradation [27]. The expression of the
members of the SOCS family is induced by cytokines such
as IL-6 and IL-10, both found to be up-regulated in this
study, and function as negative feed back regulators of
cytokine signalling [27,28]. The significantly increase in
Page 9 of 11
(page number not for citation purposes)
Acta Veterinaria Scandinavica 2007, 49:11
mRNA coding for the anti-inflammatory cytokine IL-10,
found in inflamed areas of the lung, is probably due to the
function of IL-10 in counteracting the host mediated tissue damage caused by proinflammatory and chemotactic
cytokines [29]. The lower expression of the genes encoding ribosomal proteins could be due to a general downregulation of ribosomal biogenesis in the necrotic areas of
the lung. Previously studies have shown that 41 of 54
genes encoding ribosomal proteins were down-regulated
in Pseudomonas aeruginosa after treatment with H2O2
inducing oxidative stress [30]. A future comparison of the
expression profiles in non-inflamed lung tissue sampled
from inoculated animals and lung tissue sampled from
non-inoculated pigs would test this hypothesis of a lower
ribosomal biogenesis in necrotic areas of the lung.
Findings of positive as well as negative regulation of acute
phase proteins after infection with A. pleuropneumoniae
seen in this study have previously been reported [31].
Serum levels of HP, CRP, and SAA increased significantly
in pigs after aerosol inoculation with the same A. pleuropneumoniae serotype used in the present study [31].
Increased serum levels of IL-6, HP and SAA were also
proven to be useful inflammatory markers for A. pleuropneumoniae infection in pigs [32,33]. Carpintero and coworkers found a decreased levels of ApoA1 in pig sera after
2–4 days of infection with A. pleuropneumoniae or Streptococcus suis [34]. Other affected genes known to be downregulated during inflammation are members of the cytochrome P450 family (CYP2E1; CYP3A29) [35].
/>
Competing interests
The author(s) declare that they have no competing interests.
Authors' contributions
KS and JH contributed equally to the work and should be
considered as joint first authors. JH designed and carried
out the microarray analyses, conducted the statistical
analysis, participated in the biological interpretation and
drafted the manuscript. KS designed and carried out the
experimental infections, carried out the microarray analyses, participated in the biological interpretation and in
drafting the manuscript. SM carried out the experimental
infections and participated in the microarray analyses. PS
and HH participated in the statistical analyses. TKJ carried
out the experimental infections. CB participated in drafting the manuscript. PMHH participated in the biological
interpretation and in drafting the manuscript. All authors
read and approved the final manuscript.
Additional material
Additional file 1
Differentially_expressed_genes. The file
"Differentially_expressed_genes.xls" is a Microsoft Excel file and contains
the worksheets "lung_uinf-inf_de-genes", "lymph_node_cont-inf_degenes" and "liver_cont-inf_de-genes". Each worksheet contain the genes
found to be significantly (fdr adjusted P-value < 0.05) differentially
expressed.
Click here for file
[ />
Conclusion
The gene expression response was characterised in pigs
challenged with the respiratory tract pathogen A. pleuropneumoniae. Although additional work including more animals is clearly needed to study the host response to this
infection, the obtained results demonstrate three subsets
of genes consistently expressed at different levels depending upon infection status. Two-way cluster analysis of
these subsets indicated that the expression profiles of the
samples may be associated with the severity of pathological changes. In inflamed lung tissue, immune activating
genes and other pro-inflammatory mediators of the
innate immune response were found up-regulated. In the
liver of infected animals, genes that are well known to be
regulated as part of the acute phase response were found
to be differentially expressed. A number of genes identified in this study to be affected by infection have not previously been associated with infection or are presently
unidentified. Determination of their specific roles during
infection may lead to a better understanding of innate
immunity in pigs.
Acknowledgements
The authors wish to acknowledge the excellent technical support of Karin
Tarp Poulsen and Helle Jensen. This study was supported in parts by grants
from The Danish Research Council (23-03-0077) and from the National
Committee for Pig Production, Danish Slaughterhouses.
References
1.
2.
3.
4.
5.
Taylor DJ: Actinobacillus pleuropneumoniae. In Diseases of
swine Volume 26. 8th edition. Edited by: Straw BE, D´Allaire S, Mengeling WL and Taylor DJ. Ames, Iowa, Iowa State University Press;
1999:343-354.
Baarsch MJ, Foss DL, Murtaugh MP: Pathophysiologic correlates
of acute porcine pleuropneumonia. Am J Vet Res 2000,
61:684-690.
Baarsch MJ, Scamurra RW, Burger K, Foss DL, Maheswaran SK, Murtaugh MP: Inflammatory cytokine expression in swine experimentally infected with Actinobacillus pleuropneumoniae.
Infect Immun 1995, 63:3587-3594.
Choi C, Kwon D, Min K, Chae C: In-situ hybridization for the
detection of inflammatory cytokines (IL-1, TNF-alpha and
IL-6) in pigs naturally infected with Actinobacillus pleuropneumoniae. J Comp Pathol 1999, 121:349-356.
Huang H, Potter AA, Campos M, Leighton FA, Willson PJ, Haines DM,
Yates WD: Pathogenesis of porcine Actinobacillus pleuropneumonia, part II: roles of proinflammatory cytokines. Can J
Vet Res 1999, 63:69-78.
Page 10 of 11
(page number not for citation purposes)
Acta Veterinaria Scandinavica 2007, 49:11
6.
7.
8.
9.
10.
11.
12.
13.
14.
15.
16.
17.
18.
19.
20.
21.
22.
23.
24.
25.
Wattrang E, Wallgren P, Fossum C: Actinobacillus pleuropneumonia serotype 2--effects on the interferon-alpha production of porcine leukocytes in vivo and in vitro. Comp Immunol
Microbiol Infect Dis 1998, 21:135-154.
Cho WS, Jung K, Kim J, Ha Y, Chae C: Expression of mRNA
encoding interleukin (IL)-10, IL-12p35 and IL-12p40 in lungs
from pigs experimentally infected with Actinobacillus pleuropneumoniae. Vet Res Commun 2005, 29:111-122.
Cho WS, Chae C: Expression of nitric oxide synthase 2 and
tumor necrosis factor alpha in swine naturally infected with
Actinobacillus pleuropneumoniae. Vet Pathol 2002, 39:27-32.
Moser RJ, Reverter A, Kerr CA, Beh KJ, Lehnert SA: A mixedmodel approach for the analysis of cDNA microarray gene
expression data from extreme-performing pigs after infection with Actinobacillus pleuropneumoniae. J Anim Sci 2004,
82:1261-1271.
Bosse JT, Janson H, Sheehan BJ, Beddek AJ, Rycroft AN, Simon KJ,
Langford PR: Actinobacillus pleuropneumoniae: pathobiology
and pathogenesis of infection. Microbes Infect 2002, 4:225-235.
Sheehan BJ, Bosse JT, Beddek AJ, Rycroft AN, Kroll JS, Langford PR:
Identification of Actinobacillus pleuropneumoniae genes
important for survival during infection in its natural host.
Infect Immun 2003, 71:3960-3970.
Gunnarsson A, Biberstein EL, Hurvell B: Serologic studies on porcine strains of Haemophilus parahaemolyticus (pleuropneumoniae): agglutination reactions.
Am J Vet Res 1977,
38:1111-1114.
Giese SB, Stenbaek E, Nielsen R: Identification of Actinobacillus
pleuropneumoniae serotype 2 by monoclonal or polyclonal
antibodies in latex agglutination tests. Acta Vet Scand 1993,
34:223-225.
Gorodkin J, Cirera S, Hedegaard J, Gilchrist MJ, Panitz F, Jorgensen
CB, Scheibye-Knudsen K, Arvin T, Lumholdt S, Sawera M, Green T,
Nielsen BJ, Havgaard JH, Rosenkilde C, Wang J, Li H, Li R, Liu B, Hu
S, Dong W, Li W, Yu J, Wang J, Staerfeltd HH, Wernersson R, Madsen
LB, Thomsen B, Hornshoj H, Bujie Z, Wang X, Wang X, Bolund L,
Brunak S, Yang H, Bendixen C, Fredholm M: Porcine transcriptome analysis based on 97 non-normalized cDNA libraries
and assembly of 1,021,891 ESTs. Genome Biol 2007, 8:R45.
Smyth GK: Linear Models and Empirical Bayes Methods for
Assessing Differential Expression in Microarray Experiments. Stat Appl Genet Mol Biol 2004, 3(1):3
[ />Gentleman RC, Carey VJ, Bates DM, Bolstad B, Dettling M, Dudoit S,
Ellis B, Gautier L, Ge Y, Gentry J, Hornik K, Hothorn T, Huber W,
Iacus S, Irizarry R, Leisch F, Li C, Maechler M, Rossini AJ, Sawitzki G,
Smith C, Smyth G, Tierney L, Yang JY, Zhang J: Bioconductor: open
software development for computational biology and bioinformatics. Genome Biol 2004, 5:R80.
Benjamini Y, Hochberg Y: Controlling the False Discovery Rate
- A Practical and Powerful Approach to Multiple Testing. J R
Stat Soc Ser B Methodol 1995, 57:289-300.
Gene Expression Omnibus 2006 [ />Barrett T, Suzek TO, Troup DB, Wilhite SE, Ngau WC, Ledoux P,
Rudnev D, Lash AE, Fujibuchi W, Edgar R: NCBI GEO: mining millions of expression profiles - database and tools. Nucleic Acids
Res 2005, 33:D562-D566.
Edgar R, Domrachev M, Lash AE: Gene Expression Omnibus:
NCBI gene expression and hybridization array data repository. Nucleic Acids Res 2002, 30:207-210.
Goodman RB, Foster DC, Mathewes SL, Osborn SG, Kuijper JL, Forstrom JW, Martin TR: Molecular-Cloning of Porcine Alveolar
Macrophage-Derived Neutrophil Chemotactic Factor-I and
Factor-Ii - Identification of Porcine Il-8 and Another Intercrine-Alpha Protein. Biochemistry 1992, 31:10483-10490.
Cirera S, Nygard AB, Jensen HE, Skovgaard K, Boye M, Fredholm M:
Molecular characterization of the porcine surfactant, pulmonary-associated protein C gene. Genomics 2006, 88:659-668.
Cummings CA, Relman DA: Using DNA microarrays to study
host-microbe interactions. Emerg Infect Dis 2000, 6:513-525.
Campbell CJ, Ghazal P: Molecular signatures for diagnosis of
infection: application of microarray technology. J Appl Microbiol 2004, 96:18-23.
Wurmbach E, Gonzalez-Maeso J, Yuen T, Ebersole BJ, Mastaitis JW,
Mobbs CV, Sealfon SC: Validated genomic approach to study
/>
26.
27.
28.
29.
30.
31.
32.
33.
34.
35.
36.
differentially expressed genes in complex tissues. Neurochem
Res 2002, 27:1027-1033.
Myers MJ, Baarsch MJ, Murtaugh MP: Effects of pentoxifylline on
inflammatory cytokine expression and acute pleuropneumonia in swine. Immunobiology 2002, 205:17-34.
Kile BT, Schulman BA, Alexander WS, Nicola NA, Martin HME,
Hilton DJ: The SOCS box: a tale of destruction and degradation. Trends Biochem Sci 2002, 27:235-241.
Krebs DL, Hilton DJ: SOCS proteins: Negative regulators of
cytokine signaling. Stem Cells 2001, 19:378-387.
Morrison DF, Foss DL, Murtaugh MP: Interleukin-10 gene therapy-mediated amelioration of bacterial pneumonia. Infect
Immun 2000, 68:4752-4758.
Palma M, DeLuca D, Worgall S, Quadri LEN: Transcriptome analysis of the response of Pseudomonas aeruginosa to hydrogen
peroxide. J Bacteriol 2004, 186:248-252.
Heegaard PM, Klausen J, Nielsen JP, Gonzalez-Ramon N, Pineiro M,
Lampreave F, Alava MA: The porcine acute phase response to
infection with Actinobacillus pleuropneumoniae. Haptoglobin, C-reactive protein, major acute phase protein and
serum amyloid A protein are sensitive indicators of infection. Comp Biochem Physiol B Biochem Mol Biol 1998, 119:365-373.
Hulten C, Johansson E, Fossum C, Wallgren P: Interleukin 6,
serum amyloid A and haptoglobin as markers of treatment
efficacy in pigs experimentally infected with Actinobacillus
pleuropneumoniae. Vet Microbiol 2003, 95:75-89.
Lauritzen B, Lykkesfeldt J, Skaanild MT, Angen O, Nielsen JP, Friis C:
Putative biomarkers for evaluating antibiotic treatment: an
experimental model of porcine Actinobacillus pleuropneumoniae infection. Res Vet Sci 2003, 74:261-270.
Carpintero R, Pineiro M, Andres M, Iturralde M, Alava MA, Heegaard
PMH, Jobert JL, Madec F, Lampreave F: The concentration of apolipoprotein A-I decreases during experimentally induced
acute-phase processes in pigs. Infect Immun 2005, 73:3184-3187.
Jover R, Bort R, Gomez-Lechon MJ, Castell JV: Down-regulation of
human CYP3A4 by the inflammatory signal interleukin 6:
molecular mechanism and transcription factors involved.
Faseb Journal 2002, 16:1799-1801.
The Gene Ontology project 2007 [ />index.shtml].
Publish with Bio Med Central and every
scientist can read your work free of charge
"BioMed Central will be the most significant development for
disseminating the results of biomedical researc h in our lifetime."
Sir Paul Nurse, Cancer Research UK
Your research papers will be:
available free of charge to the entire biomedical community
peer reviewed and published immediately upon acceptance
cited in PubMed and archived on PubMed Central
yours — you keep the copyright
BioMedcentral
Submit your manuscript here:
/>
Page 11 of 11
(page number not for citation purposes)