Báo cáo khoa học: " Is there a special mechanism behind the changes in somatic cell and polymorphonuclear leukocyte counts, and composition of milk after a single prolonged milking interval in cows" pptx
Bạn đang xem bản rút gọn của tài liệu. Xem và tải ngay bản đầy đủ của tài liệu tại đây (499.57 KB, 10 trang )
BioMed Central
Page 1 of 10
(page number not for citation purposes)
Acta Veterinaria Scandinavica
Open Access
Research
Is there a special mechanism behind the changes in somatic cell and
polymorphonuclear leukocyte counts, and composition of milk after
a single prolonged milking interval in cows?
Branislav Lakic*
1
, Ewa Wredle
2
, Kerstin Svennersten-Sjaunja
2
and
Karin Östensson
1
Address:
1
Department of Clinical Sciences, Division of Reproduction, Faculty of Veterinary Medicine and Animal Science, Swedish University of
Agricultural Sciences, PO Box 7054, SE-750 07 Uppsala, Sweden and
2
Department of Animal Nutrition and Management, Swedish University of
Agricultural Sciences (SLU), Uppsala, Sweden
Email: Branislav Lakic* - ; Ewa Wredle - ; Kerstin Svennersten-
Sjaunja - ; Karin Östensson -
* Corresponding author
Abstract
Background: A single prolonged milking interval (PMI) e.g. after a technical stop in an automated
milking system is of concern for the producer since it is associated with a short-lasting increase in
milk somatic cell count (SCC), which is a major quality criterion used at the dairy plants. The
content of polymorphonuclear leukocytes (PMN) and how the milk quality is influenced has not
been much investigated. The SCC peak occurs without any obvious antigen challenge, possibly
indicating a different leukocyte attraction mechanism after a PMI than we see during mastitis.
Methods: Composite cow milk samples were taken at the milkings twice daily during 7 days before
and 5 days after a PMI of 24 h. Milk was analyzed for SCC, PMN, fat, protein and lactose, and at
some occasions also casein and free fatty acids (FFA).
Results: During the PMI the proportion of milk PMN increased sharply in spite of marginally
increased SCC. The peak SCC was not observed until the second milking after the PMI, in the
afternoon day 1. However, the peak SCC value in morning milk did not occur until one day later,
concomitantly with a decrease in the proportion of PMN. After declining, SCC still remained
elevated while PMN proportion was decreased throughout the study as was also the milk yield,
after the first accumulation of milk during the PMI. Milk composition was changed the day after the
PMI, (increased fat and protein content; decreased lactose, whey protein and FFA content) but the
changes in the following days were not consistent except for lactose that remained decreased the
rest of the study.
Conclusion: The PMI resulted in increased SCC and proportion of PMN. Additionally, it gave rise
to minor alterations in the milk composition in the following milkings but no adverse effect on milk
quality was observed. The recruitment of PMN, which was further enhanced the first day after the
PMI, appeared to be independent of milk volume or accumulation of milk per se. Hence, we suggest
that there is a special immunophysiological/chemoattractant background to the increased migration
of leukocytes into the milk compartment observed during and after the PMI.
Published: 15 January 2009
Acta Veterinaria Scandinavica 2009, 51:4 doi:10.1186/1751-0147-51-4
Received: 9 August 2008
Accepted: 15 January 2009
This article is available from: />© 2009 Lakic et al; licensee BioMed Central Ltd.
This is an Open Access article distributed under the terms of the Creative Commons Attribution License ( />),
which permits unrestricted use, distribution, and reproduction in any medium, provided the original work is properly cited.
Acta Veterinaria Scandinavica 2009, 51:4 />Page 2 of 10
(page number not for citation purposes)
Background
A technical stop in an automated milking system (AMS)
results in a prolonged milking interval (PMI) which for
many cows may be fairly pronounced. Intervals of up to
24 hours have been observed (personal communication,
Gunnar Pettersson, research manager, Kungsängen
Research Centre, SLU,
). It has been
noticed that many cows show a short-lasting increase in
milk somatic cell count/ml (SCC) shortly after the stop
[1]. It is well known that the SCC, besides inflammation,
is influenced by several physiological and management
factors [2], e.g. milking frequency, and it is reasonable to
assume that the SCC peaks after a stop in an AMS are
related to changed conditions in the udder due to the PMI.
The length of the milking interval, if the same length is
applied repeatedly during a period of time, has previously
been shown to affect the SCC. Milking once a day
increases the SCC [3,4] and very short (3 h) intervals have
the same effect [5]. The short-lasting SCC peaks after a sin-
gle PMI has, to our knowledge, been sparsely studied.
The majority of cells in bovine milk are leukocytes. The
increase in milk SCC during mastitis is mainly due to
enhanced recruitment of polymorphonuclear leukocytes
(PMN) to the udder and milk as a result of chemotactic
agents released during an inflammatory reaction. This
leads to an increased proportion of PMN in the milk (see
e.g. [6]) which has been shown to be a more sensitive
inflammatory indicator than the total SCC [7-9]. When
the SCC is influenced by other factors than mastitis, an
increased SCC is also generally associated with increased
proportion of PMN, in both individual cow and herd milk
[7,9-11]. Accordingly, it has been shown that once-daily
milking on a regular basis results in increased proportion
of PMN along with the increased SCC [3] while, notably,
one omitted milking has been reported not to influence
the proportion of PMN [12] although the SCC is affected,
possibly indicating a different underlying mechanism.
A substantial amount of leukocytes (monocytes/macro-
phages) is present in bovine milk also under healthy con-
ditions (see e.g. [13]) although lower than during
inflammation. Regulation of normal cell traffic and cell
turn over in the udder is not well mapped. It can be spec-
ulated that an increase in milk SCC could be attributable
mainly to increased numbers of other kind of leukocytes
than PMN as a result of disturbed physiological cell traffic,
which would indicate another inflammatory leukocyte
attraction mechanism than usually seen during mastitis. It
might also be possible that an increased proportion of
PMN may be present in the milk without the total SCC
being elevated. Particularly, the short lasting peaks where
the SCC returns to normal spontaneously, within a day or
even sooner, may be suspected to have a special underly-
ing mechanism. Thus, by investigating the milk differen-
tial leukocyte count important information for
understanding the background to the SCC changes can be
gained.
Milking frequency (MF) has been shown to influence not
only the cell content of milk but also the milk composi-
tion and yield. Milking cows, regularly, just once a day
appears to result in reduced milk yield and lactose con-
tent, compared to milking two times per day, while fat
and protein content increase (see e.g. [14]). The changes
in composition seem to be common for both short- and
long-term studies. However, how a single PMI influences
milk composition and milk quality is not well docu-
mented. Increased SCC is, in general, associated with
changes in the quantity, quality and composition of milk
[15]. Besides the effect on the milk synthesis, elevated
SCC has a direct negative effect on milk quality and shelf
life [16]. In the milk quality control at the dairy, milk SCC
has therefore been included as an important parameter
and elevated SCC is often used as a basis for reduced pay-
ment to the farmer. The changes are most pronounced
during clinical mastitis with lower yield and content of
fat, casein and lactose [2,17]. Except for fat, such altera-
tions with lower magnitudes have, however, been
observed already when the SCC is moderately increased,
and even during short-lasting periods [18,19].
The characteristics of the milk SCC peaks observed after a
single PMI and how the various milk constituents may be
affected during these peaks have, to our knowledge, not
been studied. More information about the short-lasting,
spontaneously declining SCC alterations would improve
the knowledge about the cell traffic in the bovine mam-
mary gland. Additionally, since the SCC peaks may influ-
ence the herd milk SCC which is used as a quality
indicator of the milk delivered from the farm, it is also a
matter of practical concern for the farmer, and the possi-
ble effect on milk quality and composition ought to be
clarified.
The aim of the present study was to investigate the occur-
rence and pattern of episodes of elevated SCC in individ-
ual cows with low SCC after a single PMI and to clarify if
the increased SCC is due to an enhanced recruitment of
PMN. The aim was further to examine how the various
milk components are influenced and if the milk quality is
impaired in connection with short-lasting SCC peaks with
this background.
Methods
Animals
The study was conducted at Kungsängen Research Centre,
Swedish University of Agricultural Sciences (SLU), Upp-
sala, Sweden. Twenty-nine Swedish Red (SRB) cows were
included in the experiment. Most of the cows were in mid
Acta Veterinaria Scandinavica 2009, 51:4 />Page 3 of 10
(page number not for citation purposes)
lactation and in lactation number 1 or 2. The herd is com-
parable to an average Swedish dairy herd regarding lacta-
tion stage and age distribution among the cows.
All cows were free from clinical signs of mastitis and other
health disturbances before the start of the study and had a
cow composite milk SCC < 100 000. The cows were kept
indoors in a tied up system. They were fed 4 times daily
with silage and concentrate according to the Swedish rec-
ommendation. Milking was performed twice daily at 6.30
and 15.30 with a Duovac milking machine system (DeL-
aval, Tumba, Sweden). The average daily milk yield per
cow in the herd according to the Swedish milk recording
before the start of the study was 24.8 kg ECM (energy cor-
rected milk). The study was approved by the Uppsala
Local Ethics Committee.
Sampling and experimental design
The duration of the study was 12 days in total during
which the cows were exposed to a single PMI of 24 h at
day 0 by excluding the afternoon milking. In the rest of
the study milking was performed twice daily. Samples of
approximately 40 ml of composite cow milk were taken at
every milking at day -7, -3, -2, -1, 0, +1, +2, +3, +4 and +5.
Additionally, samples of approximately 80 ml of compos-
ite cow milk for analysis of casein and FFA were collected
in the afternoon milkings, at days -1 and 1 from all cows.
At days 3 and 5 casein and FFA was analysed in milk only
from cows which during day 1 had a pronounced reaction
with SCC that was increased at least 2-fold compared to
the afternoon sampling day -1, up to a total SCC value of
at least 100 × 10
3
/ml. This has been suggested to be the
plausible limit between inflamed and non-inflamed
udders in cows [20,21]. Each sample was split up in aliq-
uots for the different analyses and stored in 4°C until ana-
lyzed. Milk yield was measured at each milking by true
test equipment.
Milk analyses
The SCC was analyzed in fresh milk with no additives by
fluorescence-based electronic cell count (Fossomatic
5000, A/S N. Foss Electric, Denmark) in a routine diagnos-
tic laboratory. PMN were counted in 20 micro litre of milk
in light microscope after Newman staining according to a
modified version of the IDF standard (IDF 148-1/ISO/DIS
13366-1). The content of fat, protein and lactose, respec-
tively, was analyzed by spectroscopic mid infrared tech-
nique (MIR; MilcoScan FT 120 A/S N. Foss Electric,
Hillerød, Denmark). Samples intended for casein analysis
were stored in 4°C in cans with a preservative (bronop-
ole) until analyzed (Arla Foods analysis regulation
2000.004, 200001210). The proportion of casein was cal-
culated from the whey protein and total protein propor-
tions, using a rennet casein method. In short, 60 μl
calcium chloride (48% w/v) was added to 40 ml of milk
sample and incubated at 40°C in water bath. When the
temperature reached 40°C, 200 μl rennet (180 ± 10 inter-
national milk clothing units) were added and samples
were mixed and left to coagulate 15–20 min. The curd was
cut into small cubes and then filtered (42 μm) to receive
the whey protein fraction which was analyzed with mid
infrared spectroscopy. FFA content was analysed by the
Auto analyzer II method [22] after the samples had been
stored in 4°C for 24 h. All other analyses and preparations
of smears for PMN counting were performed within 6 h.
Statistical analysis
Data of milk SCC, PMN, fat, protein and lactose were used
in the statistical calculations. Additionally, to get a meas-
ure where a possible effect of the different length of day (9
h) and night (15 h) milking intervals, respectively, and of
different milk volume (dilution/concentration effect)
could be minimized, the average output per time unit
(output/hr) since the previous milking of each parameter
was calculated and tested. The output/hr was calculated
by dividing the content in total milk volume (total milk
content) for each parameter measured at each milking
occasion with the number of hours that had elapsed since
the immediately preceding milking. However, for casein
and FFA which were analyzed in afternoon milk only, the
total output per milking was used. The data were analyzed
using the Mixed procedure with repeated measure
ANOVA (Analysis of Variance) in SAS 9.1 (SAS Institute,
Cary, NC, USA, 2002). To obtain normal distribution, the
data on SCC were transformed to 10 logarithmic values
before the analysis. The following model was used:
The model was for observed value of cow i at day t:
y
it
= μ + c
i
+ α
t
+ ε
it
Where μ = overall mean, c
i
= random effect of the cow, α
t
= effect of sampling day t, ε
it
= random error. The error ε
it
and ε
ijt
corresponding to day t and μ are assumed to follow
autoregressive dependence with correlation λ
/t-α/
. The cov-
ariance structure is accomplished by specified SP(POW)
in the SAS program.
Before establishing the final statistical model grouping
into two groups, according to milk yield and SCC, respec-
tively, prior to the PMI was tested. Further, the influences
of days in milk and lactation number on the different var-
iables were tested.
The model used for testing the effect of group i at day t:
y
ijt
= μ + γ
i
+ c
ij
+ α
t
+ (γα)
it
+ ε
ijt
Where γ
i
= effect of group and (γα)
it
is the interaction of
group and day. The other effects are defined as in model 1.
Acta Veterinaria Scandinavica 2009, 51:4 />Page 4 of 10
(page number not for citation purposes)
After analysis it was revealed that none of mentioned
parameters had any effect on the different variables, and
that only days in milk, had a significant effect on milk
composition, only. Thus, the final model included the
parameter days in milk. The data are presented as least
square means (LSM) with its standard error. After signifi-
cant F-test (p < 0.05) least square means were compared
in pair wise t-tests at the 5% level. The baseline value, with
which values obtained after the PMI were compared, was
calculated as the mean of the values for each parameter in
all samples collected before the PMI.
Results
A total of 551 milk samples were collected and analyzed.
Besides yield and concentrations (Fig. 1A and 2A), the
output rate of each parameter during the time since the
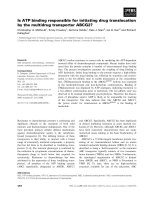
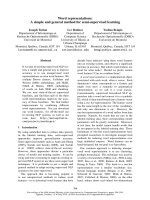
Milk yield, somatic cell count (SCC) and concentration of polymorphonuclear leukocytes (PMN) in morning and afternoon milk (column A) and the calculated average output/hr during the interval between milkings (column B) before and after a single pro-longed milking interval of 24 hrsFigure 1
Milk yield, somatic cell count (SCC) and concentration of polymorphonuclear leukocytes (PMN) in morning
and afternoon milk (column A) and the calculated average output/hr during the interval between milkings
(column B) before and after a single prolonged milking interval of 24 hrs. The prolonged milking interval (PMI)
occurred between the morning milkings day 0 and day 1. Night milking interval = the time between afternoon and morning
milking. Day milking interval = the time between morning and afternoon milking. Data represent the LS-means. SE for yield,
SCC and PMN in morning and afternoon milk was 0.59 and 0.39; 0.06 and 0.07 (10 logarithmic values); and 2.13 and 2.16,
respectively. Letters indicate statistically significant differences between the sampling occasion and the baseline value before the
PMI. a: p < 0.001, b: p < 0.01, c: p < 0.05.
Acta Veterinaria Scandinavica 2009, 51:4 />Page 5 of 10
(page number not for citation purposes)
preceding milking is presented (Fig. 1B and 2B), except for
casein, whey and FFA where total output/milking is used.
The interval between morning and afternoon milking is
denoted "day milking interval" (DMI) and that between
afternoon and morning milking "night milking interval"
(NMI). All values for each parameter were statistically
compared within morning and afternoon milk, respec-
tively, with the baseline value before the PMI.
Milk yield
The baseline value of milk yield before the PMI was 14.6
kg at the morning milking and 8.6 kg in the afternoon.
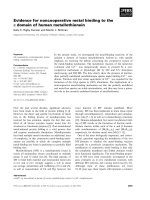
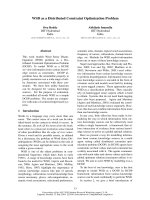
The concentration of fat, protein and lactose in morning and afternoon milk (column A) and the calculated average output/hr during the interval between milkings (column B) before and after a single prolonged milking interval of 24 hrsFigure 2
The concentration of fat, protein and lactose in morning and afternoon milk (column A) and the calculated
average output/hr during the interval between milkings (column B) before and after a single prolonged milking
interval of 24 hrs. The prolonged milking interval (PMI) occurred between the morning milkings day 0 and day 1. Night milk-
ing interval = the time between afternoon and morning milking. Day milking interval = the time between morning and after-
noon milking. Data represent the LS-means. SE for fat, protein and lactose in morning and afternoon milk was 0.13 and 0.16;
0.06 and 0.05; and 0.03 and 0.03, respectively. Letters indicate statistically significant differences between the sampling occasion
and the baseline value before the PMI. a: p < 0.001, b: p < 0.01, c: p < 0.05.
Acta Veterinaria Scandinavica 2009, 51:4 />Page 6 of 10
(page number not for citation purposes)
During the PMI milk yield accumulated in the udder and
was significantly higher at the first morning milking (19.5
kg) day 1 while, on the contrary, it was significantly lower
in afternoon milk (7.7 kg) compared to the baseline val-
ues, respectively (Fig. 1A). After day 1, morning milk yield
returned to a level that was similar to the baseline value
while afternoon milk yield remained significantly lower
throughout the study.
The baseline value for yield output rate during the NMI
and DMI, respectively, was 0,97 kg/hr and 0,95 kg/hr. It
dropped significantly during the PMI and the subsequent
milking interval day 1 (Fig 1B). Thereafter it varied but
remained on a level that was significantly lower than the
baseline for all DMI throughout the study but for NMI
only at days 1 and 4.
SCC
The SCC baseline value before the PMI was 21 × 10
3
for
morning and 47 × 10
3
for afternoon milking, respectively.
After the PMI, SCC increased significantly in both morn-
ing (the first milking after the PMI) and afternoon milking
samples day 1 (Fig. 1A), to 27 × 10
3
and 118 ×
10
3
respectively. This value represented the highest
recorded SCC value in the afternoon milk while the peak
in the morning milk was not observed until day 2 and
with a notably lower magnitude than the peak in the after-
noon milk day 1. After the peaks, the SCC in both morn-
ing and afternoon milk, declined but remained
significantly above their baseline values, respectively,
throughout the study.
The baseline value for output rate of somatic cells during
the NMI and DMI, respectively, was 37 × 10
6
cells/hr and
70 × 10
6
cells/hr. The SCC output rate was in general lower
during the NMI than during the DMI (Fig. 1B). The output
during the PMI, was just slightly numerically increased
(non-significantly) compared to the baseline value. After
that the cell output rate increased dramatically and was
approximately 5-fold increased during the subsequent
milking interval day 1. The cell output rate thereafter
declined but remained significantly increased above the
baseline during both DMI and NMI until the last milking
of the study.
PMN
The leukocyte types observed in composite milk during
the microscopic counting of PMN were PMN, monocyte-
macrophages and lymphocytes. Only single epithelial
cells were observed occasionally, which is in agreement
with previous studies of milk with low SCC [23-25].
The baseline value of PMN before the PMI was 15% in
morning and 17% in afternoon milk. After the PMI, the
percentage of PMN was significantly increased day 1 in
both morning and afternoon milk, 31% and 38%, respec-
tively (Fig. 1A). It is noteworthy that the PMN peak in
both morning and afternoon milk was observed during
day 1, in contrast to the SCC which in morning milk did
not peak until day 2. After the short and transient peak
observed day 1, the percentage of PMN in milk started to
decline day 2 and were statistically significantly lower than
before the PMI from day 3 throughout the study in both
morning and afternoon milk.
For PMN output rate, the baseline value during the NMI
and DMI, respectively, was 7,5 × 10
6
cells/hr and 14 × 10
6
cells/hr. Similar to SCC, the output of PMN (Fig. 1B) was
in general lower during the NMI than during the DMI.
During the PMI the output rate of PMN increased with
more than 50% compared to the baseline value, but the
difference was not statistically significant (p = 0.11).
Moreover, during each of the two subsequent milking
intervals the increase of the output rate of PMN was huge
compared to the baseline value (p < 0.001) for DMI and
NMI, respectively. Thereafter, until the end of the study,
the output rate of PMN declined to values that were
numerically below the comparable baseline values, how-
ever statistically non-significant.
Fat and FFA content
The fat baseline value before PMI was 3.8% at morning
and 5.8% at afternoon milking, respectively. After the
PMI, the fat percentage was significantly increased in both
morning and afternoon milking samples day 1, (4.4%
and 7.6%, respectively), and in morning milk day 2 (Fig.
2A). Thereafter the fat percentage declined and was not
significantly changed in comparison with the baseline val-
ues, in either morning or afternoon milk, during the rest
of the study.
The baseline output rate of fat during the NMI and DMI,
respectively, was 36 g/hr and 56 g/hr. The output rate did
not alter during the PMI but increased significantly during
the two subsequent milking intervals day 1 and 2 (Fig.
2B). Thereafter it declined to values similar to the baseline
values of DMI and NMI, respectively, except for occasion-
ally during the DMI day 3.
FFA was analyzed only in afternoon milk. In contrast to all
other milk constituents measured, no significant changes
in the content of FFA (mEkv/l; SE = 0.08) were observed
after the PMI although there was a numerical drop to day
1. However, the FFA content relative to the total fat con-
tent (mEkv/100 g of fat) decreased significantly (p <
0.001) from 1.76 before the PMI to 1.33 day 1. When data
only from the cows that showed a particularly pro-
nounced SCC peak day 1 (n = 9; SE 0.10) was analyzed a
similar significant drop in the FFA content relative to the
total fat content from 2.05 before the PMI to 1.52 day 1 (p
Acta Veterinaria Scandinavica 2009, 51:4 />Page 7 of 10
(page number not for citation purposes)
= 0.01) was observed and additionally the value at day 5
was lower (p < 0.05) than before the PMI.
Protein, casein and whey protein content
The baseline value of protein content was 3.43% for morn-
ing and 3.66% for afternoon milking. After the PMI, the
protein content increased significantly in both morning
and afternoon samples to 3.60% and 3.77%, respectively,
day 1 (Fig. 2A). After the pronounced peak, values rapidly
declined and already day 2, the protein percentage was
not significantly different compared to that before the
PMI in either morning or afternoon milk, respectively.
However, a significant increase was recorded again in the
afternoon milking day 3 and the protein percentage there-
after remained significantly increased in both morning
and afternoon milk, respectively, during the rest of the
study.
The baseline value for output rate of protein during the
NMI and DMI, respectively, was 33 g/hr and 35 g/hr. The
output rate decreased significantly during the PMI and the
subsequent milking interval, day 1. The output during the
DMI remained significantly decreased throughout the
study (except for day 4). Numerically, the output rate was
lower also during the NMI compared to the baseline, but
statistically non-significant.
Casein and whey were analyzed only in afternoon milk.
The average casein percentage (SE = 0.04) increased signif-
icantly after the PMI from 2.66% day -1 to 2.73% day 1 (p
< 0.01) while the total output per milking decreased from
221.6 g day -1 to 207.7 g day 1 (p < 0.05). The whey protein
percentage, accordingly, decreased significantly from
1.08% day -1 to 1.04% day 1 (p < 0.01; SE = 0.02). The
total whey output per milking was not significantly
changed (p = 0.08) although there was a numerical
decrease from day -1 (90.2 g) to day 1 (79.6 g). When data
only from the cows that showed a particularly pro-
nounced SCC peak day 1 (n = 9) was analyzed, no signif-
icant changes in either casein percentage (SE = 0.05) or
total output, or in whey percentage (SE = 0.03) were
observed. However, the total output of whey protein per
milking was decreased from 102.0 g day -1 to 83.2 g day
1 (p < 0.05).
Lactose
The baseline of lactose before PMI was 4.51% for morning
and 4.41% for afternoon milk. After the PMI, the lactose
content dropped significantly in both morning and after-
noon milk to 4.45% and 4.33%, respectively, at day 1
(Fig. 2A). The lactose concentration remained signifi-
cantly decreased in morning as well as afternoon milk
compared to the baseline values, respectively, throughout
the study.
The baseline of output rate of lactose during the NMI and
DMI, respectively, was 44 g/hr and 35 g/hr. The rate of lac-
tose output decreased significantly during the PMI and the
subsequent milking interval day 1 compared to the base-
line values, respectively, and remained significantly
decreased during the DMI for the rest of the study. In the
NMI the output rate of lactose also remained at a numer-
ically lower level, but significantly lower only in day 2 and
day 4.
Discussion
The main findings of the present study were that during
the PMI there was a distinct increase in proportion of
PMN while the increase in SCC was slight and that the
most pronounced changes were observed in the second
milking after the PMI, in the afternoon day 1. In morning
milk the peak SCC value did not occur until day 2 and,
unexpectedly, concomitantly with a decrease in the pro-
portion of PMN. The alterations in milk composition
were numerically slight with lowered relative FFA content
and did not show any adverse influence on the milk qual-
ity.
The rise in SCC observed after the PMI is in principal in
accordance with previous studies [3,12] although infor-
mation on milk SCC after a single PMI is scarce. The peak
value in morning milk, in contrast to afternoon milk, was
not observed until day 2. The SCC is, in general, known to
be lower in morning milk than in afternoon milk [26]. It
has been ascribed to a different degree of dilution of the
cells by the different milk volumes at the two daily milk-
ing occasions due to uneven milking intervals. This could
partly have explained the SCC results also in the present
study since the accumulated milk volume during the PMI
was notably high in the first morning milking thereafter.
The changes in SCC during and after the PMI were, how-
ever, in accordance with the number of cells entering the
milk per time unit (Fig. 1B), a measure which exclude the
effect of dilution. Why the highest SCC value and dis-
tinctly increased recruitment/hr of total somatic cells to
the milk, was not observed until the afternoon milking
day 1 while sharply increased PMN percentage in milk
was observed already in the morning, remains to be
explained. Early increase in the proportion of milk PMN
has also been reported by others, however, concomitantly
with increased SCC [3].
Which factors that might have triggered the PMN migra-
tion can be discussed. It could be argued that the large
accumulated milk volume during the PMI and extension
of the udder might have caused increased permeability
with subsequent leakage of inflammatory mediators into
milk from blood. Stelwagen et al. [27] described a tempo-
rary, reversible disruption of tight junction (TJ) integrity,
due to increased intramammary pressure by milk accumu-
Acta Veterinaria Scandinavica 2009, 51:4 />Page 8 of 10
(page number not for citation purposes)
lation after a 24-h milking interval. They discussed
whether this could facilitate the migration of leukocytes
into the mammary gland and explain the increased SCC
observed after a single PMI in some studies [3,12]. We
observed decreased concentration of serum proteins (whey
proteins) in the milk after the PMI, which indicates that
the mammary endothelial and epithelial permeability
was not increased in this study. The recruitment of PMN
was further enhanced during day 1 when the udder was
emptied twice and not extended, which speaks for that the
PMN migration was influenced by factors not related to a
large milk volume and accumulation of milk, per se.
It is noteworthy that in several respects the proportion of
PMN appeared not to follow the SCC in the way that has
previously been shown in cow milk under various inflam-
matory and physiological conditions [7,9-11]. Although
the increase in SCC during the PMI was slight (from 21 ×
10
3
to 27 × 10
3
), the proportion of PMN was doubled
(from 15% to 31%). Further, when the most pronounced
SCC increase in morning milk day 2 was observed, the
percentage of PMN had sharply declined. Thus, this
increase in SCC was, apparently, mainly attributable to
other kinds of leukocytes. At this time, the proportion of
PMN also switched to become higher in morning than in
afternoon milk in contrast to the SCC and what is usually
seen [26]. The results speak for a special background to
the recruitment of leukocytes to milk after a PMI and to
the increased proportion of PMN. It is further supported
by the extremely rapid return of the proportion of PMN to
the baseline level. Manlongat et al. [28] identified the
presence of "physiological" chemotactic factors in mam-
mary secretions influencing the recruitment of PMN to
goat's milk in late lactation and emphasized that
increased infiltration of PMN to the mammary gland
under certain circumstances must not necessarily be a
result of a pathological process. They also observed differ-
ent activity of specifically mononuclear leukocyte chem-
oattractants during the lactation period. The results from
the current study are in accordance with the findings by
Manlongat et al. [28] and suggest the presence of physio-
logical chemotactic factors in cow milk active in response
to a long milking interval. This remains to be further
explored by specifically examining the immunophysio-
logical background to the SCC peaks which was not the
aim of the present study.
Another interesting finding in the present study is that the
proportion of PMN decreased to values that were below
the baseline value in both morning and afternoon milk
from day 2 and throughout the study. In contrast, the SCC
after declining still remained above the baseline value.
These results were highly significant even if the changes
were numerically modest and indicate a relative decreased
attraction of PMN to the milk during several days after the
PMI, in favour of recruitment of mononuclear leukocytes.
The milk composition was significantly changed the first
day after the PMI but the changes in the following days
were not consistent except for lactose that was lower
throughout the study. Lactose is the key for osmotic regu-
lation in the udder and a drop in lactose content is often
accompanied by a drop in milk yield. Either it could be
ascribed to leakage out of lactose from the milk through
impaired TJs or it could be attributed to lower synthesis of
lactose during the PMI. Since the unchanged, or even
slightly decreased, content of serum proteins in milk
speaks for an unaffected integrity of the TJs, a lower syn-
thesis is more likely. A plausible background to a lowered
synthesis of lactose after the PMI is a decreased content of
α-lactalbumin. It is well known that this protein is a coen-
zyme in the synthesis of lactose. α-lactalbumin constitutes
almost 20% of the serum proteins (whey proteins) [29]
which were shown to decrease significantly in the present
study. Since lactose plays a key role in regulating the
osmotic pressure it is also influenced by the content of
ions in milk. However, in the present study no analyses
were done on the content of sodium and potassium ions.
The elevated protein content was apparently due to an
increase in casein content while the content of serum pro-
teins decreased. Increased casein content has been
reported from previous studies of PMIs when applying
once-daily milking, regularly. Claesson [17] observed a
higher concentration of casein during once-daily than
twice-daily milking as did also Lacy-Hulbert et al. [30].
The increase has been explained by the large size of the
casein micelles, making them un-capable of leaking out
through TJs to the blood compartment. In the present
study the increased proportion of casein was probably, at
least partly, attributable to a concentration effect by the
decreased afternoon milk yield at day 1. This is further
supported by the observation that the total output of
casein decreased. The decreased casein output could also
be an effect of increased presence of plasma proteolytic
enzymes. In earlier studies it has been observed that short
milking intervals are related to lower plasmin activity in
the milk compared to milk obtained after a long milking
interval [31,32]. The decreased serum protein content in
milk observed indicates that the permeability of endothe-
lium and epithelium was not increased in the present
study making increased plasmin activity in milk after the
PMI less likely.
The fat content was significantly increased after PMI. The
changes in fat might at least partially be ascribed to a con-
centration effect. FFA is undesirable in milk due to its deg-
radation of fat quality and rancid flavour. Accumulation
of FFA in the milk is related to higher hydrolysis of triglyc-
Acta Veterinaria Scandinavica 2009, 51:4 />Page 9 of 10
(page number not for citation purposes)
erides catalyzed by lipoprotein lipase. It is known from
previous studies that short and irregular milking intervals
may result in elevated FFA content in milk [33,34]. In the
current study, the level of FFA/100 g fat decreased signifi-
cantly. Since fat content increased while the FFA
decreased, apparently, there was no effect of lipoprotein
lipase, originating from blood plasma. This further sup-
ports that the TJs kept their integrity during the study.
As expected, the PMI resulted in significantly elevated
milk yield at the first milking in the morning of day 1 due
to accumulation of milk in the udder. In the rest of the
study the morning milk yield was not changed compared
to before the PMI. In contrast to the morning milk, the
afternoon milk yield day 1 was reduced and, remarkably,
remained significantly lower than the baseline value
throughout the study. A probable mechanism behind that
afternoon yield particularly was reduced is difficult to
identify. There is little information available of the effect
of a single PMI on the milk yield, but decreased yield has
been reported previously [12]. A considerable reduction
of milk yield was also observed by Claesson et al. [35]
when one milking per week was omitted. In several stud-
ies a lowered milk yield has been observed in cows when
milking frequency was reduced to once per day
[14,27,36]. These results show the long term effect of less
frequent milking and regularly higher intramammary
pressure. In the present investigation the pressure was
increased only occasionally during a short period of time.
The significantly decreased lactose content observed
might still indicate that the drop in yield could be due to
a negative influence of high intramammary pressure on
the milk secreting cells. However, Stelwagen and Lacy-
Hulbert [3] suggested that a single PMI did not cause any
damage to the mammary secretory epithelium. Addition-
ally, a lingering effect of the increased pressure during the
PMI over several days while the milking continued twice
per day seems not to be a plausible explanation for the
lowered milk yield. It still remains to be explained.
Conclusion
The results from the present study indicate that there
might be a special chemotactic background to the
increased proportion of PMN in milk, observed without
any obvious inflammatory challenge, during and after the
PMI. The recruitment of PMN was further enhanced the
first day after the PMI when the udder was milked twice
daily. This speaks for that the PMN migration was influ-
enced by factors not related to a large milk volume and
accumulation of milk, per se. Milk composition was not
markedly changed after the PMI, except for lactose, but it
did not influence milk quality. Several findings indicate
that the PMI did not affect the TJs.
Competing interests
The authors declare that they have no competing interests.
Authors' contributions
BL carried out the practical work, performed neutrophil
counting, compiled the results, participated in the statisti-
cal analysis and interpretation of results, drafted the man-
uscript and participated in its revision.
KÖ and KSS designed the study. KÖ supervised and partic-
ipated in the practical work and neutrophil counting,
assisted in interpretation of the results and was main
responsible for supporting the drafting and for revision of
the manuscript. KSS assisted in interpretation of the
results and helped to draft and revise the manuscript. EW
participated in the practical work of the study, was main
responsible for performing the statistical analyses, helped
in interpreting the results and revising the manuscript. All
authors read and approved the final manuscript.
Acknowledgements
This study was funded by SLF (Swedish Farmers Foundation for Agricultural
research). The authors want to express their sincere thanks to Dr Lennart
Norell, Unit of Applied Statistics and Mathematics, Swedish University of
Agricultural Sciences, Uppsala for excellent statistical advice.
References
1. Pettersson G, Berglund I, Svennersten-Sjaunja K: Effects of tempo-
ral technical stoppages in an AMS on bulk milk SCC and
number of positive bacterial tests on udder quarter level.
Proceedings of the NJF seminar: Technology for milking and housing of dairy
cows, 11–13 February 2002; Hamar .
2. Harmon RJ: Physiology of mastitis and factors affecting
somatic cell counts. J Dairy Sci 1994, 77:2103-2112.
3. Stelwagen K, Lacy-Hulbert SJ: Effect of milking frequency on milk
somatic cell count characteristics and mammary secretory
cell damage in cows. Am J Vet Res 1996, 57:902-905.
4. Clark DA, Phyn CVC, Tong MJ, Collins SJ: A systems comparison
of once versus Twice daily milking. J Dairy Sci 2006,
89:1854-1862.
5. Fernando RS, Spahr SL: Effects of milking interval on selected
milk constituents from normal and infected quarters. J Dairy
Sci 1983, 66:1155-1161.
6. Sordillo LM, Shafer-Weaver K, DeRosa D: Immunobiology of the
mammary gland. J Dairy Sci 1997, 80:1851-1865.
7. Östensson K, Hageltorn M, Astrom G: Differential cell counting
in fraction-collected milk from dairy cows. Acta Vet Scand 1988,
29:493-500.
8. Redelman D, Butler S, Robison J, Garner D: Identification of
inflammatory cells in bovine milk by flow cytometry. Cytom-
etry 1988, 9:463-468.
9. Kelly AL, Tiernan D, O'Sullivan C, Joyce P: Correlation between
bovine milk somatic cell count and polymorphonuclear leu-
kocyte level for samples of bulk milk and milk from individ-
ual cows. J Dairy Sci 2000, 83:300-304.
10. Blackburn PS: The variation in the cell count of cow's milk
throughout lactation and from one lactation to the next.
Journal of Dairy Research 1966, 33:193-198.
11. Östensson K: Variations during lactation in total and differen-
tial leukocyte counts, N-acetyl-β-D-glucosaminidase, antit-
rypsin and serum albumin in foremilk and residual milk from
non-infected quarters in the bovine. Acta Vet Scand 1993,
34:
83-93.
12. Fox LK, Schultz LH: Effects of infection status on quarter milk
production and composition following omitted milking. J
Dairy Sci 1985, 68:418-423.
Publish with Bio Med Central and every
scientist can read your work free of charge
"BioMed Central will be the most significant development for
disseminating the results of biomedical researc h in our lifetime."
Sir Paul Nurse, Cancer Research UK
Your research papers will be:
available free of charge to the entire biomedical community
peer reviewed and published immediately upon acceptance
cited in PubMed and archived on PubMed Central
yours — you keep the copyright
Submit your manuscript here:
/>BioMedcentral
Acta Veterinaria Scandinavica 2009, 51:4 />Page 10 of 10
(page number not for citation purposes)
13. Burvenich C, Guidry AJ, Paape MJ: Natural defence mechanisms
of the lactating and dry mammary gland. Proceedings 3rd IDF Int.
Mastitis Seminar, Tel Aviv, Izrael 1995.
14. Davis SR, Farr VC, Stelwagen K: Regulation of yield loss and milk
composition during once-daily milking. Livest Prod Sci 1999,
59:77-94.
15. Auldist MJ, Walsh BJ, Thomson NA: Seasonal and lactational
influences on bovine milk composition in New Zealand. J
Dairy Res 1998, 65:401-411.
16. Le Roux Y, Laurent F, Moussaoui F: Polymorphonuclear proteo-
lytic activity and milk composition change. Vet Res 2003,
34:629-645.
17. Claesson O: Variation in the rennin coagulation time in milk.
Annals of the Agricultural College of Sweden 1965:237-332.
18. Miller R, Emanuelsson U, Persson E, Brolund L, Philipsson J, Funke H:
Relationships of milk somatic cell counts to daily milk yield
and composition. Acta Agric Scand 1983, 33:209-223.
19. Berglund I, Pettersson G, Ostensson K, Svennersten-Sjaunja K:
Quarter milking for improved detection of increased SCC.
Reprod Domest Anim 2007, 42:427-432.
20. Hillerton JE: Redefining mastitis based on somatic cell count.
IDF Bulletin 1999, 345:4-6.
21. Hamann J: Relationships between somatic cell count and milk
composition. IDF Bulletin 2002, 37:256-259.
22. Lindqvist B, Roos T, Fujita H: Auto-Analyzer determination of
free fatty acids in farm milk. Modification of present method
to simplify transportation of the sample. Milchwissenschaft
1975, 30:12-17.
23. Hageltorn M, Saad MA: Flow cytofluorometric characterization
of bovine blood and milk leukocytes. Am J Vet Res 1986,
47:2012-2016.
24. Boutinaud M, Jammes H: Potential uses of milk epithelial cells.
Reprod Nutr Dev 2002, 42:133-47.
25. Koess C, Hamann J: Detection of mastitis in the bovine mam-
mary gland by flow cytometry at early stages. J Dairy Res 2008,
75:
225-232.
26. White F, Rattray EAS: Diurnal variation in the cell content of
cow's milk. J Comp Pathol 1965, 75:253-261.
27. Stelwagen K, Farr VC, McFadden HA, Prosser CG, Davis SR: Time
course of milk accumulation-induced opening of mammary
tight junctions, and blood clearance of milk components. Am
J Physiol 1997, 273:379-386.
28. Manlongat N, Yang TJ, Hinckley LS, Bendel BR, Krider HM: Physio-
logic chemoattractant-induced migration of polymorphonu-
clear leukocytes in milk. Clin Diagn Lab Immunol 1998, 5:375-381.
29. Walstra P, Geurts TJ, Noomen A, Jellema A, van Boekel MAJS: Prin-
ciples of milk properties and processes. In Dairy Technology US:
Routledge; 1999.
30. Lacy-Hulbert SJ, Woolford MW, Nicholas GD, Prosser CG, Stelwa-
gen K: Effect of milking frequency and pasture intake on milk
yield and composition of late lactation cows. J Dairy Sci 1999,
82:1232-1239.
31. Sorensen BA, Muir DD, Knight CH: Thrice-daily milking through-
out lactation maintains epithelial integrity and thereby
improves milk protein quality. J Dairy Res 2001, 68:15-25.
32. Svennersten-Sjaunja KM, Pettersson G: Pros and cons of auto-
matic milking in Europe. J Anim Sci 2007.
33. Klei LR, Lynch JM, Barbano DM, Oltenacu PA, Lednor AJ, Bandler DK:
Influence of milking three times a day on milk quality. J Dairy
Sci 1997, 80:427-436.
34. Wiking L, Nielsen JH, Bavius AK, Edvardsson A, Svennersten-Sjaunja
K: Impact of milking frequencies on the level of free fatty
acids in milk, fat globule size, and fatty acid composition. J
Dairy Sci 2006, 89:1004-1009.
35. Claeesson O, Hansson A, Gustafsson N, Brännäng E: Studies on
monozygote cattle twins. Once-a-day milking compared
with twice-a-day milking. Acta Agric Scan 1959, 9:
38-58.
36. O'Brien B, Ryan G, William JM, McDonagh D, Kelly A: Effect of fre-
quency of milking on yield, composition and processing qual-
ity of milk. J Dairy Res 2002, 69:367-374.