Báo cáo khoa học: "Proton nuclear magnetic resonance spectroscopy based investigation on propylene glycol toxicosis in a Holstein cow" potx
Bạn đang xem bản rút gọn của tài liệu. Xem và tải ngay bản đầy đủ của tài liệu tại đây (306.56 KB, 9 trang )
BioMed Central
Page 1 of 9
(page number not for citation purposes)
Acta Veterinaria Scandinavica
Open Access
Research
Proton nuclear magnetic resonance spectroscopy based
investigation on propylene glycol toxicosis in a Holstein cow
Hanne Christine Bertram*
1
, Bent Ole Petersen
2
, Jens Ø Duus
2
,
Mogens Larsen
3
, Birgitte-Marie L Raun
3
and Niels Bastian Kristensen
3
Address:
1
Department of Food Science, Faculty of Agricultural Sciences, Aarhus University, P.O. Box 102, DK-5792 Årslev, Denmark,
2
Carlsberg
Laboratory, Gamle Carlsberg Vej 10, DK-2500 Valby, Denmark and
3
Department of Animal Health, Welfare and Nutrition, Faculty of Agricultural
Sciences, Aarhus University, P.O. Box 50, DK-8830 Tjele, Denmark
Email: Hanne Christine Bertram* - ; Bent Ole Petersen - ; Jens Ø Duus - ;
Mogens Larsen - ; Birgitte-Marie L Raun - ;
Niels Bastian Kristensen -
* Corresponding author
Abstract
Background: It is unknown which metabolites are responsible for propylene glycol (PG)-induced
toxicosis, and a better understanding of the underlying mechanisms explaining incidences of
abnormal behaviour of dairy cows fed PG is therefore needed.
Methods: The study included three cows of which one developed PG toxicosis. In order to
investigate how the metabolism of PG differed in the cow developing toxicosis, proton nuclear
magnetic resonance (NMR) spectroscopy was applied on ruminal fluids and blood plasma samples
obtained before and after feeding with PG.
Results: PG toxicosis was characterized by dyspnea and ruminal atony upon intake of concentrate
containing PG. The oxygen saturation of arterial blood haemoglobin and the oxygen pressure in
arterial blood decreased along with the appearance of the clinical symptoms. NMR revealed
differences in plasma and ruminal content of several metabolites between the cow responding
abnormally to PG and the two control cows.
Conclusion: It is concluded that PG-toxicosis is likely caused by pulmonary vasoconstriction, but
no unusual metabolites directly related to induction of this condition could be detected in the
plasma or the ruminal fluid.
Background
Propylene glycol (PG) has been used as a glucogenic feed
supplement for ruminants for decades [1]. Metabolism of
PG in ruminants involves microbial metabolism in the
rumen and hepatic metabolism of products of ruminal
fermentation (propanol, propanal, and propionate) as
well as PG absorbed to the portal blood [2]. Various appli-
cation forms of PG are in use: oral drench, oro-ruminal
infusion devices, top dressed on feed, mixed into pelleted
feeds, and mixed into total mixed rations. Numerous
studies report beneficial effects of PG on glucose and fat
homeostasis in periparturient dairy cows, for review see
[3]. However, reports from practice and sparse reports in
the literature describe abnormal behaviour involving
Published: 13 June 2009
Acta Veterinaria Scandinavica 2009, 51:25 doi:10.1186/1751-0147-51-25
Received: 19 March 2009
Accepted: 13 June 2009
This article is available from: />© 2009 Bertram et al., licensee BioMed Central Ltd.
This is an open access article distributed under the terms of the Creative Commons Attribution License ( />),
which permits unrestricted use, distribution, and reproduction in any medium, provided the original work is properly cited.
Acta Veterinaria Scandinavica 2009, 51:25 />Page 2 of 9
(page number not for citation purposes)
observation of shallow breathing, ataxia, salivation, som-
nolence and depression when adding PG to the feed of
dairy cows [3]. In a field trial involving 7 dairy herds, cows
were fed either 0, 150, 300 or 450 g PG/d from 20 to 14 d
antepartum [4]. In 3 out of the 7 herds approximately
36% of the cows reacted during the first few days of appli-
cation by signs described as hyperventilation and somno-
lence.
The present study is based on a test-feeding trial with a
pelleted concentrate containing PG, which is under devel-
opment for use in very early lactation. Feeding this con-
centrate induced unexpectedly a condition in one out of
three cows resembling PG toxicosis and the present study
aimed to investigate the metabolites responsible for PG-
induced toxicosis using proton nuclear magnetic reso-
nance (NMR) spectroscopy. Since it remains unknown
which metabolites are responsible for a PG-induced toxi-
cosis, a non-selective analytical method that detects as
many metabolites as possible would be attractive. Proton
NMR spectroscopy, which in principle enables detection
of all hydrogen-containing molecules, has turned into a
commonly applied technique for metabolic profiling of
biofluids, among other to identify biochemical changes in
response to disease in mammals [5]. In the present study
proton NMR spectroscopy was applied on ruminal and
blood plasma samples from the cows used in the study.
Materials and methods
Animals and feeding
Three Danish Holstein cows (595 ± 42 kg body weight; 22
± 1 kg milk/d; 276 ± 118 days in milk; 134 ± 14 days after
surgery) implanted with a ruminal cannula and perma-
nent indwelling catheters in the hepatic portal vein,
mesenteric vein as well as an artery were used in the study.
Surgical procedures have been described previously [6,7].
Cows were fed 11 kg/d of a pelleted concentrate (Table 1)
and 9 ± 1 kg/d of mixed grass hay (97% dry matter; 59%
neutral detergent fiber in dry matter), corresponding to
275 g PG/day. The feed was divided into two equally sized
portions fed at 0700 and 1900 h. Cows were milked twice
daily and were housed in tie stalls on wood shavings and
had free access to water.
The study complied with the Danish Ministry of Justice
Law no. 382 (June 10, 1987), Act no. 726 (September 9,
1993) concerning experiments with animals and care of
experimental animals.
Experimental samplings
Each cow was sampled for one day after being fed the
experimental diet for 14 d. On sampling days, continuous
infusion of p-aminohippuric acid (pAH; 29 ± 1 mmol/h)
into the mesenteric vein was initiated at 05:30. The pAH
infusate was a sterilized 250 mM solution of pAH (4-ami-
nohippuric acid 99%, Acros, Geel, Belgium) adjusted to
pH 7.4. Ten sets of ruminal and blood samples were
obtained 0.5 h before feeding, and 0.5, 1.5, 2.5, 3.5, 5.0,
6.5, 8.0, 9.5, and 11 h after feeding. Blood was sampled by
simultaneously drawing blood from the artery and
hepatic portal vein into 20 mL syringes and was immedi-
ately transferred to heparin vacuettes (#455051; Greiner
Bio-One GmbH, Kremsmuenster, Austria). Plasma was
harvested by centrifugation at 3000 g for 20 min and
stored at -20°C until analysis. Separate blood samples
were obtained in 1 mL heparinized syringes for blood gas
measurements just before collection of the main blood
samples. One extra arterial 1 mL sample was obtained
Table 1: Composition of pelleted concentrate
1
Feedstuff Inclusion, % of concentrate (as mixed)
WeiPass
2
49
Soya meal 15
Grass meal 10
Sugar beet pulp 10
Molasses, beet 7
Leci-E
3
3
Propylene glycol 2.5
Sodium bicarbonate 1.5
Mineral mix 1.1
Calcium carbonate 0.5
MetaSmart
4
0.4
Monocalcium phosphate 0.3
1
The dry matter content was 96.6% and the concentrate contained (% of dry matter): crude protein (N × 6.25), 26; neutral detergent fiber, 19; ash,
8; ether extract 5. The in vitro digestibility of the concentrate was 96.2%.
2
Ruminal protected wheat (Raiffeisen Hauptgenossenschaft Nord AG, Kiel, Germany)
3
Vegetable fat (Leci-E; Evilec, Kolding, Denmark) with 50% rape seed and soybean lecithin and natural α-tocopherol containing (per kg DM): 950 g
crude fat, 836 g fatty acids and 2000 mg RRR-α-tocopherol.
4
Isopropyl ester of methionine hydroxyanalog (Adisseo, Antony, France).
Acta Veterinaria Scandinavica 2009, 51:25 />Page 3 of 9
(page number not for citation purposes)
from the cows that reacted to feeding 1 h after feeding.
Ruminal fluid was sampled from the ventral ruminal sac
using a suction strainer (#RT extended version, Bar Dia-
mond, Parma, ID) and a 50 mL syringe. Ruminal fluid pH
was measured immediately after sampling (IQ 150 pH
meter; IQ Scientific Instruments Inc., Carlsbad, CA), and
a subsample of ruminal fluid was stabilized with 5% meta
phosphoric acid and frozen at -20°C.
Analytical procedures
Blood sampled in 1 mL syringes was immediately taken
for blood gas and oximetry analysis (ABL 520, Radiometer
A/S, Copenhagen, Denmark).
NMR spectroscopy
The NMR measurements were performed on a Bruker 800
spectrometer, operating at a
1
H frequency of 799.40 MHz,
and equipped with a 5-mm
1
H observe TXI cryoprobe
(Bruker BioSpin, Rheinstetten, Germany). For both plasma
and ruminal samples the NMR measurements were carried
out on samples collected 0.5 h before feeding, and 0.5, 1.5,
2.5, 3.5, 5.0 and 8.0 h after feeding. On plasma samples the
NMR measurements were carried out at 310 K, while meas-
urements on ruminal fluid samples were carried out at 298
K. Prior to NMR measurements, the samples were thawed,
and 500 μl aliquots were mixed with 100 μl D
2
O. Sodium
trimethylsilyl- [2,2,3,3-
2
H
4
]-1-propionate (TSP) was added
as an internal chemical shift standard (0.10% w/w). The
NMR measurements were essentially carried out as
described previously described [8]. For ruminal fluid sam-
ples
1
H NMR spectra were obtained using a standard single
90° pulse experiment, while for plasma samples two
1
H
NMR spectra were obtained on each sample; i) a standard
one-dimensional spectrum acquired using single 90° pulse
experiment, and ii) a one-dimensional spectrum acquired
with a Carr-Purcell-Meiboom-Gill (CPMG) delay of 50 ms
added in order to attenuate broad signals from high-molec-
ular-weight components. On plasma samples 64 scans
were acquired in the CPMG experiment, 32 scans were
acquired in the standard spectrum, while 64 scans were
acquired on ruminal fluid samples. In all NMR experiments
water suppression was achieved by irradiating the water
peak during the relaxation delay of 5 s and 16 K data points
spanning a spectral width of 13.03 ppm were collected. An
exponential line-broadening function of 0.3 Hz was
applied to the free induction decay (FID) prior to Fourier
transformation (FT). All spectra were referenced to the TSP
signal at 0 ppm.
To aid spectral assignment 2D
1
H-
1
H correlation (DQFC-
OSY) and 2D
1
H-
13
C HSQC spectra were recorded on
selected ruminal fluid samples using water suppression.
The DQFCOSY spectra were acquired with a spectral
width of 10000 Hz in both dimensions, 4096 data points,
512 increments with 64 transients per increment and zero
filled in the F1 dimension. The HSCQ spectra were
acquired with a spectral width of 10000 Hz in the F2
dimension and 30153 Hz in the F1 dimension, a data
matrix with a size of 2048 × 512 data points and 32 tran-
sients per increment, and the spectra were zero filled in
both dimensions.
Post-processing and multivariate data analysis
Principal component analysis (PCA) was applied to
explore any clustering behaviour of the samples using the
Unscrambler software version 9.2 (Camo, Oslo, Norway).
PCA is an unbiased mathematical algorithm that lowers
data dimensionality whilst retaining variation in a large
dataset. By identifying directions (principal components)
in which variation are at maximum, samples can be
explained by a relatively low number of components
instead of thousands of variables. Following analysis of
the components plots can then be used to identify similar-
ities and differences between samples [9]. The NMR spec-
tra were subdivided into 0.002 ppm integral regions and
integrated, and for ruminal fluid spectra the regions 0.5–
4.6–10.0 ppm and for plasma spectra the regions 0.5–4.5
and 5.1–10.0 were included in the PCA.
Results
Clinical observations
Cows were fed the experimental diet for 14 d prior to sam-
pling and no signs of lack of tolerance to the ration were
noticed. On the sampling day, which was designated as
the sampling day, two of the cows consumed the entire
amount of offered concentrate within 15 min whereas the
third cow had consumed approximately half and stopped
eating. Three min later the remaining amount of the con-
centrate was introduced into the rumen via the ruminal
cannula. Twelve min after feeding the concentrate directly
into the rumen (30 min after feeding) and immediately
before starting the second blood sampling the third cow
developed severe dyspnea and ruminal atony. The cow
remained standing although she was severely affected by
the incidence. Two h after feeding the symptoms had
completely disappeared and it was observed that the cow
started eating hay. By 2.5 h after feeding she was observed
drinking water and had apparently completely recovered.
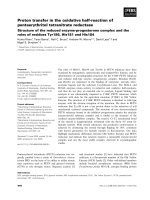
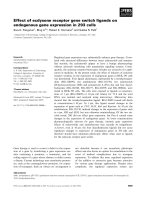
Oximetry
One h after feeding the oxygen saturation of arterial blood
haemoglobin of the affected cow decreased to 0.64, and
the curve reflects the observed clinical condition of the
cow. The oxygen saturation of the two other cows did not
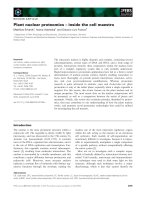
change following feeding (Figure 1). The affected cow was
hypoxemic with a decrease in pO
2
(oxygen pressure) of
arterial blood following the same pattern as the oxygen
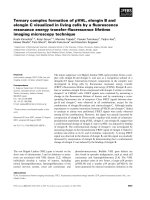
saturation (Figure 2). Only a slight decrease in pCO
2
(car-
bon dioxide pressure) was observed for the affected cow
(Figure 3).
Acta Veterinaria Scandinavica 2009, 51:25 />Page 4 of 9
(page number not for citation purposes)
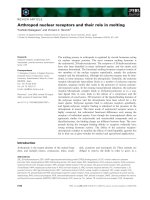
Plasma analyses
In order to investigate the main variations in the serial
plasma metabolite profiles, PCAs were performed on the
obtained NMR spectra, and score plots are shown in Fig-
ure 4. For both arterial plasma (Figure 4a) and portal
plasma samples (Figure 4b) the first principal component
(PC1) appeared to describe a manifest effect of sampling
time, as a clear movement of samples along PC1 as func-
tion of sampling time was observed. The largest difference
was observed between samples obtained before feeding
and samples obtained 2.5–3.5 h after feeding, while sam-
ples obtained 5.0 and 8.0 h after feeding shifted back
towards the samples obtained before feeding. Especially
for arterial plasma it was clear that the second principal
component (PC2) explained the variation between con-
trol samples and samples from the cow responding abnor-
mally to PG, as the samples from the cow responding
abnormally to PG in general were characterized by higher
PC2 score values (Figure 4a). This revealed that irrespec-
tive of sampling time after feeding, the plasma metabolite
profile of the cow responding abnormally to PG adminis-
tration differed from the plasma metabolite profile of the
two control cows.
For a more comprehensive analysis of metabolic differ-
ences at distinct sampling times, the
1
H CPMG NMR
Oxygen saturation (sO
2
) of arterial blood haemoglobin in two cows that did not show clinical reaction to concentrate containing propylene glycol (circle) and in one cow that developed dyspnea following intake and force feeding with concentrate containing propylene glycol (triangles)Figure 1
Oxygen saturation (sO
2
) of arterial blood haemo-
globin in two cows that did not show clinical reaction
to concentrate containing propylene glycol (circle)
and in one cow that developed dyspnea following
intake and force feeding with concentrate containing
propylene glycol (triangles).
Time relative to feeding, h
-0.5 1.5 3.5 5.5 7.5 9.5 11.5
Arterial sO
2
0.60
0.65
0.70
0.75
0.80
0.85
0.90
0.95
1.00
Oxygen pressure (pO
2
) of arterial blood in two cows that did not show clinical reaction to concentrate containing pro-pylene glycol (circle) and in one cow that developed dyspnea following intake and force feeding with concentrate contain-ing propylene glycol (triangles)Figure 2
Oxygen pressure (pO
2
) of arterial blood in two cows
that did not show clinical reaction to concentrate
containing propylene glycol (circle) and in one cow
that developed dyspnea following intake and force
feeding with concentrate containing propylene glycol
(triangles).
Time relative to feeding, h
-0.5 1.5 3.5 5.5 7.5 9.5 11.5
Arterial pO
2
,
(mmHg)
20
40
60
80
100
120
Carbon dioxide pressure (pCO
2
) of arterial blood in two cows that did not show clinical reaction to concentrate con-taining propylene glycol (circle) and in one cow that devel-oped dyspnea following intake and force feeding with concentrate containing propylene glycol (triangles)Figure 3
Carbon dioxide pressure (pCO
2
) of arterial blood in
two cows that did not show clinical reaction to con-
centrate containing propylene glycol (circle) and in
one cow that developed dyspnea following intake and
force feeding with concentrate containing propylene
glycol (triangles).
Time relative to feeding, h
-0.5 1.5 3.5 5.5 7.5 9.5 11.5
Arterial pCO
2
,
(mmHg)
34
36
38
40
42
44
46
48
Acta Veterinaria Scandinavica 2009, 51:25 />Page 5 of 9
(page number not for citation purposes)
metabolite profiles obtained on plasma samples obtained
from the different cows but at the same sampling time
were analysed. Figure 5 shows the
1
H CPMG NMR metab-
olite profile obtained on arterial plasma samples obtained
0.5 h after feeding with PG. The same metabolites were
present in all arterial plasma samples. However, the
plasma spectrum of the cow that responded abnormally
to PG was characterized by lower intensities of signals
assigned to isopropanol and isobutyrate (1.17 ppm), β-
hydroxybuturate (1.22 ppm), acetate (1.93 ppm), acetone
(2.22 ppm) and acetoacetate (3.38 ppm) compared with
the plasma spectra from the two control cows (Figure 5).
In NMR spectra of arterial plasma samples obtained 1.5 h
or later after feeding the difference in the intensity of the
signal assigned to acetate (1.93 ppm) between cows had
disappeared, and the differences in the intensities of the
other metabolites found to differ 0.5 h after feeding like-
wise diminished and disappeared with increasing time
after feeding. An identical pattern was observed in the
NMR spectra of portal plasma samples (data not shown).
Independent of sampling time and plasma type, a higher
intensity of the characteristic broad signals arising from
lipids (~0.9, 1.25 and 2.02 ppm) was observed in
1
H NMR
spectra of plasma from the cow responding abnormally to
PG compared with the two control cows.
Ruminal fluid
For an elucidation of the main variations in the serial
ruminal fluid metabolite profiles, PCA was performed on
the NMR spectra. Noticeably, a clear separation of all
Principal component analysis score plot showing the two first principal components (PCs) for (A) arterial, and (B) portal plasma samplesFigure 4
Principal component analysis score plot showing the two first principal components (PCs) for (A) arterial, and
(B) portal plasma samples. Labels on axes show how much of the variation in the data that is explained by the PCs. Sample
id: The two normal cows are represented by 'O', while the cow responding abnormally to PG is represented by 'X'. Subscript
in sample id shows sampling time in hours after feeding, "pre" representing samples obtained before feeding.
Acta Veterinaria Scandinavica 2009, 51:25 />Page 6 of 9
(page number not for citation purposes)
ruminal fluid samples obtained 1.5 h after feeding or later
from the cow responding abnormally to PG was seen
along the first component (Figure 6). For a more compre-
hensive analysis of metabolic differences at distinct sam-
pling times, the
1
H NMR metabolite profiles obtained on
ruminal fluid samples obtained from the different cows
but at the same sampling time were analysed. Compari-
son of the NMR spectra of ruminal fluid samples obtained
0.5 h after feeding revealed significantly lower intensities
of signals assigned to isopropanol and isobutyrate (1.18
ppm), lactate (1.38 ppm and 4.35 ppm), acetate (2.08
ppm), acetone (2.63 ppm) and citrate (2.88, 2.90, 3.04
and 3.06 ppm) in the metabolite profile of the cow
responding abnormally to PG compared with the two
control cows (Figure 7). In addition, the NMR spectrum of
the ruminal fluid sample obtained 0.5 h after feeding
from the cow responding abnormally to PG was also char-
acterized by lower intensities of several small peaks in the
region ~3.4–4.4 ppm, which is tentatively assigned to var-
ious small esters and alcohols. In addition, the NMR spec-
trum of the ruminal fluid sample obtained 0.5 h after
feeding from the cow responding abnormally to PG was
characterised by a lower intensity of a signal at 3.3 ppm,
which is tentatively assigned to the methyl group in
methyl acetate. The NMR spectra of ruminal fluid samples
obtained 1.5 h and 2.5 h after feeding showed a pro-
nounced increase in intensities of signals assigned to pro-
panol (0.90, 1.55 and 3.55 ppm) for the cow responding
abnormally to PG compared with the two control cows
(Figure 8).
Discussion
Examples of PG-induced toxicosis have been reported in
ruminants [4] and other animals [10-13]. However, these
animals have rarely been further examined, and the
molecular mechanisms causing the abnormal response
are unknown. In the present study PG was applied in a
pelleted concentrate and the effects of PG cannot be sepa-
rated from the effects of other ingredients as such. How-
ever, the observed clinical signs of the cow that responded
badly to the ration are in good agreement with the reports
1
H CPMG NMR spectra obtained on arterial plasma samples obtained 0.5 h after feeding from the two control cows (a+b) and the cow responding abnormally to propylene glycol (PG)-induced toxicosis (c)Figure 5
1
H CPMG NMR spectra obtained on arterial plasma
samples obtained 0.5 h after feeding from the two
control cows (a+b) and the cow responding abnor-
mally to propylene glycol (PG)-induced toxicosis (c).
The arrows indicate the signals that are lower in intensity in
the cow responding abnormally to PG supplementation com-
pared with the two control cows: 1: isopropanol/isobutyrate,
2: β-hydroxybutyrate, 3:acetate, 4: acetoacetate, and 5: ace-
tone.
Principal component analysis score plot showing the two first principal components for ruminal fluid samplesFigure 6
Principal component analysis score plot showing the
two first principal components for ruminal fluid sam-
ples. Labels on axes show how much of the variation in the
data that is explained by the PCs. Sample id: The two normal
cows are represented by 'O', while the cow responding
abnormally to propylene glycol is represented by 'X'. Sub-
script in sample id shows sampling time in hours after feed-
ing, "pre" representing samples obtained before feeding.
Acta Veterinaria Scandinavica 2009, 51:25 />Page 7 of 9
(page number not for citation purposes)
from farmers, extension personnel, and veterinarians on
reaction to introduction of PG containing concentrates in
dairy herds. Accordingly, evidence exists that the inci-
dence under investigation is PG toxicosis; however, it can-
not be ruled out at present if other dietary components
contributed to the incidence.
The oximetry data together with the clinical picture sug-
gests that the hypoxia of the affected cow was caused by
decreased gas exchange between the pulmonary alveoli
and the blood and not caused by changes in oxygen affin-
ity of haemoglobin (both oxygen tension and saturation
decreased in parallel) and the breathing of the cow
appeared to be both of high frequency and with full
depth. The condition of the cow could be caused by pul-
monary vasoconstriction (brisket disease) similar to the
response of cattle seen at high altitude [14]. However it is
unlikely that PG itself induced the pulmonary vasocon-
striction because high plasma concentrations of PG have
been attained in previous studies without any apparent
effects on the cows [2,15].
The present investigation is the first to report the use of
1
H
NMR-based metabolic profiling in the study of PG metab-
olism and toxicity. High-resolution
1
H NMR spectra could
be obtained in both ruminal fluid and plasma samples,
enabling the detection of several metabolites. PCA on the
serial metabolite profiles revealed differences between the
abnormal cow and the two control cows both in ruminal
fluid, arterial and portal plasma samples. Accordingly,
data indicated that the PG-induced toxicosis was associ-
ated with a different metabolic response to the feeding.
Further analysis of the metabolite profiles of the ruminal
samples revealed that this abnormal response was
reflected in lower contents of isopropanol, isobutyrate,
lactate, acetate, acetone, citrate and some unidentified,
smaller esters and alcohols in the ruminal fluid shortly
(0.5 h) after feeding. However, the lower concentrations
as compared with the control cows could indicate a gen-
1
H NMR spectra obtained on ruminal fluid samples obtained 0.5 h after feeding from the two control cows (a+b) and the cow responding abnormally to propylene glycol (PG) (c)Figure 7
1
H NMR spectra obtained on ruminal fluid samples
obtained 0.5 h after feeding from the two control
cows (a+b) and the cow responding abnormally to
propylene glycol (PG) (c). The arrows indicate the signals
that are lower in intensity in the cow responding abnormally
to PG supplementation compared with the two control
cows: 1: isopropanol/isobutyrate, 2: lactate, 3: acetate, 4: ace-
tone, 5: citrate, 6: methyl acetate, 7: various smaller esters
and alcohols.
1
H NMR spectra obtained on ruminal fluid samples obtained 2.5 h after feeding from the two control cows (a+b) and the cow responding abnormally to propylene glycol (PG) (c)Figure 8
1
H NMR spectra obtained on ruminal fluid samples
obtained 2.5 h after feeding from the two control
cows (a+b) and the cow responding abnormally to
propylene glycol (PG) (c). The arrows show signals that
have been assigned to propanol. The signals from propanol
are considerably higher in intensity in the cow responding
abnormally to PG compared with the two control cows.
Acta Veterinaria Scandinavica 2009, 51:25 />Page 8 of 9
(page number not for citation purposes)
eral decrease in microbial fermentation in the rumen.
Later in the course corresponding to 1.5–2.5 h after feed-
ing, the
1
H NMR spectra of ruminal fluid from the cow
responding abnormally to the ration were characterized
by considerably higher intensities of signals ascribed to
propanol. However, also propanol has previously been
observed in high ruminal and plasma concentrations
without affecting the cows [2].
1
H NMR spectroscopy of the plasma samples revealed that
the cow that responded abnormally to PG was character-
ized by a lower content of isopropanol, isobutyrate, β-
hydroxybuturate, acetate, acetone and acetoacetate
shortly after feeding (0.5 h) compared with the respective
arterial and portal plasma samples from the two control
cows. However, the lower concentrations as compared
with the control cows is likely caused by reduced fermen-
tation activity in the rumen in combination with reduced
absorption because of ruminal atony.
In addition to these differences in the concentration of
low-molecular-weight metabolites, the
1
H NMR spectra
also revealed a higher lipid content in plasma of the cow
responding abnormally to PG compared with the control
cows. This is very unlikely an effect of PG, as it was also
present in the samples obtained before feeding. In con-
trast, the higher lipid content in plasma of the cow
responding abnormally to PG probably reflects a natural
variation. It remains unknown if the higher plasma lipid
content is associated with a higher susceptibility for devel-
opment of PG toxicosis.
Beside lower concentrations of common metabolites/fer-
mentation products in ruminal fluid and plasma samples
immediately after feeding, the NMR spectra could not
reveal the presence of any "extraordinary" or unusual
metabolites in the biofluids of the cow developing toxico-
sis. It has recently been suggested that sulphur-containing
compounds produced during fermentation of PG could
be the cause of side effects [16]. We observed no indica-
tions of the presence of sulphur-containing compounds
in the NMR spectra. Plausible explanations for the lack of
detection in the NMR spectra exist, as the compounds are
volatile or present in concentrations below the detection
limit of NMR. It has recently been established that H
2
S is
an important signalling substance in hypoxic vasocon-
striction in vertebrates including cattle [17]. Therefore sul-
phur compounds or specifically H
2
S appear as promising
candidates for explaining the link between PG application
to the rumen and the dyspnea of the cow.
Conclusion
The present study showed that the symptoms of PG-toxi-
cosis are likely to be caused by pulmonary vasoconstric-
tion, however, it was not possible to identify the
metabolites inducing the response by use of
1
H NMR
spectroscopy.
Competing interests
The authors declare that they have no competing interests.
Authors' contributions
HCB carried out the NMR measurements, analysis and
interpretation of NMR data, and drafted the manuscript.
BP and JD participated in the NMR measurements, analy-
sis and interpretation of NMR data. NBK and ML were
responsible for the experimental part carried out on the
cows and helped substantially to draft the manuscript.
NBK, ML and BMR all participated in the observational
study, the oximetric measurements and sampling. All
authors read and approved the final manuscript.
Acknowledgements
The Danish Technology and Production Research Council (FTP; NMR-
based metabonomics on tissues and biofluids #274-05-339) and the Danish
Cattle Federation are acknowledged for financial support of the study. The
800 MHz spectra were obtained using the Bruker 800 spectrometer of the
Danish Instrument Center for NMR Spectroscopy of Biological Macromol-
ecules. The Weipass and MetaSmart were provided from Raiffeisen Haupt-
genossenschaft Nord AG, Kiel, Germany, and Adisseo, Antony, France,
respectively.
References
1. Johnson RB: The treatment of ketosis with glycerol and pro-
pylene glycol. Cornell Vet 1954, 44:6-21.
2. Kristensen NB, Raun BML: Ruminal and intermediary metabo-
lism of propylene glycol in lactating Holstein cows. J Dairy Sci
2007, 90:4707-4717.
3. Nielsen NI, Ingvartsen KL: Propylene glycol for dairy cows. A
review of the metabolism of propylene glycol and its effects
on physiological parameters, feed intake, milk production
and risk of ketosis. Anim Feed Sci Technol 2004, 115:191-213.
4. Hindhede J: Propylene glycol for diary cows around calving [in
Danish] Report. Statens Husdyrbrugsforsøg 1976, 146:1-4.
5. Charlton AJ, Jones S, Heasman L, Davis AM, Dennis MJ: Scrapie
infection alters the distribution of plasma metabolites on dis-
eased Cheviot sheep indicating a change in energy metabo-
lism. Res Vet Sci 2006, 80:275-280.
6. Huntington GB, Reynolds CK, Stroud BH: Techniques for measur-
ing blood flow in splanchnic tissues of cattle. J Dairy Sci 1989,
72:1583-1595.
7. Kristensen NB, Storm A, Raun BML, Røjen BA, Harmon DL: Metab-
olism of silage alcohols in lactating dairy cows. J Dairy Sci.
2007, 90(3):364-1377.
8. Bertram HC, Kristensen NB, Malmendal A, Nielsen NC, Bro R,
Andersen HJ, Harmon DL: A metabolomic investigation of
splanchnic metabolism using
1
H NMR spectroscopy of
bovine blood plasma. Anal Chim Acta 2005, 536:1-6.
9. Esbensen K: Multivariate data analysis: an introduction to
multivariate data analysis and experimental design. CAMO
AS publ; 2001.
10. Dorman DC, Haschek WM: Fatal propylene glycol toxicosis in a
horse. J Am Vet Med Assoc 1991, 198:1643-1644.
11. McClanahan S, Hunter J, Murphy M, Valberg S: Propylene glycol
toxicosis in a mare. Vet Hum Toxicol 1998, 40:294-296.
12. Ivany JM, Anderson DE: Propylene glycol toxicosis in a llama. J
Am Vet Med Assoc 2001, 218:243-244.
13. Moon F: Acute toxicosis in 2 dogs associated with etomidata-
proylene glycol infusion. Lab Anim Sci 1994, 44:590-594.
14. Hecht HH, Kuida RL, Lange JL, Thorne AM, Brown R, Carlisle A, Ruby
A, Ukradyha F: Brisket disease. II. clinical features and hemo-
Publish with Bio Med Central and every
scientist can read your work free of charge
"BioMed Central will be the most significant development for
disseminating the results of biomedical research in our lifetime."
Sir Paul Nurse, Cancer Research UK
Your research papers will be:
available free of charge to the entire biomedical community
peer reviewed and published immediately upon acceptance
cited in PubMed and archived on PubMed Central
yours — you keep the copyright
Submit your manuscript here:
/>BioMedcentral
Acta Veterinaria Scandinavica 2009, 51:25 />Page 9 of 9
(page number not for citation purposes)
dynamic observations in altitude-dependent right heart fail-
ure of cattle. Am J Med 1962, 32:171-183.
15. Kristensen NB, Danfær A, Røjen BA, Raun B-ML, Weisbjerg MR,
Hvelplund T: Metabolism of propionate and 1,2-propanediol
absorbed from the washed reticulorumen of lactating cows.
J Anim Sci 2002, 80:2168-2175.
16. Trabue S, Scoggin K, Tjandrakusuma S, Rasmussen MA, Reilly PJ:
Ruminal fermentation of propylene glycol and glycerol. J
Agric Food Chem 2007, 55:7043-7051.
17. Olson KR, Dombkowski RA, Russell MJ, Doellman MM, Head SK,
Whitfield NL, Madden JA: Hydrogen sulfide as an oxygen sensor/
transducer in vertebrate hypoxic vasoconstriction and
hypoxic vasodilation. J Exp Biol 2006, 209:4011-4023.