Báo cáo y học: "Effects of contrast material on computed tomographic measurements of lung volumes in patients with acute lung injury" potx
Bạn đang xem bản rút gọn của tài liệu. Xem và tải ngay bản đầy đủ của tài liệu tại đây (145.57 KB, 9 trang )
Available online />Research
Effects of contrast material on computed tomographic
measurements of lung volumes in patients with acute lung injury
Bélaid Bouhemad
1
, Jack Richecoeur
2
, Qin Lu
3
, Luiz M Malbouisson
4
, Philippe Cluzel
5
,
Jean-Jacques Rouby
6
and the ARDS CT Scan Study Group
7
1
Chef de Clinique en Réanimation Chirurgicale Pierre Viars (Department of Anaesthesiology), Hospital Pitié-Salpêtrière, University of Paris VI, Paris,
France
2
Praticien Hospitalier en Réanimation Médicale Polyvalente de Pontoise, Pontoise, France
3
Praticien Assistant Contractuel en Réanimation Chirurgicale Pierre Viars (Department of Anaesthesiology), Hospital Pitié-Salpêtrière, University of
Paris VI, Paris, France
4
Research fellow, Department of Anaesthesiology, Hospital das Clinicas, São Paulo, Brazil
5
Professor of Radiology, Department of Radiology, Hospital Pitié-Salpêtrière, University of Paris VI, Paris, France
6
Professor of Anaesthesia and Critical Care, Réanimation Chirurgicale Pierre Viars, and Director of Research, Hospital Pitié-Salpêtrière, University of
Paris VI, Paris, France
7
See acknowledgement
Correspondence: Pr J. J. Rouby,
Introduction
Since the early 1990s, spiral computed tomography (CT)
scanners have permitted assessment of the entire pulmonary
parenchyma in a very short period of time [1–3]. In patients
with acute lung injury (ALI) injection of contrast material is
considered useful for differentiating consolidated lung
parenchyma from pleural effusion and for diagnosing lung
63
ALI = acute lung injury; CT = computed tomography; HU = Hounsfield units.
Abstract
Background Intravenous injection of contrast material is routinely performed in order to differentiate
nonaerated lung parenchyma from pleural effusion in critically ill patients undergoing thoracic
computed tomography (CT). The aim of the present study was to evaluate the effects of contrast
material on CT measurement of lung volumes in 14 patients with acute lung injury.
Method A spiral thoracic CT scan, consisting of contiguous axial sections of 10 mm thickness, was
performed from the apex to the diaphragm at end-expiration both before and 30 s (group 1; n = 7) or
15 min (group 2; n = 7) after injection of 80 ml contrast material. Volumes of gas and tissue, and
volumic distribution of CT attenuations were measured before and after injection using specially
designed software (Lungview
®
; Institut National des Télécommunications, Evry, France). The maximal
artifactual increase in lung tissue resulting from a hypothetical leakage within the lung of the 80 ml
contrast material was calculated.
Results Injection of contrast material significantly increased the apparent volume of lung tissue by
83 ± 57 ml in group 1 and 102 ± 80 ml in group 2, whereas the corresponding maximal artifactual
increases in lung tissue were 42 ± 52 ml and 31 ± 18 ml.
Conclusion Because systematic injection of contrast material increases the amount of extravascular
lung water in patients with acute lung injury, it seems prudent to avoid this procedure in critically ill
patients undergoing a thoracic CT scan and to reserve its use for specific indications.
Keywords acute lung injury, contrast material, lung volumes, thoracic computed tomography scan
Received: 2 February 2002
Revisions requested: 18 April 2002
Revisions received: 24 July 2002
Accepted: 4 November 2002
Published: 16 December 2002
Critical Care 2003, 7:63-71 (DOI 10.1186/cc1852)
This article is online at />© 2003 Bouhemad et al., licensee BioMed Central Ltd
(Print ISSN 1364-8535; Online ISSN 1466-609X). This is an Open
Access article: verbatim copying and redistribution of this article are
permitted in all media for any non-commercial purpose, provided this
notice is preserved along with the article's original URL.
Open Access
64
Critical Care February 2003 Vol 7 No 1 Bouhemad et al.
abscess. It is also required for diagnosis of pulmonary
embolism. As a consequence, injection of contrast material is
routinely performed in critically ill patients undergoing a tho-
racic CT scan [4,5].
In the presence of alterations in the blood–brain barrier, injec-
tion of contrast material increases brain oedema [6–9]. This
is due to the direct toxic effects of the contrast material on
nerve cells [10], which result from its osmotic effect after
intracellular penetration. Similarly, in ALI breakdown of the
constituents of the alveolar–capillary barrier (pulmonary
epithelium or capillary endothelium) causes an increase in
lung permeability, which is accompanied by interstitial and
alveolar accumulation of water and proteins [11]. Alteration in
the alveolar–capillary barrier could also promote leakage of
contrast material into the interstitial and alveolar spaces, with
a consequent increase in extravascular lung water. Using CT,
the latter may be measured as an increase in lung tissue.
However, administration of contrast material creates a density
artifact that may lead to an overestimation of lung tissue. The
aim of the present study was to evaluate the effects of intra-
venous injection of contrast material on CT measurement of
volumes of gas and lung tissue in patients with ALI, and to
test the hypothesis that administration of contrast material
increases extravascular lung water. In addition, in order to
estimate the range of error in determining lung tissue that
results from administration of contrast material, a ‘lung
phantom’ was filled with known volumes of water containing
increasing concentrations of contrast material and was
scanned to compare the calculated increases in volume of
water with the actual instilled volume.
Materials and method
Patients
Fourteen patients hospitalized in the Surgical Intensive Care
Unit of La Pitié-Salpétrière for ALI were prospectively studied
[12]. Inclusion criteria were as follows: a ratio of arterial
oxygen tension to fractional inspired oxygen of less than
300 mmHg at zero end-expiratory pressure; bilateral hyper-
densities on a bedside chest radiogram; and pulmonary capil-
lary wedge pressure below 18 mmHg and/or left ventricular
ejection fraction greater than 50%, as estimated by trans-
oesophageal echocardiography. Informed consent was
obtained from the patients’ next of kin. In each patient, a tho-
racic CT scan with injection of contrast material was indi-
cated clinically for diagnosing lung abscess, pulmonary
embolism or pleural effusion.
Spiral thoracic computed tomography scan: technical
characteristics
Each patient was transported to the Department of Radiology
(Thoracic Division) by two experienced physicians. Patients
were sedated and paralyzed with a continuous intravenous
infusion of 5 µg/kg per hour fentanyl, 0.1 mg/kg per hour
midazolam and 0.05 mg/kg per hour vecuronium. Mechanical
ventilation was provided using an Osiris ventilator (Taema,
Antony, France), which was specifically designed for deliver-
ing 100% oxygen during transportation of critically ill patients.
Electrocardiography, pulse oxymetry and systemic arterial
pressure were monitored continuously using a Propaq 104
EL monitor (Protocol System, North Chicago, IL, USA).
Spiral lung scanning was performed at end-expiration from
the apex to the diaphragm using a Tomoscan SR 7000
(Philips, Eindhoven, The Netherlands). Disconnection from
the ventilator and 15 s apnoea were necessary to obtain the
CT sections, which resulted in a transient desaturation in
most patients, the lowest oxygen saturation measured being
87%. All images were observed and photographed at a
window width of 1600 Hounsfield units (HU) and a level of
–700 HU. The exposures were taken at 120 kV and 250 mA.
The value of the pitch was 1. In the present study, each voxel
had a volume of 1.7 mm
3
. As previously described
[2,3,13,14], we evaluated contiguous axial CT sections
10 mm thick, which were reconstructed from the volumetric
data. On each CT section, right and left lung parenchyma
were delineated using the roller ball of the computer. The
reproducibility of manual delineation was excellent, with
determinations of the overall lung volume by three different
operators showing a maximal difference of 25 ml. The respec-
tive volumes of gas and lung tissue, and the distribution of
lung aeration were compared before and after injection of
contrast material using the Lungview
®
(Institut National des
Télécommunications, Evry, France), as was previously
described [2–4,15].
Two groups of patients were studied; in group 1 (n = 7) CT
sections were acquired before and 30 s after injection of con-
trast material, and in group 2 (n = 7) the CT sections were
obtained before and 15 min after injection of contrast mater-
ial. In both groups, a volume of 80 ml of contrast material
(iobitridol; Xenetix 350, Guerbet, Roissy, France) was auto-
matically injected into the superior vena cava at a constant
flow of 4 ml/s. In one patient, CT sections acquired 30 s after
the injection of contrast material were repeated 15 min later.
Computed tomography measurement of lung volumes
and blood density
Apparent lung volumes of gas and tissue
CT scans obtained before and after injection of contrast
material were analyzed using specially designed software
(Lungview
®
), which is based on the tight correlations that
exist between radiological and physical densities [16].
Before and after injection of contrast material, the analysis
was performed according to the following principles. The CT
number characterizing each individual voxel is expressed in
HU and is defined as the attenuation coefficient of the radio-
gram by the material being studied minus the attenuation
coefficient of water divided by the attenuation coefficient of
water. By convention, the CT number of water is 0 (HU). The
CT number is scaled by a factor 1000, the CT number of gas
65
being –1000 HU. A lung area characterized by a mean CT
number of –500 HU is considered to be composed of 50%
gas and 50% tissue. A lung area characterized by a mean CT
number of –200 HU is considered to be composed of 20%
gas and 80% tissue. Using this analysis, it was possible to
compute the volume of gas and tissue present in the lungs.
In the first step, the distribution of CT numbers was measured
on each CT section for 256 compartments between
–1200 HU and +200 HU, examining an interval of 5.47 HU
per compartment. For each compartment of a known number
of voxels, the total volume and the volume of gas and lung
tissue were computed using the following equations (in which
‘CT’ is the mean CT number of the compartment analyzed):
Volume of the voxel = (size of the pixel)
2
× section thickness (1)
Total volume = number of voxels × volume of the voxel (2)
Apparent volume of gas = (–CT/1000) × total volume,
if the compartment considered has a CT number
below 0 (volume of gas = 0 if the compartment
considered has a CT number above 0) (3)
Apparent volume of tissue = ([1 + CT]/1000) ×
total volume, if the compartment considered has a
CT number below 0 (4)
or, volume of tissue = number of voxels × volume of the
voxel, if the compartment considered has a CT number
above 0 (4′)
In a second step, the volumes of gas and lung tissue of each
region of interest were calculated by adding the values of all of
the compartments present within the region of interest consid-
ered. In a third step, the volumes of gas and lung tissue of
both lungs were calculated by adding the volumes of all lung
regions (right lung + left lung). The total lung volume at end-
expiration was defined as the sum of gas and tissue volumes.
The overall volume of gas present at end-expiration in both
lungs was defined as functional residual capacity.
The distribution of lung tissue along the cephalocaudal axis
was determined in patients by taking into consideration all
10 mm thick CT sections between the apex and the lung
base. The distribution of gas and lung tissue along the
anteroposterior axis was determined on five contiguous
10 mm thick CT sections located around the tracheal carina
(one located at the carina level, and two above and two
below the carina level) by taking into consideration 10 con-
tiguous compartments of similar height between the sternum
and the vertebrae [17].
Maximal artifactual increase in lung tissue
In each patient, blood density was measured in the pulmonary
artery before and after injection of contrast material in order
to determine the concentration of contrast material present in
the pulmonary circulation 30 s and 15 min after injection.
The maximal artifactual increase in lung tissue was calculated
as follows. First, it was hypothesized that the 80 ml contrast
material had penetrated into the alveolar–interstitial compart-
ment and had created a gas–contrast material interface. It
was assumed that the alveolar–interstitial contrast material
concentration was equal to the concentration measured
within pulmonary arteries, a positive concentration gradient
between extravascular and vasular spaces being very unlikely.
The new CT number of the lung parenchyma (CT
new
) was
then calculated as follows:
(CT
control
× volume
tot control
) + (80 × CT
blood inj
)
CT
new
= (5)
volume
tot control
+ 80
Where CT
control
= mean CT number of the lung parenchyma
before injection, volume
tot control
= total lung volume before
injection, and CT
blood inj
= CT number of the pulmonary artery
following injection. The apparent volume of lung tissue follow-
ing injection (V
tissue
1) would have been calculated as follows:
V
tissue
1 = ([1 + CT
new
]/1000) × volume
tot inj
(6)
Where volume
tot inj
= total lung volume following injection. If
the 80 ml contrast material had been replaced by 80 ml
plasma, then the new CT number (CT
80
) and the calculated
volume of lung tissue (V
tissue
2) would have been:
(CT
control
× (volume
tot control
) + (80 × CT
blood control
)
CT
80
= (7)
volume
tot control
+ 80
V
tissue
2 = ([1 + CT
80
]/1000) × volume
tot inj
Where CT
blood control
= CT number of the pulmonary artery
before injection. The maximal artifactual increase in lung
tissue following the injection of contrast material was then
calculated as V
tissue
1–V
tissue
2, and the minimal actual
increase in lung tissue as the apparent increase in lung tissue
minus the maximal artifactual increase in lung tissue.
Preparation of the human lung phantom
The error resulting from the presence of contrast material in
the determination of gas and lung tissue volumes was
assessed on a lung phantom that was prepared according to
a technique proposed by Markarian and Dailey in 1975
[18,19]. This simple and easily implemented method is aimed
at producing a lung specimen that can be stored for over
10 years without damage [20] and is suitable for histopathol-
ogy, radiography and CT examinations.
In 1993, a postmortem left pneumonectomy was performed
in a 65-year-old man who died from acute respiratory distress
Available online />66
syndrome complicating postoperative bronchopneumonia
5 days after surgical resection of a thoracoabdominal aortic
aneurysm. The pneumonectomy was performed according to
the French legislation (law no 781181, December 22, 1976,
followed by the statutory order no 78501 of March 31, 1978
and the implementation order of April 3, 1978) and after
obtaining informed consent from the patient’s relatives. A
thoracotomy was performed in the fifth left intercostal space
at the bedside under surgical conditions within 20 min after
death. After cessation of mechanical ventilation, both lungs
were then removed from the thorax, with the trachea being
sectioned immediately beneath the larynx. After dissection
(carefully avoiding lung laceration), both lungs were sepa-
rated by a tracheal section at the carina level, leaving a long
portion of the left main stem bronchus; the pulmonary vessels
were tied with strings; and the left main stem bronchus was
cannulated with an endotracheal tube no 7.5. The left lung
was then inflated via the endotracheal tube by a fixative com-
posed of polyethylene glycol 400 (25%), ethyl alcohol 95%
(10%), formaldehyde 37% (10%) and water (55%). The fixa-
tive was instilled by gravity at a pressure of 30 cmH
2
O until
the lung surface was firmly distended and small amounts of
fixative were weeping through the pleural surface. The endo-
tracheal tube was clamped in order to prevent loss of fluid,
and the lung specimen was floated in a container filled with
the same fixative for 7 days.
The lung was then suspended from a ring stand over a drip
basin and the endotracheal tube was connected to a source
of air equipped with a continuous positive airway pressure
system set at a pressure of 30 cmH
2
O. The air pressure
causing the fixative to weep from the pleural surface was
maintained over 3 days, and a dry left lung with spongy
texture was obtained. The lung was stored in a hermetically
sealed bag between 1993 and 1999 without detectable
deterioration.
Effects of contrast material on computed tomography
determination of lung volumes
The effect of contrast material on CT determination of gas
and lung tissue volumes was assessed according to a tech-
nique recently described [15].
In a first step, the contrast material was diluted with water
to obtain solutions of increasing concentrations: 0%, 0.1%,
0.5%, 1%, 1.5%, 2% and 5%. The mean CT attenuation
corresponding to each concentration of contrast material
was measured by scanning one reservoir filled with water
and six reservoirs filled with the solutions of increasing con-
centrations. The CT attenuation of pure contrast material
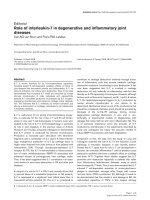
was 3918 HU. As shown in Fig. 1, CT attenuation increased
linearly with the concentration of contrast material in the
solution.
In a second step, assessment of the artifactual changes in
gas and tissue volume in the presence of contrast material
was performed on the lung phantom. The volumes of the dif-
ferent aliquots instilled in the phantom were compared with
the volumes computed using Lungview
®
on the correspond-
ing CT scans. Equation 4 above (which does not take into
consideration the presence of contrast material) was used for
this calculation. Eight CT scans of the human lung phantom
were performed following successive bronchial instillations of
water or solution containing 5% iobitridol. The phantom was
first filled with three aliquots of water (50, 100 and 150 ml)
administered into the left mainstem bronchus. After each
aliquot, the phantom was weighed using an electronic scale
(Teraillon BE 201, Paris, France). The phantom was then
dried with a hair drier until its weight returned to the initial dry
weight. One week later, the phantom was filled with three
aliquots of a solution containing 5% of iobitridol and weighed
after each aliquot.
The volume of each aliquot of water was equivalent to its
weight (physical density = 1 mg/ml). The volume of each
aliquot (W
aliq
) containing 5% contrast material was lower
than its weight (physical density = 1.2 g/ml). As a conse-
quence, the volume of the aliquot (V
aliq
) was calculated as
V
aliq
= 0.943. W
aliq
. The volume of each aliquot measured
from its weight was then compared with the volume of the
aliquot calculated using Lungview
®
.
Statistical analysis
Results are expressed as mean ± SD. Lung volumes before
and after injection of contrast material were compared using
a Wilcoxon test. The measured and Lungview
®
-derived
volumes of aliquots were compared by linear regression
analysis and using the Bland–Altman method [21]. Statistical
analysis was performed using Statview 5.0 (SAS Institute
Inc., Cary, NC, USA), and P < 0.05 was considered statisti-
cally significant.
Critical Care February 2003 Vol 7 No 1 Bouhemad et al.
Figure 1
Changes in computed tomography (CT) attenuation with increasing
concentrations of contrast material in the solution. HU, Hounsfield units.
CT attenuations (HU)
Concentration of contrast material (%
)
0123456
0
100
200
300
400
500
600
Y = 35.3 + 95.3X
R = 0.998, P < 0.0001
67
Results
Patients
The clinical and respiratory characteristics of the 14 patients
are summarized in Table 1. No statistically significant differ-
ences were found between the two groups. Patients were
admitted for ALI complicating major vascular surgery (n = 7),
oesophageal surgery (n = 1) and multiple trauma (n = 6). All
patients except one were receiving norepinephrine (noradren-
aline) for septic shock. Eight patients met criteria for acute
respiratory distress syndrome [22].
Effects of injection of contrast material on volumes of
gas and lung tissue
Table 2 shows the CT number of pulmonary arteries before
and after injection of contrast material. The pulmonary arterial
concentration of contrast material ranged between 0.3% and
2% at 30 s after the injection, and between 0% and 0.07% at
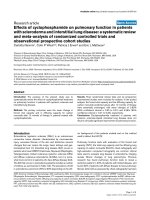
15 min after the injection. Fig. 2 shows three representative
CT sections acquired in one patient at baseline, and 30 s and
15 min following injection of contrast material. Pulmonary
vessels were opacified by contrast material only on the CT
sections taken 30 s after injection, whereas lung parenchyma
was opacified on CT sections taken 30 s and 15 min after
injection. The corresponding apparent volumes of lung tissue
were 1445 ml (baseline), 1555 ml (30 s) and 1553 ml
(15 min).
As shown in Table 3, injection of contrast material increased
the apparent volume of lung tissue by 83 ± 57 ml in group 1
(P = 0.02) and 102 ± 80 ml in group 2 (P = 0.01), whereas
the apparent volume of gas decreased by 86 ± 102 ml in
group 1 (P = 0.03) and 90 ± 48 ml in group 2 (P = 0.02).
Total lung volume remained unchanged in both groups. The
changes in apparent lung tissue volumes between the two
groups did not reach statistical significance (P = 0.06).
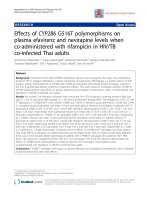
As shown in Fig. 3, the individual increase in lung tissue
volume was variable from one patient to another, ranging from
2% to 20% and with mean changes of 8 ± 6% in group 1
and 7 ± 5% in group 2. Thirty seconds after the injection, the
maximal artifactual increase in lung tissue represented
39 ± 35% of the apparent increase in lung tissue (extremes 0
Available online />Table 1
Clinical and respiratory characteristics of the 14 patients with acute lung injury
Patient no Age/sex Cause of ALI Lung morphology* Outcome SAPS II LISS PaO
2
: FiO
2
(mmHg)
Group 1
1 67/M BPN LA D 42 1.7 176
2 34/M PC PA S 55 3.5 262
3 81/M BPN LA D 44 1.7 292
4 54/M BPN PA S 16 2.0 205
5 68/M BPN LA S 27 1.7 132
6 67/M BPN LA S 46 1.5 238
7 74/M BPN LA D 64 1.66 164
Mean ± SD 64 ± 15 42 ± 16 2.0 ± 0.7 210 ± 57
Group 2
8 72/M BPN LA S 79 1.5 250
9 49/M PC PA S 22 2.3 250
10 22/M BPN LA S 24 2 136
11 48/M BPN LA D 49 2 139
12 41/M BPN LA S 29 1.66 182
13 35/M BPN PA D 74 2.75 150
14 69/M BPN LA D 27 2.33 160
Mean ± SD 42 ± 18 43 ± 24 2.1 ± 0.4 181± 49
In group 1 computed tomography (CT) sections were acquired before and 30 s after injection of contrast material, and in group 2 the CT sections
were obtained before and 15 min after injection of contrast material. *The morphological CT pattern is classified into lobar (LA) and patchy (PA) CT
attenuations, according to the definitions reported by Puybasset and coworkers [4]. BPN, ventilator associated bronchopneumonia; D, died; F,
female; FiO
2
, fractional inspired oxygen; LISS, Lung Injury Severity Score; M, male; PaO
2
, arterial oxygen tension; S, survived; SAPS II, Simplified
Acute Physiological Score.
68
and 85%). Fifteen minutes after the injection, the maximal arti-
factual increase in lung tissue represented 45 ± 43% of the
apparent increase in lung tissue (extremes 6 and 100%).
Effects of contrast material on computed tomography
lung volume determination
As shown in Fig. 4, a close correlation was found between
the measured volumes of aliquots and the volumes of aliquots
calculated using Lungview
®
. The mean bias and precision
were –0.7 and 9 ml when the fixed lung model was instilled
with water, and –8.8 and 3.8 ml when a solution containing
5% of contrast material was instilled, respectively. The pres-
ence of contrast material in the aliquots was associated with
an 8% overestimation of the liquid volume by Lungview
®
.
Discussion
The present study shows an increase in the volume of lung
tissue at 30 s and at 15 min after injection of contrast material
in patients with ALI. This finding probably results from a true
increase in extravascular lung water and from an artifactual
increase in lung density caused by the intrapulmonary diffu-
sion of contrast material. The former effect, which is not
observed when the lungs are healthy [2], probably depends
on alteration in the alveolar–capillary barrier that promotes
extravascular leakage of contrast material.
The accuracy of Lungview
®
for measuring lung tissue volume
was recently assessed by instilling known volumes of water
and albumin into a fixed spongy textured human lung
phantom [15]. In the present study, using the same model,
we found that the administration of solutions containing 5%
of contrast material resulted in an 8% artifactual overestima-
tion of lung tissue volume. A 5% concentration was chosen
to mimic clinical conditions; as shown in Fig. 2, pulmonary
vessels and lung parenchyma were opacified 30 s after injec-
tion of contrast material, and CT attenuations measured in
pulmonary arteries corresponded to low concentrations of
contrast material ranging between 0.3% and 2%. In six
patients the apparent increase in lung tissue was either
below or slightly greater than 8% of the preinjection lung
tissue volume, and could therefore be artifactual. However,
the concentration of contrast material was less than 2% in all
patients, and we calculated the maximal artifactual increase in
lung tissue that would have resulted from a total leakage of
the contrast material into the lung parenchyma. As shown in
Table 4 and Fig. 3, after eliminating the maximal artifactual
Critical Care February 2003 Vol 7 No 1 Bouhemad et al.
Table 2
Pulmonary arterial computed tomography attenuations before
and after injection of contrast material in the two groups of
patients
Mean CT Mean CT Pulmonary
attenuation attenuation concentration
before after of contrast
injection injection material
Patient no (HU) (HU) (%)
Group 1 (30 s after injection)
1 31 245 1.9
2 45 218 1.8
3 49 110 0.3
4 49 169 1.2
5 36 265 2
6 43 146 0.7
7 46 219 1.4
Mean ± SD 43 ± 7 196 ± 56 1.3 ± 0.8
Group 2 (15 min after injection)
8 43 83 0.005
962 67 0
10 25 60 0
11 21 60 0
12 39 55 0
13 65 75 0
14 30 72 0.07
Mean ± SD 41 ± 17 67 ± 10 0.02 ± 0.002
CT, computed tomography; HU, Hounsfield units.
Figure 2
Three representative mediastinal (upper panels) and parenchymal
(lower panels) windows of computed tomography sections obtained
before (baseline), and 30 s and 15 min after injection of contrast
material in one patient. At 30 s, both lung parenchyma and pulmonary
vessels are opacified. At 15 min, contrast material can be observed
only in the lung parenchyma. The black line delineates lung
parenchyma (accentuated contrast after injection of contrast material)
from pleural effusion (same contrast after injection of contrast material).
Baseline 30 sec 15 min
Baseline 30 sec 15 min
69
Available online />Figure 3
Individual percentage of changes in the apparent volume of lung tissue
30 s and 15 min after injection of 80 ml contrast material in patients in
group 1 (upper panel) and group 2 (lower panel). The horizontal line
indicates the mean value of the apparent volume of lung tissue. Black
bars represent individual percentage of maximum artifactual increase in
lung tissue calculated according to the hypothesis that the 80 ml of
contrast material penetrated into the alveolar–interstitial space and
formed an interface with the alveolar gas.
-4
0
4
8
12
16
20
Increase in lung tissue volume (%)
-4
0
4
8
12
16
20
12 3456 7
8 9 10 11 12 13
14
Mean
Mean
Patients
Patients
Table 3
Apparent lung volumes before and after injection of contrast material in the two groups of patients
Patients Before injection After injection P value
Group 1 (30 s after injection)
Total volume (ml) 2546 ± 914 2542 ± 909 NS
Volume of gas (ml) 1444 ± 849 1358 ± 794 0.03
Volume of tissue (ml) 1105 ± 235 1193 ± 245 0.02
Group 2 (15 min after injection)
Total volume (ml) 2801 ± 882 2826 ± 833 NS
Volume of gas (ml) 1415 ± 853 1337 ± 838 0.02
Volume of tissue (ml) 1386 ± 109 1488 ± 157 0.01
The two-way analysis of variance for one within factor (before and after injection of contrast material) and one grouping factor (group 1 and
group 2) showed an absence of interaction between the two groups.
Figure 4
Correlation (left panels) and agreement (right panels) between
volumes of aliquots (V
aliq
) calculated using Lungview
®
and measured
from lung weight after instillation of lung water (upper panels) and a
solution containing 5% of contrast material (lower panels) into the
human lung phantom. In the left panels, the dotted line represents the
identity line and the solid line represents the linear regression line. In
the right panels, the solid line represents the difference between
calculated (using Lungview
®
) and measured (actual) aliquots (bias),
and the dotted lines represents 2 SD (precision of the bias, according
to the Bland–Altman method).
0 50 100 150 200 250 300
V
aliq
(ml) (lungview) (ml)
0
50
100
150
200
250
300
0 50 100 150 200 250 300
-100
-50
0
50
100
Actual Valiq
aliq
–
V
aliq
(lungview) (ml)
Bias: -0.7 ml
Precision: 2.9 ml
V
aliq
(ml)
0 50 100 150 200 250 300
0
50
100
150
200
250
300
0 50 100 150 200 250 300
-100
-50
0
50
100
Bias: -8.8 ml
Precision: 3.8 ml
V
aliq
(ml)
Y = -5.93 + 1.05.X
r=1.00; P < 0.02
Y = 0.75 + 1.08X
r = 1.00; P = 0.01
70
increase in lung tissue, a true increase in the volume of lung
tissue was observed in each individual. It must be pointed out
that the assumption that 100% of the contrast material had
penetrated into the lung parenchyma 30 s after the injection
is unlikely to be valid. As a consequence, the actual increase
in lung tissue was in fact much greater, depending on the
amount of contrast material that penetrated into the lungs. In
healthy volunteers, injection of contrast material did not
produce any detectable modification in the lung tissue
volume calculated using Lungview
®
, probably because the
contrast material remained strictly intravascular in the pres-
ence of an intact alveolar–capillary barrier and was rapidly
eliminated in the urine [2].
Fifteen minutes after injection pulmonary vessels were no
longer opacified, and CT attenuations measured in pulmonary
arteries corresponded to concentrations of contrast material
of 0.1% or less. In the patients with an apparent increase in
lung tissue of greater than 8% of the preinjection lung tissue
volume, the artifact created by the presence of contrast mate-
rial within the lung parenchyma contributed far less than
25%. In other words, a significant and clinically relevant
increase in lung tissue was observed 15 min after injection of
contrast material in four patients. This increase in lung tissue
volume is probably due to an increase in extravascular lung
water.
The injured lung is characterized by an excessive amount of
extravascular lung water that accumulates in interstitial and
alveolar compartments and by an infiltration of lung structures
by inflammatory cells. Excessive oedema and lung inflamma-
tion are measured as ‘tissue in excess’ by the CT method [4].
In patients ventilated for ALI, variations in lung tissue volumes
and aeration have been observed following changes of posi-
tion or administration of positive end-expiratory pressure
[5,23–25]. In patients with chronic renal failure, haemodialy-
sis-induced decrease in intravascular and extravascular water
is associated with a decrease in lung CT attenuation [26]. In
the present study, injection of contrast material shifted the
volumic distribution of CT attenuation toward higher values,
suggesting an increase in extravascular lung water. A number
of elements support a true increase in the volume of extravas-
cular lung water rather than a simple density artifact resulting
from the presence of contrast material in the vascular space.
First, the increase in volume of lung tissue that was observed
30 s after injection of contrast material persisted 15 min later,
although the concentrations of contrast material decreased
below 0.1%, thereby creating a negligible density artifact that
is unable to account for the persisting increase in lung tissue.
Second, the mean increase in the volume of lung tissue was
10-fold greater than the expected increase in pulmonary
blood volume resulting from injection of 80 ml contrast mater-
ial. Third, the majority of patients had an ALI characterized by
a lobar CT attenuation pattern with a large predominance of
nonaerated lung tissue. Accordingly, the increase in lung
tissue was computed for a good part as the additional
number of voxels with a CT attenuation greater than 0. Con-
sequently, the increase in CT attenuation resulting from the
intraparenchymal diffusion of contrast material could not be
the cause of a major artifactual increase in lung tissue in non-
aerated lung regions. Indeed, counting a voxel with a CT
attenuation equal to 0 or +500 HU has the same significance
as a lung area with a mean CT attenuation close to 0.
The amplitude of the increase in lung tissue was variable from
one patient to another, depending on the relative importance
of the artifactual increase in lung density and the true
increase in extravascular lung water. In fact, our findings
partly invalidate a statement that we made in a previous study
[2] that the injection of contrast material does not influence
the distribution of CT numbers in ALI; this statement is true in
healthy volunteers but it does not apply to patients with ALI.
Although we did not assess the clinical relevance of the mea-
sured increase in lung tissue, it appears prudent to restrict
the indication of CT scans with contrast to specific indica-
tions such as diagnosis of pulmonary embolism. Based on
the potential of contrast material to worsen the respiratory
Critical Care February 2003 Vol 7 No 1 Bouhemad et al.
Table 4
Individual increases in lung tissue volumes following injection
of contrast material in the two groups of patients
Maximum Minimum
Apparent artifactual actual
increase in increase in increase in
lung tissue lung tissue lung tissue
Patient no (ml) (ml) (ml)
Group 1 (30 s after injection)
127027
2312110
338236
4744331
5 139 70 69
6961482
7 173 146 27
Mean ± SD 83 ± 57 42 ± 52 40 ± 26
Group 2 (15 min after injection)
824370
932266
10 77 57 19
11 108 9 99
12 107 11 96
13 100 26 74
14 266 48 218
Mean ± SD 102 ± 80 31 ± 18 73 ± 76
71
condition of patients with ALI, its administration to assist in
differentiating between lung consolidation and pleural effu-
sion does not appear justified.
Competing interests
None declared.
Acknowledgement
The following members of the CT scan ARDS Study Group partici-
pated in the present study: P Gusman, MD, Department of Anesthesiol-
ogy, UNESP, Botucatu, Brazil; S Vieira, MD, Hospital De Clinicas de
Porto Allegre, UFRGS, Brazil; M Elman, MD, Department of Anesthesi-
ology Faculdade de Ciências Medicas de Santa Casa, São Paulo,
Brazil; L Puybasset, PhD, MD, P Coriat, PhD, MD, MO Roussat, MD, I
Goldstein, MD, A Nieszkowska, MD, Unité de Réanimation Chirurgicale
Pierre Viars, Hôpital de La Pitié-Salpêtrière, Paris, France.
LMM is the recipient of a scholarship provided by the Ministères des
Affaires Etrangères Français (ref 2334471).
References
1. Umamaheswara Rao GS, Gallart L, Law-koune J-D, Lu Q, Puybas-
set L, Coriat P, Rouby JJ: Factors influencing the uptake of
inhaled nitric oxide in patients on mechanical ventilation.
Anesthesiology 1997, 87:823-834.
2. Vieira S, Puybasset L, Richecoeur J, Lu Q, Cluzel P, Gusman P,
Coriat P, Rouby JJ: A lung computed tomographic assessment
of positive end-expiratory pressure-induced lung overdisten-
sion. Am J Respir Crit Care Med 1998, 158:1571-1577.
3. Vieira S, Puybasset L, Lu Q, Richecoeur J, Cluzel P, Coriat P,
Rouby JJ: A scanographic assessment of pulmonary morphol-
ogy in acute lung injury : signification of the lower inflection
point detected on lung pressure-volume. Am J Respir Crit
Care Med 1999, 159:1612-1623.
4. Puybasset L, Cluzel P, Gusman P, Grenier P, Preteux F, Rouby JJ:
Regional distribution of gas and tissue in acute respiratory
distress syndrome. I. Consequences for lung morphology. CT
Scan ARDS Study Group. Intensive Care Med 2000, 26:857-
869.
5. Puybasset L, Gusman P, Muller J-C, Cluzel P, Coriat P, Rouby J-J,
CT scan ARDS study group: Regional distribution of gas and
tissue in acute respiratory distress syndrome – part 3: conse-
quences for the effects of positive end expiratory pressure.
Intensive Care Med 2000, 26:1215-1227.
6. Junck L, Marshal WH: Neurotoxicity of radiological contrast
agents. Ann Neurol 1983, 13:469-484.
7. Junck L, Marshall WH: Fatal brain edema after contrast-agent
overdose. Am J Neuroradiol 1986, 7:522-525.
8. Knof J, Pommer W, Kern D: Permeability disorders of the
blood-brain barrier following intravascular contrast medium
administration in kidney failure [in German]. Rofo Fortschr
Geb Rontgenstr Neuen Bildged Verfahr 1992, 156:103-105.
9. Sage MR: Blood–brain barrier: phenomenon of increasing
importance to the imaging clinician. AJR Am J Roentgenol
1982, 138:887-898.
10. Waldron RLD, Bridenbaugh R, Purkenson M, Dempsey EW: The
effect of angiographic contrast media at the cellular level in
the brain. Radiology 1973, 108:187-189.
11. Ware LB, Matthay MA: The acute respiratory distress syn-
drome. N Engl J Med 2000, 342:1334-1349.
12. Bernard GR, Artigas A, Brigham KL, Carlet J, Falke K, Hudson L,
Lamy M, LeGall JR, Morris A, Spragg R: Report of the American-
European Consensus Conference on ARDS: definitions,
mechanisms, relevant outcomes and clinical trial coordina-
tion. The Consensus Committee. Intensive Care Med 1994, 20:
225-232.
13. Puybasset L, Rouby JJ, Mourgeon E, Cluzel P, Law-Koune JD,
Stewart T, Devilliers C, Lu Q, Roche S, Kalfon P, Vicaut E, Viars P:
Factors influencing cardiopulmonary effects of inhaled nitric
oxide in acute respiratory failure. Am J Respir Crit Care Med
1995, 152:318-328.
14. Puybasset L, Cluzel P, Chao N, Slutsky A, Coriat P, Rouby JJ, CT
Scan ARDS Study group: A computed tomography assess-
ment of regional lung volume in acute lung injury. Am J Respir
Crit Care Med 1998, 158:1644-1655.
15. Malbouisson LM, Preteux F, Puybasset L, Grenier P, Coriat P,
Rouby JJ: Validation of a software designed for computed
tomographic (CT) measurement of lung water. Intensive Care
Med 2001, 27:602-608.
16. Mull RT: Mass estimates by computed tomography: physical
density from CT numbers. AJR Am J Roentgenol 1984, 143:
1101-1104.
17. Gattinoni L, Pesenti A, Avalli L, Rossi F, Bombino M:
Pressure–volume curve of total respiratory system in acute
respiratory failure. Computed tomographic scan study. Am
Rev Respir Dis 1987, 136:730-736.
18. Markarian B: A simple method of inflation-fixation and air
drying of lungs. Am J Clin Pathol 1975, 63:20-24.
19. Markarian B, Dailey ET: Preparation of inflated lung specimens.
In The Lung. Radiologic Pathologic Correlations. Edited by Heitz-
man ER. St Louis, Princeton, Toronto: C.V. Mosby Company;
1984:4-12.
20. Bessis L, Callard P, Gotheil C, Biaggi, Grenier P: High-resolu-
tion CT of parenchymal lung disease: precise correlation with
histologic findings. Radiographics 1992, 12:45-58.
21. Bland JM, Altman DG: Statistical methods for assessing agree-
ment between two methods of clinical measurement. Lancet
1986, 1(8476):307-310.
22. Bernard GR, Artigas A, Brigham KL, Carlet J, Falke K, Hudson L,
Lamy M, LeGall JR, Morris A, Spragg R: Report of the American-
European Consensus conference on acute respiratory dis-
tress syndrome: definitions, mechanisms, relevant outcomes,
and clinical trial coordination. Consensus Committee. J Crit
Care 1994, 9:72-81.
23. Gattinoni L, Mascheroni D, Torresin A, Marcolin R, Fumagalli R,
Vesconi S, Rossi G, Rossi F, Baglioni S, Bassi F, Nastri F, Pesenti
A: Morphological response to positive end expiratory pres-
sure in acute respiratory failure. Computerized tomography
study. Intensive Care Med 1986, 12:137-142.
24. Gattinoni L, Pesenti A, Baglioni S, Vitale G, Rivolta M, Pelosi P:
Inflammatory pulmonary edema and positive end-expiratory
pressure: correlations between imaging and physiologic
studies. J Thorac Imag 1988, 3:59-64.
25. Dambrosio M, Roupie E, Mollet JJ, Angalde MC, Vasile N, Lemaire
F, Brochard L: Effects of positive end-expiratory pressure and
different tidal volumes on alveolar recruitment and hyperinfla-
tion. Anesthesiology 1997, 87:495-503.
26. Metry G, Wegenius G, Hedenström H, Wikström B, Danielson
BG: Computed tomographic measurement of lung density
changes in lung water with hemodialysis. Nephron 1997, 75:
394-401.
Available online />Key messages
• In patients with ALI, administration of contrast material
induces an apparent increase in lung tissue
• This apparent increase in lung tissue results from a
true increase in extravascular lung water and from an
artifactual increase in lung density resulting from
leakage of contrast material into the lung parenchyma
• The increase in extravascular lung water persists
15 min after injection
• Because injection of contrast material may worsen
lung injury, it appears prudent to limit this procedure to
specific indications in patients with ALI undergoing a
thoracic CT scan