Báo cáo y học: " Does the tube-compensation function of two modern mechanical ventilators provide effective work of breathing relief" pdf
Bạn đang xem bản rút gọn của tài liệu. Xem và tải ngay bản đầy đủ của tài liệu tại đây (111.05 KB, 6 trang )
R92
Critical Care October 2003 Vol 7 No 5 Maeda et al.
Research
Does the tube-compensation function of two modern mechanical
ventilators provide effective work of breathing relief?
Yoshiko Maeda
1
, Yuji Fujino
2
, Akinori Uchiyama
2
, Nobuyuki Taenaka
3
, Takashi Mashimo
4
and Masaji Nishimura
5
1
Graduate student, Intensive Care Unit, Osaka University Medical School, Suita, Osaka, Japan
2
Assistant Professor, Intensive Care Unit, Osaka University Hospital, Suita, Osaka, Japan
3
Associate Professor, Department of Anesthesiology, Osaka University Medical School, Suita, Osaka, Japan
4
Professor, Department of Anesthesiology, Osaka University Medical School, Suita, Osaka, Japan
5
Associate Professor, Intensive Care Unit, Osaka University Hospital, Suita, Osaka, Japan
Correspondence: Masaji Nishimura,
Introduction
Mechanically ventilated patients usually show significantly
increased respiratory resistance [1–3]. Almost all venti-
lated patients are intubated and positive pressure ventila-
tion is most commonly applied to assist patient effort. The
endotracheal tube (ETT) constitutes a greater resistance
DE4 = Dräger Evita 4; DT = delay time; ETT = endotracheal tube; NPB 840 = Nellcor Puritan-Bennett 840; P
aw
= airway pressure; PI = inspiratory
trigger pressure; P
pl
= pleural pressure; PSV = pressure support ventilation; PTP = pressure–time product; P
tr
= tracheal pressure; TC = tube com-
pensation; V
T
= tidal volume; WOB = work of breathing.
Abstract
Objective An endotracheal tube (ETT) imposes work of breathing on mechanically ventilated patients.
Using a bellows-in-a-box model lung, we compared the tube compensation (TC) performances of the
Nellcor Puritan-Bennett 840 ventilator and of the Dräger Evita 4 ventilator.
Measurements and results Each ventilator was connected to the model lung. The respiratory rate of
the model lung was set at 10 breaths/min with 1 s inspiratory time. Inspiratory flows were 30 or 60
l/min. A full-length 8 mm bore ETT was inserted between the ventilator circuit and the model lung. The
TC was set at 0%, 10%, 50%, and 100% for both ventilators. Pressure was monitored at the airway,
the trachea, and the pleura, and the data were recorded on a computer for later analysis of the delay
time, of the inspiratory trigger pressure, and of the pressure–time product (PTP). The delay time was
calculated as the time between the start of inspiration and minimum airway pressure, and the
inspiratory trigger pressure was defined as the most negative pressure level. The same measurements
were performed under pressure support ventilation of 4 and 8 cmH
2
O.
The PTP increased according to the magnitude of inspiratory flow. Even with 100% TC, neither
ventilator could completely compensate for the PTP imposed by the ETT. At 0% TC the PTP tended to
be less with the Nellcor Puritan-Bennett 840 ventilator, while at 100% TC the PTP tended to be less
with the Dräger Evita 4 ventilator. A small amount of pressure support can be equally effective to
reduce the inspiratory effort compared with the TC.
Conclusion Although both ventilators provided effective TC, even when set to 100% TC they could not
entirely compensate for a ventilator and ETT-imposed work of breathing. The effect of TC is less than
that of pressure support ventilation. Physicians should be aware of this when using TC in weaning trials.
Keywords: endotracheal tube, mechanical ventilation, pressure support ventilation, tube compensation, work of
breathing
Received: 24 January 2003
Revisions requested: 9 April 2003
Revisions received: 9 May 2003
Revisions requested: 29 May 2003
Revisions received: 3 June 2003
Accepted: 3 June 2003
Published: 14 August 2003
Critical Care 2003, 7:R92-R97 (DOI 10.1186/cc2343)
This article is online at />© 2003 Maeda et al., licensee BioMed Central Ltd
(Print ISSN 1364-8535; Online ISSN 1466-609X). This is an Open
Access article: verbatim copying and redistribution of this article are
permitted in all media for any purpose, provided this notice is
preserved along with the article's original URL.
Open Access
R93
Available online />than does the supraglotic airway [4]. Once the patient
starts making efforts to breathe, resistance imposed by the
ETT increases the resistive work of breathing (WOB)
during both the inspiration and the expiration. It is prudent
for physicians to recognize the importance of imposed
WOB due to an ETT during the weaning process. In clini-
cal practice, pressure support ventilation (PSV) is popular
to compensate for an ETT. The pressure difference across
the ETT changes proportionate to the gas flow. When a
patient generates a high flow with a strong inspiratory
effort, the pressure difference across the ETT can be con-
siderably great, and PSV cannot compensate for imposed
WOB due to the ETT. Sometimes 10 or 15 cmH
2
O PSV is
needed to compensate for WOB due to an ETT in a patient
with high minute ventilation [5].
To alleviate the WOB due to tube resistance, two manufac-
turers have recently released ventilators that, by increasing
pressure at the proximal end of the tube, are able to compen-
sate for tube resistance [6–8]. This function is known as tube
compensation (TC). The object of TC is to give the patients
the feeling that they are not intubated from the viewpoint of
WOB, and it is sometimes described as ‘electric extubation’.
If TC works in theory, WOB due to an ETT is compensated
regardless of inspiratory efforts. However, new ventilatory
modes are sometimes very good in theory but do not work in
practice. The purpose of the study was to investigate whether
TC worked both in normal and high inspiratory flow, and
whether the TC performance of two sophisticated ventilators
worked in the same manner.
Methods
Model lung and ventilators
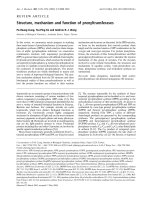
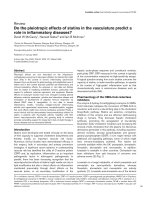
To simulate spontaneous breathing we used a custom-built
bellows-in-a-box model lung, details of which have been
described elsewhere [8,9] (Fig. 1). Briefly, a pair of bellows
are set in a rigid box: one simulates the muscles and the
other simulates the lungs. Negative pressure acts on the
muscle compartment by the Venturi effect. The space
between the box and the bellows simulates the pleural space.
The source gas (O
2
at 345 kPa) was connected to a custom-
made pressure regulator and a proportional solenoid valve
(SMC 315; SMC Co., Tokyo, Japan). The opening of the
solenoid valve was controlled by a function generator (H3BF;
Omron, Tokyo, Japan). The inspiratory flow, the inspiratory
time, and the respiratory rate were controlled by setting the
regulator on the model lung. The compliance of the model
lung was adjusted to 46.8 ml/cmH
2
O.
Figure 1
Experimental setup. Spontaneous breathing was simulated with a bellows-in-a-box model lung. All data were recorded on a computer via an
analogue–digital (A/D) converter. See text for details.
ventilators
A/D converter
Solenoid valve
On-off timer
Wall pressure source
Jet flow
Muscle bellows
Lung bellows
Venturi effect
Differential pressure
transducers
Amplifiers
Pn
eumotachometer
R94
Critical Care October 2003 Vol 7 No 5 Maeda et al.
The model lung was set for spontaneous breathing (respira-
tory rate, 10 breaths/min; inspiratory time, 1.0 s; peak inspira-
tory flow, 30 or 60 l/min). Two commercially available
ventilators that incorporate TC functions, the Nellcor Puritan-
Bennett 840 (NPB840) ventilator (Pleasanton, CA, USA) and
the Dräger Evita 4 (DE4) ventilator (Lübeck, Germany), were
connected to the model lung via a standard ventilator circuit
(Dar SpA, Milandola, Italy) with full-length 8 mm bore ETT
(Portex, Hythe, UK). Operating the TC function involves spec-
ifying the size and type of the tubes and then selecting the
degree of TC. Compensation settings vary from 100% to
10% with the NPB 840 ventilator, and from 100% to 1% with
the DE4 ventilator. To compare the actual TC performance of
the two ventilators, TC was monitored on both machines at
settings of 10%, 50%, and 100%. The tube length was the
same for both machines and so is not considered significant
to the comparative results. We did not shorten the tubes in
the present study. PSV was originally developed to overcome
the WOB imposed by ETTs, so we also carried out, with the
same settings on the model lung, trials with PSV set at 4 and
8 cmH
2
O on either ventilator. The trigger sensitivity on both
ventilators was set at 1 l/min. Settings for the rising time and
the expiratory sensitivity were a support sensitivity of 0.2 s
and an expiratory sensitivity of 25% for the NPB 840 ventila-
tor, and a flow acceleration of 90% and an expiratory sensitiv-
ity of 25% for the DE4 ventilator.
Measurements
The airway pressure at the proximal end of the ETT (P
aw
), the
pressure at the distal end of ETT (P
tr
), and the pleural pressure
(P
pl
) were measured with differential pressure transducers
(DP45; Validyne, Northridge, CA, USA). The flow at the airway
opening was measured with a pneumotachometer (model
4700, 0–160 l/min: Hans-Rudolph Inc., Kansas City, MO,
USA) connected to a differential pressure transducer (DP45;
Validyne). The flowmeter was calibrated using a syringe with a
plunger that was moved by a linear slider programmed to
adjust flow to precisely 1 l/s. Accuracy was confirmed by the
integration of flow signal for 1 s. Pressure transducers were
calibrated at 10 cmH
2
O with a water manometer. The tidal
volume (V
T
) was calculated by digital integration of flow data.
All signals were led to an analogue–digital converter (DI-220;
Dataq Instruments Inc., Akron, OH, USA) via amplifiers
(CD19A High Gain Carrier Demodulator; Validyne), and were
saved at 100 Hz/channel signal frequency on an IBM-compati-
ble computer using WINDAQ (Dataq Instruments Inc.) data
acquisition software. At each experimental setting, three
breaths were analysed and average values were used.
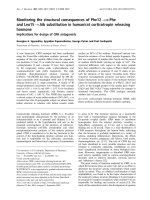
Data analysis
Figure 2 shows the measurements of the pressure–time
product (PTP), the inspiratory delay time (DT), and the inspi-
ratory trigger pressure (PI). The PTP is indicated by the area
below the baseline pressure between the initiation of inspira-
tion and the time for the pressure to return to the baseline.
These calculations were performed for P
aw
, P
tr
, and P
pl
. The
DT was calculated as the time between the start of inspiration
and minimum airway pressure. During the inspiratory trigger,
the PI was defined as the most negative pressure level.
Statistical analysis
The V
T
, the DT, the PI, and the PTP were analysed as depen-
dent variables. For each variable, two-way analysis of variance
was performed for TC, with PSV support levels and ventila-
tors as the repeated measures. When statistical significance
was indicated, it was further examined by post hoc analysis
(Scheffé test). A statistics software package (STATISTICA
5.1; StatSofa Inc.,Tulsa, OK, USA) was used and signifi-
cance was set at P < 0.05.
Results
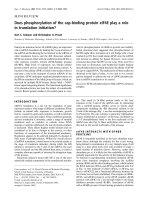
Figure 3 shows pressure tracings for each ventilator during TC
of 0% and 100%. At TC of 0% the NPB840 ventilator
increased the P
aw
above baseline after triggering of the inspira-
tory effort, while the DE4 ventilator did not increase P
aw
above
baseline during the entire inspiratory phase. The tracheal pres-
sures of both ventilators were below baseline during the whole
inspiration. At 100% TC, the tracheal pressure was close to
baseline during the latter phase of inspiration with the NPB840
ventilator and at the end of inspiration with the DE4 ventilator.
The PTPs were calculated with P
aw
, P
tr
, and P
pl
. A higher
inspiratory flow resulted in greater PTPs for both ventilators.
With 0%, 10%, and 50% TC there were no significant differ-
ences between PTPs. At 100% TC, both the PTPs calculated
with P
tr
and with P
pl
decreased significantly compared with
other settings. Figure 4 shows PTPs at each support level of
TC for both ventilators. At all settings, 4 and 8 cmH
2
O PSV
increased the V
T
by more than 10% (Table 1), although the V
T
did not increase more than 10% above the baseline V
T
in
10% TC and 50% TC but it did in 100% TC with DE4. The
DT, at all experimental settings for both ventilators, did not
Figure 2
Definition of measured parameters. Delay time (DT), the time elapsed
from the beginning of inspiration to the bottom of the pressure cycle;
inspiratory trigger pressure (PI), the pressure difference between the
baseline and the bottom; pressure–time product (PTP), the area on the
graph where the pressure is below the baseline.
P [cmH
2
O]
time (s)
0
DT
PI
PTP
R95
differ significantly with increasing TC. The inspiratory flow did
not significantly influence the DT, and consequently com-
bined data for the DT at 30 and 60 l/min inspiratory flow are
presented. Increases in TC, at any experimental settings, did
not cause significant changes in the PI. As expected, the PI
increased as inspiratory flow increased. Table 2 presents
data only for 60 l/min inspiratory flow.
PTPs were larger with the DE4 ventilator than with the
NPB840 ventilator at TC of 0%. At 0% and 10% TC the V
T
was significantly less with the DE4 ventilator than with the
NPB840 ventilator, and at 50% and 100% TC the V
T
was
significantly larger with the DE4 ventilator than with the
NPB840 ventilator. On comparing these two ventilators, the
DT did not vary significantly.
Discussion
There are two major findings of the present study. First, with
both the DE4 and the NPB840 ventilators, PTPs during inspi-
ration decreased as TC support increased. Second, at 0%
TC the PTP calculated with P
tr
was less with the NPB840
ventilator than that with the DE4 ventilator.
Available online />Figure 3
Representative pressure tracings from 60 l/min inspiratory flow. Airway pressure (P
aw
), tracheal pressure (P
tr
), and pleural pressure (P
pl
) tracings at:
(a) 0% tube compensation (TC) with the Nellcor Puritan-Bennett 840 ventilator, (b) 100% TC with the Nellcor Puritan-Bennett 840 ventilator, (c)
0% TC with the Dräger Evita 4 ventilator, and (d) 100% TC with the Dräger Evita 4 ventilator.
(a) (b)
Pressure (cmH
2
O)
(c) (d)
Table 1
Effects on the tidal volume of tube compensation (TC) and pressure support ventilation (PSV) provided by the two ventilators
Inspiratory flow 0% TC 10% TC 50% TC 100% TC 4 cmH
2
O PSV 8 cmH
2
O PSV
30 l/min
NPB840 282 ± 3 282 ± 2 281 ± 1 278 ± 3 382 ± 1 506 ± 2
DE4 244 ± 1 244 ± 2 254 ± 1 262 ± 1 361 ± 1 489 ± 2
60 l/min
NPB840 577 ± 4 574 ± 2 573 ± 2 591 ± 2 648 ± 2 742 ± 3
DE4 541 ± 1 546 ± 2 572 ± 1 613 ± 1 631 ± 2 731 ± 1
All values presented as mean ± standard deviation of three breaths (ml). DE4, Dräger Evita 4 ventilator; NPB840, Nellcor Puritan-Bennett 840 ventilator.
R96
Invasive positive pressure ventilation requires an ETT, the
presence of which imposes additional WOB according to
bore and inspiratory flow [10,11]. The burden is heavy
enough to induce respiratory muscle fatigue. To compensate
for the WOB imposed by the ETT, the most popular ventila-
tory strategy is PSV. A PSV of 5–7 cmH
2
O for adult patients
[12] and a PSV of 4–8 cmH
2
O for children [13] are reported
to compensate for the imposed work. Ventilators with selec-
table TC settings have more recently been developed to com-
pensate the WOB imposed by an ETT. At a setting of 100%
TC it would be natural to assume that the ventilator was com-
pletely cancelling the extra burden imposed by the resistance
of the small-bore tube. Despite being set to 100%, neither of
the two ventilators tested was able to completely compen-
sate for PTP calculated with P
pl
.
Patients have to trigger the ventilator in patient-triggered ven-
tilation modes. This effort requires significant WOB [14,15];
the effort may even exceed the total WOB of healthy human
beings. The technique of TC is also dependent on patient-
triggered ventilation and trigger work is still necessary during
TC. This is one of the major reasons why, with the tested ven-
tilators, TC did not completely compensate ETT-imposed
PTP calculated with P
pl
.
As TC support increased, PTPs decreased. As already
described, however, TC did not fully compensate for PTPs
imposed by ETT resistance. This result raises doubts about
the lower range of overall TC support that is actually provided
in clinical situations. In clinical settings, because of secretions
deposited inside the ETT or because of deformity of the ETT,
or both, ETT resistance tends to increase the longer the intu-
bation continues. In the present study, the ETT was allowed
to assume a natural curve and was not subject to any twisting
or deformation. Neither was a humidifier used. The ETT was
kept dry, so neither condensation in, nor deformity of, the ETT
Critical Care October 2003 Vol 7 No 5 Maeda et al.
Figure 4
The pressure–time product (PTP) at each ventilator setting: (a)
30 l/min peak inspiratory flow, and (b) 60 l/min inspiratory flow. The
numerals 0, 10, 50, and 100 under each graph represent tube
compensation support levels of 0%, 10%, 50%, and 100%,
respectively. The PTP was calculated from the airway pressure (P
aw
),
the tracheal pressure (P
tr
), and the pleural pressure (P
pl
).
0
2
4
6
8
0% 10% 50% 100% 0% 10% 50%
100%
0
2
4
6
8
0% 10% 50% 100% 0% 10% 50%
100%
P
aw
P
tr
P
pl
(a)
(b)
PTP (cmH
2
O· s)
PTP (cmH
2
O· s)
NPB840 DE4
NPB840 DE4
Table 2
Effects on the delay time and inspiratory trigger pressure of tube compensation (TC) of the two ventilators
Delay time (ms) Inspiratory trigger pressure (cmH
2
O)
0% TC 100% TC 0% TC 100% TC
Airway pressure
NPB840 61 ± 11 77 ± 5 4.84 ± 0.10 4.84 ± 0.10
DE4 60 ± 6 58 ± 5 5.89 ± 0.34 5.89 ± 0.34
Tracheal pressure
NPB840 91 ± 31 108 ± 17 6.52 ± 0.08 7.06 ± 0.05
DE4 108 ± 43 95 ± 20 7.11 ± 0.06 7.14 ± 0.12
Pleural pressure
NPB840 139 ± 109 121 ± 22 7.39 ± 0.06 8.19 ± 0.02
DE4 176 ± 131 110 ± 25 8.14 ± 0.02 8.19 ± 0.14
All values presented as mean ± standard deviation of three breaths (ml). DE4, Dräger Evita 4 ventilator; NPB840, Nellcor Puritan-Bennett 840
ventilator. The delay time did not differ significantly according to the inspiratory flow of simulated spontaneous breathings, and combined data are
presented. An inspiratory trigger pressure measured at airway opening of 60 l/min inspiratory flow is presented.
R97
could have impeded the ideal functioning of TC. Furthermore,
4 cmH
2
O PSV decreased PTPs by the same amount as
100% TC and raises the question whether TC technology yet
provides any advantage over other ventilatory modes. PSV is
a well known and widely practiced technique to alleviate
WOB imposed by an ETT for mechanically ventilated patients
[12]. As Fig. 3 shows, P
aw
was high at the beginning of inspi-
ration and decreased as the inspiratory flow decreased with
100% TC. PSV is designed to keep P
aw
constant during the
inspiratory effort of spontaneous breathing. This is one of the
reasons why only a small amount of PSV was as effective as
100% TC. From the viewpoint of decreasing WOB, the clini-
cal importance of TC may be doubtful.
Once triggered by the patient’s breath, the ventilators deliver
fresh gas according to the programming for the set ventilatory
modes. Each manufacturer uses its own algorithms to control
delivery of inspiratory gas. The technical strategies applied to
deliver gas mean that different brands of ventilator will behave
differently in practice. At 100% TC, the DE4 ventilator
decreased PTPs more than did the NPB840 ventilator. This
suggests that the ventilators use different TC algorithms and
that neither of these algorithms is actually able to provide
100% compensation.
This is an in vitro study with a model lung, and our results
should not be considered applicable to patients directly. TC
is a mode to support inspiration, and we did not evaluate the
expiratory WOB. We set the respiratory rate of simulated
spontaneous breathing at 10 breaths/min to prevent air-
trapping inside the bellows. However, in the clinical setting,
the respiratory rate is not necessarily low enough to avoid air-
trapping. Two levels of inspiratory efforts (30 and 60 l/min
inspiratory flow of the model lung) were investigated, but they
were constant during data acquisition. The inspiratory effort
of patients differs breath by breath in clinical settings, and the
effect was not evaluated in the present study. The respiratory
mechanics of patients may also influence the performance of
TC, and we did not evaluate this from the data of the present
study. Positive end expiratory pressure could also affect TC
performance. We therefore repeated the whole study at
5 cmH
2
O positive end expiratory pressure, and the data did
not reveal any differences without positive end expiratory
pressure. We presented the data at zero positive end expira-
tory pressure.
In conclusion, TC did not compensate for the PTPs imposed
by ETT resistance. TC is a patient-triggered ventilation tech-
nique, and patients have to work to trigger the ventilator. TC
cannot compensate for these triggering PTPs. A small
amount of PSV was as effective as 100% TC. This inability
restricts the usefulness of this new ventilator function. Before
we can be confident of the clinical advantages of TC, more
hands-on experience is needed.
Competing interests
None declared.
References
1. Pelosi P, Cereda M, Foti G, Giacomini M, Pesenti A: Alterations
of lung and chest wall mechanics in patients with acute lung
injury: effects of positive end-expiratory pressure. Am J Respir
Crit Care Med 1995, 152:531-537.
2. Pesenti A, Pelosi P, Rossi N, Virtuani A, Brazzi L, Rossi A: The
effects of positive end-expiratory pressure on respiratory
resistance in patients with the adult respiratory distress syn-
drome and in normal anesthetized subjects. Am Rev Respir
Dis 1991, 144:101-107.
3. Mols G, Kessler V, Benzing A, Lichtwarck-Aschoff M, Geiger K,
Guttmann J: Is pulmonary resistance constant, within the
range of tidal volume ventilation, in patients with ARDS? Br J
Anaesth 2001, 86:176-182.
4. Straus C, Louis B, Isabey D, Lemaire F, Harf A, Brochard L: Com-
parison of the endotracheal tube and the upper airway to
breathing workload. Am J Respir Crit Care Med 1998, 157:23-
30.
5. Fabry B, Haberthür C, Zappe D, Guttmann J, Kuhlen R, Stocker R:
Breathing pattern and additional work of breathing in sponta-
neously breathing patients with different ventilatory demand
during inspiratory pressure support and automatic tube com-
pensation. Intensive Care Med 1997, 23:545-552.
6. Haberthür C, Elsasser S, Eberhard L, Stocker R, Guttmann J:
Total versus tube-related additional work of breathing in ven-
tilator-dependent patients. Acta Anaesthesiol Scand 2000,
44:749-757.
7. Guttmann J, Bernhard H, Mols G, Benzing A, Hofmann P,
Haberthür C, Zappe D, Fabry B, Geiger K: Respiratory comfort
of automatic tube compensation and inspiratory pressure
support in conscious human. Intensive Care Med 1997, 23:
1119-1124.
8. Fujino Y, Uchiyama A, Mashimo T, Nishimura M: Spontaneously
breathing lung model comparison of work of breathing
between automatic tube compensation and pressure support.
Respir Care 2003, 48:38-45.
9. Miyoshi E, Fujino Y, Mashimo T, Nishimura M: Performance of
transport ventilator with patient-triggered ventilation. Chest
2000, 118:1109-1115.
10. Bolder PM, Healy TEJ, Bolder AR, Beatty PCW, Kay B: The extra
work of breathing through adult endotracheal tubes. Anesth
Analg 1986, 65:853-859.
11. Shapiro M, Wilson K, Casar G, Bloom K, Teague RB: Work of
breathing through different sized endotracheal tubes. Crit
Care Med 1986, 14:1028-1031.
12. Brochard L, Rua F, Lorino H, Lemaire F, Harf A: Inspiratory pres-
sure support compensates for the additional work of breath-
ing caused by the endotracheal tube. Anesthesiology 1991, 75:
739-745.
13. Takeuchi M, Imanaka H, Miyano H, Kumon K, Nishimura M: Effect
of patient-triggered ventilation on respiratory workload in
infants after cardiac surgery. Anesthesiology 2000, 93:1238-
1244.
14. Sassoon CS, Lodia R, Rheeman CH, Kuei JH, Light RW, Mahutte
CK: Inspiratory muscle work of breathing during flow-by,
demand-flow, and continuous-flow systems in patients with
chronic obstructive pulmonary disease. Am Rev Respir Dis
1992, 145:1219-1222.
15. Sassoon CS, Del Rosario N, Fei R, Rheeman CH, Gruer SE,
Mahutte CK: Influence of pressure- and flow-triggered syn-
chronous intermittent mandatory ventilation on inspiratory
muscle work. Crit Care Med 1994, 22:1933-1941.
Available online />Key message
• The tube compensation function incorporated in two
modern ventilators was investigated. The function did
not compensate completely for that imposed by an
endotracheal tube