Báo cáo khoa học: "Assessment of six mortality prediction models in patients admitted with severe sepsis and septic shock to the intensive care unit: a prospective cohort study" ppt
Bạn đang xem bản rút gọn của tài liệu. Xem và tải ngay bản đầy đủ của tài liệu tại đây (76.42 KB, 7 trang )
Introduction
Severe sepsis and septic shock are major reasons for inten-
sive care unit (ICU) admission and leading causes of mortality
in noncoronary ICUs [1–3]. Apart from in the West, little is
known about outcomes of patients admitted to the ICU with
severe sepsis and septic shock, despite the seriousness of
R116
Critical Care October 2003 Vol 7 No 5 Arabi et al.
Research
Assessment of six mortality prediction models in patients
admitted with severe sepsis and septic shock to the intensive
care unit: a prospective cohort study
Yaseen Arabi
1
, Nehad Al Shirawi
1
, Ziad Memish
2
, Srinivas Venkatesh
1
and
Abdullah Al-Shimemeri
1
1
Department of Intensive Care, King Fahad National Guard Hospital, Riyadh, Saudi Arabia
2
Department of Infection Prevention and Control, King Fahad National Guard Hospital, Riyadh, Saudi Arabia
Correspondence: Yaseen Arabi,
APACHE = Acute Physiology and Chronic Health Evaluation; ICU = intensive care unit; MPM = Mortality Probability Model; ROC = receiver operat-
ing characteristic; SAPS = Simplified Acute Physiology Score; SIRS = systemic inflammatory response syndrome; SMR = standardized mortality
ratio.
Abstract
Introduction We conducted the present study to assess the validity of mortality prediction systems in
patients admitted to the intensive care unit (ICU) with severe sepsis and septic shock. We included
Acute Physiology and Health Evaluation (APACHE) II, Simplified Acute Physiology Score (SAPS) II,
Mortality Probability Model (MPM) II
0
and MPM II
24
in our evaluation. In addition, SAPS II and MPM II
24
were customized for septic patients in a previous study, and the customized versions were included in
this evaluation.
Materials and method This cohort, prospective, observational study was conducted in a tertiary care
medical/surgical ICU. Consecutive patients meeting the diagnostic criteria for severe sepsis and septic
shock during the first 24 hours of ICU admission between March 1999 and August 2001 were
included. The data necessary for mortality prediction were collected prospectively as part of the
ongoing ICU database. Predicted and actual mortality rates, and standardized mortality ratio were
calculated. Calibration was assessed using Lemeshow–Hosmer goodness of fit C-statistic.
Discrimination was assessed using receiver operating characteristic curves.
Results The overall mortality prediction was adequate for all six systems because none of the
standardized mortality ratios differed significantly from 1. Calibration was inadequate for APACHE II,
SAPS II, MPM II
0
and MPM II
24
. However, the customized version of SAPS II exhibited significantly
improved calibration (C-statistic for SAPS II 23.6 [P = 0.003] and for customized SAPS II 11.5
[P = 0.18]). Discrimination was best for customized MPM II
24
(area under the receiver operating
characteristic curve 0.826), followed by MPM II
24
and customized SAPS II.
Conclusion Although general ICU mortality system models had accurate overall mortality prediction, they
had poor calibration. Customization of SAPS II and, to a lesser extent, MPM II
24
improved calibration. The
customized model may be a useful tool when evaluating outcomes in patients with sepsis.
Keywords mortality, prediction, Saudi Arabia, sepsis, septic shock
Received: 25 June 2003
Revisions requested: 14 July 2003
Revisions received: 15 July 2003
Accepted: 6 August 2003
Published: 28 August 2003
Critical Care 2003, 7:R116-R122 (DOI 10.1186/cc2373)
This article is online at />© 2003 Arabi et al., licensee BioMed Central Ltd
(Print ISSN 1364-8535; Online ISSN 1466-609X). This is an Open
Access article: verbatim copying and redistribution of this article are
permitted in all media for any purpose, provided this notice is
preserved along with the article's original URL.
Open Access
R117
sepsis as a public health problem in developing countries.
According to the 1996 World Health Organization Health
Report [4], infectious and parasitic diseases caused 17 million
out of 50 million deaths globally, including 3.4 million deaths
from acute lower respiratory infections, 3 million from tubercu-
losis, 2.5 million from diarrhoeal diseases, 1.5–2.7 million from
malaria and 1.5 million from HIV/AIDS. Infectious and parasitic
diseases accounted for 43% of the 40 million deaths occur-
ring in the developing countries in 1996.
With increasing international travel and the trend toward
globalization, an international perspective on the outcome fol-
lowing sepsis is becoming increasingly important. The
Kingdom of Saudi Arabia has some unique features in this
regard. First, the Kingdom hosts the annual Islamic pilgrimage
(Hajj), when 2 million Muslims from more than 100 countries
gather in Makkah [5]. Many of these pilgrims are elderly with
underlying chronic illnesses, making them especially suscep-
tible to infectious illnesses. Second, the health care system in
the Kingdom grew rapidly to state-of-the-art levels over the
past two decades, and this development has brought with it
the challenges that face modern medicine, including trans-
plantation complications, cancer therapy and advanced
surgery.
Understanding sepsis outcome studies is hampered by two
factors. First is the inconsistency in the definition of sepsis.
This led to a consensus statement that defined systemic
inflammatory response syndrome (SIRS), sepsis, severe
sepsis and septic shock [6]. More recently, these definitions
were revisited; the concept of SIRS was challenged, and the
definitions of sepsis, severe sepsis and septic shock were
maintained [7]. The second factor was the lack of an agreed
severity of illness scoring system for sepsis patients. In the
absence of such a system, it would be difficult to interpret
sepsis outcome studies [8]. Mortality prediction systems have
been introduced as tools for assessing the performance of
ICUs [9–12]. Some of these systems have been customized
for patients with specific conditions such as sepsis, and liver
transplantation and long-stay ICU patients [13,14]. If these
systems are proved to predict accurately mortality in severe
sepsis and septic shock, then they will have the advantage of
being readily available and easily incorporated into general
ICU databases without additional data collection. Customized
versions of SAPS II and MPM II
24
for septic patients were
introduced by the European–North American Study of Sever-
ity Systems [15]. That study included 1130 patients who met
the criteria for severe sepsis.
The objective of the present study is to assess the validity of
six mortality prediction systems for the severe sepsis and
septic shock patient population. This was, to our knowledge,
the first study of its kind to be conducted on an independent
database. It is also the first study to describe the outcome of
severe sepsis and septic shock using standardized defini-
tions in a non-Western country.
Materials and method
King Fahad National Guard Hospital is a 550-bed tertiary
care teaching centre in Riyadh, Saudi Arabia. It is a transplant
centre, and it therefore receives a large number of referrals of
patients with end-stage liver disease. The 21-bed
medical/surgical ICU has 700–800 admissions per year and
is run by full-time, on-site, board-certified intensivists. The ICU
database was established in March 1999 to record all ICU
admissions. We included information on all consecutive
admissions between 1 March 1999 and 31 August 2001
meeting the definitions of severe sepsis and septic shock in
the first 24 hours of ICU admission. Severe sepsis is defined
as the presence of sepsis associated with organ dysfunction.
Septic shock is defined as sepsis-induced hypotension and
perfusion abnormalities despite fluid resuscitation, necessitat-
ing vasopressor support. At the time of the study, these defin-
itions were based on the 1992 American College of Chest
Physicians and Society of Critical Care Medicine consensus
statement [6]. In the more recent statement, published in
2003 [7], the definition of SIRS was challenged and was
replaced by new diagnostic criteria. The definitions of severe
sepsis and septic shock were maintained, as mentioned
above. Therefore, the new definitions do not affect our patient
population.
Patients younger than 16 years, and burn and brain-dead
patients were excluded. For patients admitted to the ICU
more than once during a hospitalization episode, only data
from the first admission were used. Approval from the hospi-
tal ethics committee was not required because the informa-
tion was already being collected for clinical purposes. The
following data were collected: demographics, Acute Physiol-
ogy and Chronic Health Evaluation (APACHE) II scores,
Simplified Acute Physiology Score (SAPS) II scores, and
Mortality Probability Model (MPM) variables. MPM II
0
data
were obtained for all admissions, whereas MPM II
24
,
APACHE II and SAPS II data were obtained in patients who
stayed 24 hours or longer in the ICU. The original methodol-
ogy for data collection was followed [10–12,15]. The main
reason for ICU admission, whether the admission was fol-
lowing emergency surgery, and the presence of severe
chronic illness were documented according to the defini-
tions used in the original APACHE II article [10]. Severe
chronic illnesses included cirrhosis, New York Heart Associ-
ation class IV heart failure, chronic respiratory failure, end-
stage renal disease and immunosuppression. ICU and
hospital duration of stay, and vital status at discharge both
from the ICU and from the hospital was documented. Hospi-
tal mortality is used as the primary end-point for all mortality
predictions.
Statistics
Predicted mortality was calculated using the logistic regres-
sion formulae described in the original articles [10–12,15].
The formula used for calculation of predicted mortality in the
customized SAPS II system is as follows:
Available online />R118
Critical Care October 2003 Vol 7 No 5 Arabi et al.
e
β0β1 (SAPS II score)
Predicted mortality =
1 + e
β0β1 (SAPS II score)
where β
0
is –3.5524 and β
1
is 0.0694.
A similar approach was used in calculating predicted mortal-
ity for the customized MPM II
24
:
e
β0β1 (MPM II24 logit)
Predicted mortality =
1 + e
β0β1 (MPM II24 logit)
where β
0
is 0.0157 and β1 is 0.7971 [15].
Standardized mortality ratio (SMR) was calculated by dividing
observed mortality by the predicted mortality. The 95% confi-
dence intervals for SMRs were calculated using the observed
mortality as a Poisson variable, and then dividing its 95%
confidence interval by the predicted mortality [16].
System validation was tested by assessing both calibration
and discrimination values. Calibration (the ability to provide a
risk estimate that corresponds to the observed mortality) was
assessed using Lemeshow–Hosmer goodness of fit C-statis-
tics [17]. In order to calculate the C-statistic, the study popu-
lation was divided into 10 groups of approximately equal
numbers of patients. The predicted and actual number of sur-
vivors and nonsurvivors were compared statistically using
formal goodness of fit testing to determine whether the dis-
crepancy between predicted and actual values was statisti-
cally insignificant (P > 0.05). Discrimination was tested using
receiver operating characteristic (ROC) curves. ROC curves
were constructed using 10% stepwise increments in pre-
dicted mortality [18,19]. A comparison of the six curves was
done by computing the areas under the ROC curves.
Continuous variables were expressed as means ± standard
deviation and were compared using standard t-test. Categori-
cal values were expressed in absolute and relative frequen-
cies, and were analyzed using χ
2
test. P ≤ 0.05 was
considered statistically significant.
Results
Demographics
During the period of study 250 patients met the diagnostic
criteria for severe sepsis/septic shock in the first 24 hours of
ICU admission. Demographic data for these patients are sum-
marized in Table 1. Of note is the high proportion of patients
(54.80%) with underlying chronic illness. ICU mortality was
46% (115 patients) and hospital mortality was 61%
(152 patients). The differences between hospital survivors
and nonsurvivors are also shown. Nonsurvivors were older,
had higher APACHE II and SAPS II scores, had shorter hos-
pital duration of stay and were more likely to have chronic ill-
nesses, especially liver disease and immunosuppression. The
most common source of infection was the respiratory system
(41%), followed by abdominal (32%) and then urinary (17%)
sites. A total of 93 patients (37%) had positive blood cul-
tures, with Gram-negative bacilli being the most common
(53 patients [57%]), followed by Gram-positive cocci
(36 patients [39%]) and fungi (3 patients [3%]), and Gram-
negative cocci (1 patient [1%]).
Predicted mortalities
Table 2 shows actual and predicted hospital mortality for
each of the six prediction systems. There was no significant
difference between the SMR for any of the systems and 1, as
evident from the confidence intervals; this indicates that all
the six systems gave overall accurate mortality estimates.
Calibration
Calibration, as tested by C-statistics, was poor for the four
standard ICU mortality prediction systems (C-statistics:
MPM II
0
29.79 [P < 0.001]; MPM II
24
24.82 [P = 0.002];
APACHE II 34.89 [P < 0.001]; SAPS II 23.60 [P = 0.003]).
Customization of SAPS II and MPM II
24
was associated with
improvement in calibration, but this was statistically adequate
only for customized SAPS II (C-statistic 11.48 [P = 0.18];
Table 3).
Discrimination
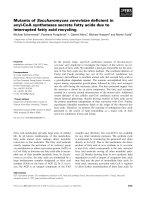
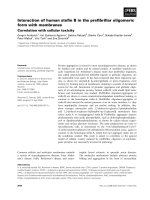
The ROC curves are shown in Fig. 1. The corresponding
areas under the ROC curves were as follows (in descending
order to reflect decreasing levels of discrimination): cus-
tomized MPM II
24
0.826; MPM II
24
0.823; MPM II
0
0.806;
customized SAPS II 0.799; SAPS II 0.797; and APACHE II
0.782.
Discussion
The main findings of this study can be summarized as follows.
First, the overall mortality prediction for all six systems was
accurate, as reflected by the SMRs. Second, calibration was
inadequate for the general (noncustomized) systems and was
improved by customization, particularly for the SAPS II. Third,
discrimination was good for all systems, especially for the
customized versions.
Mortality risk stratification in severe sepsis and septic shock
is commonly used in clinical trials and in practice [20], which
helps to improve accuracy when evaluating new therapies
and refining indications. By facilitating comparison of the
actual with predicted mortalities, the use of such systems can
also provide valuable information about the performance of
individual ICUs in treating septic patients.
Several approaches in risk stratification have been utilized,
including the use of severity of illness scoring systems and
the use of certain inflammatory markers (e.g. interleukin-1,
interleukin-6, tumour necrosis factor-α) [20]. The use of
illness severity systems has several advantages, including
their relative simplicity and wide availability. However, there is
R119
as yet no ideal system for this group of patients. Most of the
systems were developed for general ICU patients, and when
applied to a particular group of patients, such as those with
sepsis, their accuracy declines. Customization of these
systems to predict sepsis outcome is an attractive option.
Compared with the introduction of a system specific to
sepsis, the customized versions require little if any extra data
collection by units already using general ICU systems.
There are several advantages to having an internationally valid
mortality prediction system for patients with severe sepsis
and septic shock. First, it would be useful in comparing the
outcomes of such patients between different ICUs and coun-
tries. In research it would help by grouping patients in a clini-
cal trial – an approach used recently in the Recombinant
human protein C Worldwide Evaluation in Severe Sepsis
(PROWESS) trial [21,22]. The use of these systems will be
Available online />Table 1
The study population
All Survivors Nonsurvivors P
Number 250 98 152
Age (years) 58.40 ± 18.12 55.54 ± 18.96 60.24 ± 17.37 0.05
Female sex (n [%]) 112 (45) 42 (43) 70 (46) NS
APACHE II score 26.94 ± 9.45 21.69 ± 8.85 31.06 ± 7.71 <0.001
SAPS II score 55.99 ± 21.36 43.73 ± 18.41 65.69 ± 18.38 <0.001
ICU LOS (days) 10.16 ± 16.40 11.38 ± 18.75 9.20 ± 14.68 NS
Hospital LOS (days) 31.24 ± 34.69 46.82 ± 41.63 21.20 ± 24.75 <0.001
Source of admission (n [%])
Emergency room 73 (29.20) 30 (30.61) 43 (28.29) NS
Ward 151 (60.40) 50 (51.02) 101 (66.45) 0.02
Operating room 19 (7.60) 12 (12.24) 7 (4.61) 0.03
Other hospitals 7 (2.80) 6 (6.12) 1 (0.66) 0.01
Chronic illnesses (n [%])
Cirrhosis 72 (28.80) 11 (11.22) 61 (40.13) <0.001
Cardiac 12 (4.80) 6 (6.12) 6 (3.95) NS
Respiratory 9 (3.60) 5 (5.10) 4 (2.63) NS
Renal 22 (8.80) 7 (7.14) 15 (9.87) NS
Immunosuppression 34 (13.60) 7 (7.14) 27 (17.76) 0.02
Any chronic illness 137 (54.80) 35 (35.71) 102 (67.11) <0.001
APACHE, Acute Physiology and Chronic Health Evaluation; LOS, length of stay; NS, not significant; SAPS, Simplified Acute Physiology Score.
Table 2
Actual and predicted mortalities and standardized mortality ratios
Variable Number Died (n) Actual mortality Predicted mortality SMR 95% CI
MPM II
0
250 152 0.61 0.55 1.10 0.99–1.21
SAPS II 208 116 0.56 0.56 1.00 0.88–1.13
MPM II
24
208 116 0.56 0.61 0.92 0.80–1.03
APACHE II 208 116 0.56 0.59 0.95 0.83–1.06
Cus MPM II
24
208 116 0.56 0.59 0.94 0.82–1.05
Cus SAPS II 208 116 0.56 0.56 1.00 0.87–1.12
APACHE, Acute Physiology and Chronic Health Evaluation; CI, confidence interval; Cus, customized; MPM, Mortality Prediction Model; SAPS,
Simplified Acute Physiology Score; SMR, standardized mortality ratio.
R120
Critical Care October 2003 Vol 7 No 5 Arabi et al.
Table 3
Lemeshow–Hosmer goodness of fit C-statistics for the six systems
Decile n PD AD PS AS Decile n PD AD PS AS
MPM II
0
APACHE II
1 25 1.45 3 23.55 22 1 21 2.40 1 18.60 20
2 25 3.78 6 21.22 19 2 21 4.98 3 16.02 18
3 25 6.45 10 18.55 15 3 21 7.21 9 13.79 12
4 25 9.60 13 15.40 12 4 21 9.93 11 11.07 10
5 25 13.47 18 11.53 7 5 21 12.49 12 8.51 9
6 25 16.97 18 8.03 7 6 20 14.06 17 5.94 3
7 25 18.81 18 6.19 7 7 20 15.95 17 4.05 3
8 25 20.53 20 4.47 5 8 20 17.08 17 2.92 3
9 25 22.69 25 2.31 0 9 20 17.94 11 2.06 9
10 25 24.29 21 0.71 4 10 20 18.91 17 1.09 3
C-statistic 29.79 P < 0.001 C-statistic 34.89 P < 0.001
MPM II
24
Customized MPM II
24
1 21 1.78 4 19.22 17 1 21 2.65 4 18.35 17
2 21 3.90 7 17.10 14 2 21 4.87 7 16.13 14
3 21 7.12 2 13.88 19 3 21 7.68 2 13.32 19
4 21 10.90 7 10.10 14 4 21 10.74 7 10.26 14
5 21 13.32 11 7.68 10 5 21 12.69 11 8.31 10
6 21 15.23 13 5.77 8 6 21 14.31 13 6.69 8
7 21 17.02 19 3.98 2 7 21 15.93 19 5.07 2
8 21 18.53 15 2.47 6 8 21 17.45 15 3.55 6
9 20 18.88 18 1.12 2 9 20 18.10 18 1.90 2
10 20 19.65 20 0.35 0 10 20 19.22 20 0.78 0
C-statistic 24.82 P = 0.002 C-statistic 17.51 P = 0.03
SAPS II Customized SAPS II
1 21 0.88 3 20.12 18 1 21 2.24 3 18.76 18
2 21 2.71 1 18.29 20 2 21 4.39 1 16.61 20
3 21 5.22 9 15.78 12 3 21 6.62 9 14.38 12
4 21 8.20 12 12.80 9 4 21 8.96 12 12.04 9
5 21 11.57 10 9.43 11 5 21 11.50 10 9.50 11
6 21 14.85 17 6.15 4 6 21 14.08 17 6.92 4
7 20 16.19 14 3.81 6 7 20 15.18 14 4.82 6
8 20 17.19 14 2.81 6 8 20 16.17 14 3.83 6
9 20 18.18 16 1.82 4 9 20 17.25 16 2.75 4
10 20 19.41 19 0.59 1 10 20 18.87 19 1.13 1
C-statistic 23.60 P = 0.003 C-statistic 11.48 P = 0.18
AD, actually died; APACHE, Acute Physiology and Chronic Health Evaluation; AS, actually survived; MPM, Mortality Probability Model; PD,
predicted to die; PS, predicted to survive; SAPS, Simplified Acute Physiology Score.
R121
of particular value when conducting large international multi-
centre studies.
There is a good body of literature addressing ICU outcomes
of septic patients in Western ICUs, including USA [3], France
[23], Italy [24], and the UK [25]. However, apart from in the
West, very little is reported in this field, despite the serious-
ness of sepsis as a public health problem in these countries.
The present study sheds some light on ICU outcomes of
patients admitted with severe sepsis and septic shock in a
Middle Eastern country.
Our study has the strength of being prospective, using stan-
dardized definitions of severe sepsis and septic shock. The
study also has some limitations. First, it was conducted at
only one centre. The results therefore reflect the outcome of
septic patients in a tertiary care centre and they may not be
generalizeable to all hospitals in the country. However, the
study gives some insight into this issue, at least from a tertiary
care perspective.
In conclusion, the present study shows that customized
version of SAPS II (and to lesser extent the customized
MPM II
24
) performed well in predicting mortality in patients
with severe sepsis and septic shock. As such, the customized
versions are better options for mortality prediction in septic
patients than are the general ICU mortality prediction systems.
Competing interests
None declared.
References
1. Rangel-Frausto MS: The epidemiology of bacterial sepsis.
Infect Dis Clin North Am 1999, 13:299-312.
2. Angus DC, Linde-Zwirble WT, Lidicker J, Clermont G, Carcillo J,
Pinsky MR: Epidemiology of severe sepsis in the United
States: analysis of incidence, outcome, and associated costs
of care. Crit Care Med 2001, 29:1303-1310.
3. Angus DC, Wax RS: Epidemiology of sepsis: an update. Crit
Care Med 2001, suppl:S109-S116.
4. The World Health Orgnization: The world health report archives
1995–2000. [ />5. Memish ZA, Ahmed QA: Mecca bound: the challenges ahead. J
Travel Med 2002, 9:202-210.
6. Bone RC, Balk RA, Cerra FB, Dellinger RP, Fein AM, Knaus WA,
Schein RM, Sibbald WJ: American College of Chest Physi-
cians/Society of Critical Care Medicine Consensus Confer-
ence: definitions for sepsis and organ failure and guidelines
for the use of innovative therapies in sepsis. Chest 1992, 101:
1644-1655.
7. Levy MM, Fink MP, Marshall JC, Abraham E, Angus D, Cook D,
Cohen J, Opal SM, Vincent JL, Ramsay G: 2001
SCCM/ESICM/ACCP/ATS/SIS International Sepsis Defini-
tions Conference. Crit Care Med 2003, 31:1250-1256.
8. Friedman G, Silva E, Vincent JL: Has the mortality of septic
shock changed with time? Crit Care Med 1998, 26:2078-2086.
9. Lemeshow S, Le Gall Jr: Modeling the severity of illness of ICU
patients. JAMA 1994, 272:1049-1055.
10. Knaus WA, Draper EA, Wagner DP, Zimmerman JE: APACHE II.
A severity of disease classification system. Crit Care Med
1985, 13:818-829.
11. Le Gall J-R, Lemeshow S, Saulnier F: A new Simplified Acute
Physiology Score (SAPS II) based on a European/North
American multi center study. JAMA 1993, 270:2957-2962.
12. Lemeshow S, Teres D, Klar J, Avrunin JS, Gehlbach SH, Rapoport
J: Mortality Probability Models (MPM II) based on an interna-
tional cohort of intensive care unit patients. JAMA 1993, 270:
2478-2486.
13. Suistomaa M, Niskanen M, Kari A, Hynynen M, Takala J: Cus-
tomized prediction models based on APACHE II and SAPS II
scores in patients with prolonged length of stay in the ICU.
Intensive Care Med 2002, 28:479-485.
Available online />Figure 1
Receiver operating characteristic (ROC) curves for the six mortality prediction systems. APACHE, Acute Physiology and Chronic Health Evaluation;
cus, customized; MPM, Mortality Probability Model; SAPS, Simplified Acute Physiology Score.
R122
14. Angus DC, Clermont G, Kramer DJ, Linde-Zwirble WT, Pinsky
MR: Short-term and long-term outcome prediction with the
Acute Physiology and Chronic Health Evaluation II in System
after orthotopic liver transplantation. Crit Care Med 2000, 28:
150-156.
15. LeGall JR, Lemeshow S, Leleug, Klar J, Huillard J, Rui M. Teres D,
Artigas A: Customized probability models for early severe
sepsis in adult intensive care patients. JAMA 1995, 273:644-
650.
16. Goldhill DR, Sumner A: Outcome of intensive care patients in a
group of British intensive care units. Crit Care Med 1998, 26:
1337-1345.
17. Lemeshow S, Hosmer DW: A Review of goodness of fit statis-
tics for use in the development of logistic regression models.
Am J Epidemiol 1982, 115:92-106.
18. Metz CE: Basic Principles of ROC analysis. Semin Nucl Med
1978, 8:283-298.
19. Hanley JA, McNeil BJ: The meaning and use of the area under
a receiver operating characteristic (ROC) curve. Radiology
1982, 143:29-36.
20. Barriere SL, Lowry SF: An overview of mortality risk prediction
in sepsis. Crit Care Med 1995, 23:376-393.
21. Bernard GR, Vincent JL, Laterre PF, LaRosa SP, Dhainaut JF,
Lopez-Rodriguez A, Steingrub JS, Garber GE, Helterbrand JD, Ely
EW, Fisher CJ Jr: Recombinant human protein C Worldwide
Evaluation in Severe Sepsis (PROWESS) study group. Effi-
cacy and safety of recombinant human activated protein C for
severe sepsis. N Engl J Med 2001, 344:699-709.
22. Warren HS, Suffredini AF, Eichacker PQ, Munford RS: Risks and
benefits of activated protein C treatment for severe sepsis. N
Eng J Med 2002, 347:1027-1030.
23. Brun-Buisson C, Doyon F, Carlet J, Dellamonica P, Gouin F, Lep-
outre A, Mercier JC, Offenstadt G, Regnier B: Incidence, risk
factors, and outcome of severe sepsis and septic shock in
adults. A multicenter prospective study in intensive care units.
French ICU Group for Severe Sepsis. JAMA 1995, 274:968-
974.
24. Salvo I, de Cian W, Musicco M, Langer M, Piadena R, Wolfler A,
Montani C, Magni E: The Italian SEPSIS study: preliminary
results on the incidence and evolution of SIRS, sepsis, severe
sepsis and septic shock. Intensive Care Med 1995, suppl 2:
S244-S249.
25. Edbrooke DL, Hibbert CL, Kingsley JM, Smith S, Bright NM,
Quinn JM: The patient-related costs of care for sepsis patients
in a United Kingdom adult general intensive care unit. Crit
Care Med 1999, 27:1760-1767.
Critical Care October 2003 Vol 7 No 5 Arabi et al.