Báo cáo khoa học: "Preload-independent mechanisms contribute to increased stroke volume following large volume saline infusion in normal volunteers: a prospective interventional study" pps
Bạn đang xem bản rút gọn của tài liệu. Xem và tải ngay bản đầy đủ của tài liệu tại đây (406.19 KB, 9 trang )
R128
Critical Care June 2004 Vol 8 No 3 Kumar et al.
Research
Preload-independent mechanisms contribute to increased stroke
volume following large volume saline infusion in normal
volunteers: a prospective interventional study
Anand Kumar
1
, Ramon Anel
2
, Eugene Bunnell
3
, Sergio Zanotti
2
, Kalim Habet
2
, Cameron Haery
2
,
Stephanie Marshall
4
, Mary Cheang
5
, Alex Neumann
3
, Amjad Ali
6
, Clifford Kavinsky
7
and Joseph E Parrillo
8
1
Associate Professor, Division of Cardiovascular Diseases and Critical Care Medicine, Cooper Hospital/University Medical Center, Robert Wood
Johnson Medical School, Camden, New Jersey, USA and Section of Critical Care Medicine, Health Sciences Centre/St. Boniface Hospital, University
of Manitoba, Manitoba, Canada
2
Fellow, Division of Cardiovascular Diseases and Critical Care Medicine, Rush-Presbyterian-St. Luke's Medical Center, Chicago, Illinois, USA
3
Assistant Professor, Division of Cardiovascular Diseases and Critical Care Medicine, Rush-Presbyterian-St. Luke's Medical Center, Chicago, Illinois,
USA
4
Research Nurse, Division of Cardiovascular Diseases and Critical Care Medicine, Rush-Presbyterian-St. Luke's Medical Center, Chicago, Illinois, USA
5
Statistician, Biostatistical Consulting Unit, Department of Community Health Sciences, Faculty of Medicine, University of Manitoba, Winnipeg,
Manitoba, Canada
6
Professor, Division of Cardiovascular Disease and Critical Care Medicine, Section of Nuclear Medicine, Rush-Presbyterian-St. Luke’s Medical Center,
Chicago, Illinois, USA
7
Associate Professor, Division of Cardiovascular Diseases and Critical Care Medicine, Rush-Presbyterian-St. Luke's Medical Center, Chicago, Illinois,
USA
8
Professor, Division of Cardiovascular Disease and Critical Care Medicine, Cooper Hospital/University Medical Center, Robert Wood Johnson Medical
School, Camden, New Jersey, USA
Corresponding author: Anand Kumar,
R128
CI = cardiac index; CO = cardiac output; CVP = central venous pressure; EDV = end-diastolic volume; EF = ejection fraction; ESV = end-systolic
volume; HR = heart rate; LVEDVI = left ventricular end-diastolic volume index; LVEF = left ventricular ejection fraction; LVESVI = left ventricular end-
systolic volume index; MAP = mean arterial pressure; PAC = pulmonary artery catheter; PWP = pulmonary artery wedge pressure; RVESVI = right
ventricular end-systolic volume index; SBP = systolic blood pressure; SV = stroke volume; TPR = total peripheral resistance; SVI = stroke volume
index.
Abstract
Introduction Resuscitation with saline is a standard initial response to hypotension or shock of almost
any cause. Saline resuscitation is thought to generate an increase in cardiac output through a preload-
dependent (increased end-diastolic volume) augmentation of stroke volume. We sought to confirm this
to be the mechanism by which high-volume saline administration (comparable to that used in
resuscitation of shock) results in improved cardiac output in normal healthy volunteers.
Methods Using a standardized protocol, 24 healthy male (group 1) and 12 healthy mixed sex (group
2) volunteers were infused with 3 l normal (0.9%) saline over 3 hours in a prospective interventional
study. Individuals were studied at baseline and following volume infusion using volumetric
echocardiography (group 1) or a combination of pulmonary artery catheterization and radionuclide
cineangiography (group 2).
Results Saline infusion resulted in minor effects on heart rate and arterial pressures. Stroke volume
index increased significantly (by approximately 15–25%; P < 0.0001). Biventricular end-diastolic volumes
were only inconsistently increased, whereas end-systolic volumes decreased almost uniformly.
Decreased end-systolic volume contributed as much as 40–90% to the stroke volume index response.
Received: 28 November 2003
Revisions requested: 21 January 2004
Revisions received: 2 February 2004
Accepted: 26 February 2004
Published: 16 March 2004
Critical Care 2004, 8:R128-R136 (DOI 10.1186/cc2844)
This article is online at />© 2004 Kumar et al., licensee BioMed Central Ltd. This is an Open
Access article: verbatim copying and redistribution of this article are
permitted in all media for any purpose, provided this notice is
preserved along with the article's original URL.
Open Access
R129
Available online />Introduction
Initial resuscitation of hypovolemic and distributive shock
involves the aggressive infusion of large volumes (several
liters) of intravenous fluids (colloids or crystalloids). For example,
American Trauma Life Support guidelines [1] advocate rapid
administration of 1–2 l crystalloid in the initial management of
hypovolemic shock. Subsequently, volume infusion is
frequently used in critically ill patients to challenge persistent
hypotension or tachycardia. In the teaching of resuscitative
physiology, clinicians are told that the role of volume infusion
is to increase stroke volume (SV) through an increase in
preload (an increase in end-diastolic volume [EDV]) without a
change in afterload or contractility.
Few studies have examined the effect of large quantities of
resuscitative fluids such as normal (0.9%) saline on cardiac
function in normal healthy volunteers. In the present study,
normal volunteers were infused with 3 l normal saline over
3 hours in order to assess how typical resuscitative volumes
affect cardiac volumes and performance. The specific objective
was to determine the extent to which increases in EDV
account for augmentation of SV after large volume
resuscitation. Initial studies were performed using noninvasive
echocardiographic techniques. Biventricular radionuclide
ventriculography and invasive hemodynamic techniques
(thermodilution-capable pulmonary artery catheter [PAC] and
arterial catheter) were utilized for confirmation of results and
extension of findings to right ventricular function.
Normal saline was used because it is the usual crystalloid
solution used in initial resuscitation.
Methods
A total of 36 individuals aged 18–40 years volunteered and
gave written informed consent to participate in the study.
They were within 15% of their ideal body weight, as
determined using Metropolitan Life Tables. The participants
were required to have a normal history, physical examination,
and electrocardiogram within 2 weeks before the start of the
study. Basic hematology, coagulation, biochemistry, and
infectious serology assays, as well as an electrocardiogram,
were found to be normal. Participants were studied after an
overnight fast. Basic screening laboratory studies, including a
complete blood count and electrocardiogram, were repeated.
The individuals had an 18-gauge peripheral intravenous
catheter placed in each arm. Assessment of baseline
hemodynamics was initially done before saline infusion after a
20-min period of stability of vital signs, including heart rate
(HR). After evaluating baseline vital signs and conducting
echocardiographic or radionuclide ventriculographic/invasive
hemodynamic studies, normal saline infusion was begun
intravenously at a rate of 1 l/hour for 3 hours.
All participants were continuously monitored with electro-
cardiography, pulse oximetry, and either automatic sphygmo-
manometry (Dinamap Pro 300
®
, GE Medical Systems,
Tampa, FL, USA) in participants who were studied using
echocardiography or radial arterial catheter in those
participants who were studied using radionuclide ventriculo-
graphy/PAC. A nurse took vital signs (temperature, blood
pressure, HR, and respiratory rate) every 15 min for the
4–6 hour duration of the study. At least one physician was
present during the entire period of study. Repeat
echocardiograms or radionuclide ventriculography/invasive
hemodynamic data, as well as a repeat complete blood
count, were again obtained after infusion of 3 l saline at the
end of the study period. Subjects were supine throughout the
study period.
Participants with PACs and arterial catheters placed had
them removed after the study, and all were discharged
1–2 hours after the final assessment.
Echocardiography
Twenty-four males were recruited for the echocardiographic
portion of the study (group 1). Standard views of the para-
sternal long and short axes, apical four chamber and two
chamber, and Doppler outflow tract across the aortic valve
were taken using a Hewlett Packard 5500 ultrasound device
(Hewlett-Packard, Palo Alto, CA, USA).
SV was determined using the measured left ventricular
outflow (aortic valve) diameter from the parasternal long-axis
view, and an outflow tract velocity measured at the aortic
valve with a Doppler probe from the apical five-chamber view
[2,3]. SV at each point was determined as the mean of five
consecutive measurements obtained at end-expiration.
Cardiac output (CO) was calculated by multiplying this SV by
Indices of ventricular contractility including ejection fraction, ventricular stroke work, and peak systolic
pressure/end-systolic volume index ratio all increased significantly (minimum P < 0.01).
Conclusion The increase in stroke volume associated with high-volume saline infusion into normal
individuals is not only mediated by an increase in end-diastolic volume, as standard teaching suggests,
but also involves a consistent and substantial decrease in end-systolic volumes and increases in basic
indices of cardiac contractility. This phenomenon may be consistent with either an increase in
biventricular contractility or a decrease in afterload.
Keywords cardiac output, resuscitation, saline, ventricular volume, volunteers
R130
Critical Care June 2004 Vol 8 No 3 Kumar et al.
the simultaneous HR. Left ventricular volumes were obtained
using Simpson’s Rule (method of disks), utilizing the average
of volumes from apical four-chamber and two-chamber views
[4]. Ejection fraction (EF) was obtained using the following
equation: (EDV – end-systolic volume [ESV])/EDV. The total
peripheral resistance (TPR) was determined using this
calculated CO and the measured mean arterial pressure
(MAP) from the Dinamap
®
, using the following equation: TPR
(dyne·s/cm
5
) = (79.9 × MAP)/CO. The central venous pressure
(CVP) was omitted in this calculation because of the
negligible effect that the right atrial pressure exerts on this
calculation in normal individuals.
Echocardiograms were read by a single, highly experienced
echocardiographer who was blinded to the individual and
study sequence. Intra-observer and inter-observer variability
for 10 discrete measurements of SV were 6 ± 3% and 7 ± 3%,
respectively. Accuracy of ventricular volumes was internally
validated by comparing SVs derived from integration of the
flow velocity across the aortic valve and subtraction of the
ESV from the EDV. Previous studies have demonstrated that
mean changes of greater than 2% in EDV, 5% in ESV, and
2% in left ventricular ejection fraction (LVEF) in groups of
comparable size to that in the present study represent
clinically significant alterations [5].
Pulmonary artery and radial artery catheterization
Twelve subjects (mixed sex) were recruited for the invasive
catheterization/radionuclide ventriculography portion of the
study (group 2). After informed consent was obtained, a 9-Fr
introducer (Arrow Co., Reading, PA, USA) and a 110 cm
7.5-Fr PAC Swan–Ganz catheter (PA-Edwards Life Sciences,
Irvine, CA, USA) were placed in the right femoral vein using
minimal local anesthesia (lidocaine 2%), followed by
ultrasound and brief fluoroscopic guidance. In addition, a
20 g, 1.5-inch Quick-Flash radial artery catheter (Arrow Co.)
was placed in either the right or left arm. Placement of all
invasive devices was performed by an experienced invasive
cardiologist. Participants were rested for 45 min before
initiation of the study initiation to allow any residual sympa-
thetic stimulation to settle. Fluid loading was begun only
when vital signs, including HR, had returned to prestudy
values for at least 20 min.
Thermodilution COs were measured by three successive
injections of 10 ml cold (6–10°C) dextrose 5% in water at
end-expiration as per standard protocol. The recorded value
was the mean of the three individual values. Recorded values
for pulmonary artery pressure, pulmonary artery wedge
pressure (PWP) and CVP were also obtained at end-
expiration from graphic recordings. Arterial pressure was
simultaneously recorded from the arterial catheter.
Radionuclide ventriculography
Sequential measurement of biventricular EF in group 2
participants was performed by repeat first-pass radionuclide
ventriculograms using
99m
Tc-DPTA, which was injected as a
tight bolus into the central veins using the PAC introducer. In
the study the baseline radionuclide tracer dose was 3 mCi
and the follow-up dose was 7 mCi. The study was performed
in a 30° right anterior oblique projection with a slant hole
collimator fitted onto a small field γ camera interfaced with a
dedicated computer system (ICON, Siemens, Gammasonic,
Hoffman Estates, IL, USA). The data were acquired in frame
mode with 440 frames, each of 60 ms duration. The first
transit cardiac data were reformatted into a multigated study
using the participant’s electrocardiogram recorded with the
first pass data. This method provides independent cinematic
display of both right and left ventricles. EFs are calculated
from the reformatted gated first-pass studies using standard
dual region of interest and background correction [6,7].
For group 2 participants, SV was derived by dividing the
thermodilution CO by the concomitant HR. EDV was
obtained by dividing SV by EF, and ESV was calculated as
EDV – SV. Systemic vascular resistance index was calculated
as (79.9 × [MAP – CVP])/cardiac index (CI), and pulmonary
vascular resistance index as (79.9 × [mean pulmonary artery
pressure – PWP])/CI. Left ventricular stroke work index was
calculated as 0.0136 × (MAP – CVP) × SVI, and right
ventricular stroke work index as 0.0136 × (mean pulmonary
artery pressure – PWP) × stroke volume index (SVI).
The study received ethics approval from the Institutional
Review Board at Rush-Presbyterian-St. Luke’s Medical
Center, in compliance with the Helsinki declaration.
Statistical analysis
Hemodynamic values at baseline and completion of the 3-hour
saline infusion were pooled to derive means and standard
errors of the mean. Hemodynamic values after saline infusion
were compared with baseline values using two-tailed paired
t-test analysis. P < 0.05 was considered statistically
significant. Values are expressed as means ± standard error.
Results
Group 1 findings: echocardiography study
Age, weight, height, and body surface area were 27.8 ± 1.8
years, 76.6 ± 2.8 kg, 173.3 ± 2.5 cm, and 1.91 ± 0.04 m
2
,
respectively.
High-volume saline infusion exerted significant although
modest hemodynamic effects on the normal healthy volunteers
in group 1 (Table 1, Fig. 1). The HR of 64.4 ± 1.8 beats/min
was unchanged after infusion of 3 l saline (mean
64.1 ± 2.0 beats/min). MAP, diastolic blood pressure, and
systolic blood pressure (SBP) were also unchanged through-
out the study.
Given the absence of any change in HR, the increase in CI
(14.7 ± 2.4%; P < 0.0001) was almost exactly matched by
the increase in SVI (14.6 ± 1.4%; P < 0.0001). SVI and CI
R131
Available online />increased in all 24 participants. The approximately 15%
increase in SVI was generated almost entirely through a mean
26.4 ± 2.4% decrease in left ventricular end-systolic volume
index (LVESVI; P < 0.0001). Again, every participant in the
study exhibited a fall in LVESVI with saline loading. The
decrease in LVESVI was responsible for more than 90% of
the increase in SVI in this group. Virtually no increase in mean
left ventricular end-diastolic volume index (LVEDVI) was
noted (1.0 ± 1.5%; not significant) after infusion of 3 l saline.
Overall, 13 participants exhibited increased LVEDVI, whereas
the other 11 had decreased LVEDVI.
Parameters of contractility were significantly increased with
saline infusion. The baseline LVEF increased by 14.0 ± 1.4%
(from 65.5 ± 1.2% to 74.5 ± 1.0% absolute value;
P < 0.0001) after infusion of 3 l saline. All participants
exhibited an increase in LVEF. Similarly, SBP/LVESVI [8], a
relatively load-independent measure of contractility, exhibited
a significant increase (40.2 ± 6.4%; P < 0.0001) from
baseline after high-volume saline infusion. Again, this was a
highly uniform response, with 23 out of 24 participants
exhibiting a clear increase in this parameter.
Given that CO was increased and that MAP was unchanged
by saline infusion, calculated afterload decreased. TPR fell
17.8 ± 3.8% after infusion of 3 l saline (P < 0.0001).
Group 2 findings: radionuclide
cineangiography/pulmonary artery catheterization
Twelve subjects (8 male, 4 female) were recruited for the
invasive monitoring portion of the study. Age, height, and weight
were 30.9 ± 2.8 years, 173.3 ± 2.5 cm, and 86.3 ± 5.1 kg,
respectively.
Effects of infusion of 3 l saline on left ventricular performance
in group 2, studied using radionuclide cineangiography/
PACs, were generally similar to those noted echocardio-
graphically in group 1 (Table 2, Fig. 2f–j). A modest increase
in HR by 5.7 ± 3.5% did not achieve statistical significance,
whereas small increases in SBP (5.9 ± 1.8%; P = 0.0075),
diastolic blood pressure (9.6 ± 3.0%; P = 0.0081) and MAP
(7.8 ± 2.2%; P = 0.004) did. Similarly, there were significant
but more substantial relative increases in pulmonary artery
pressures. Not surprisingly, PWP almost doubled
(77.8 ± 20.6% increase; P = 0.0128) from baseline. Systemic
vascular resistance index and pulmonary vascular resistance
index both fell significantly (by approximately 17% and 28%,
respectively). In all cases, at least 10 of the 12 participants
exhibited changes from baseline consistent with the mean
change in the parameter (i.e. in the same direction).
CI rose almost 30% (P = 0.0006) with SVI increasing by 23%
(P < 0.0005) from baseline. All participants exhibited an
increase in these parameters. The remainder of the increase in
CI was accounted for by the modest and nonsignificant
increase in HR. Unlike in group 1, LVEDVI increased modestly
(approximately 8%; P = 0.0138) but inconsistently (8/12
participants), whereas LVESVI fell to a greater extent
(approximately –17%, P = 0.0131; LVESVI decreased in 10/12
participants). The decrease in LVESVI accounted for 43% of
the increase in SVI. All parameters of left ventricular contractility
(LVEF, left ventricular left ventricular stroke work index, SBP/
LVESVI) were increased by 11–25%. All but one participant
exhibited increases in these parameters with volume loading.
Right ventricular responses substantially paralleled the left
(Table 2; Fig. 2a–e). Right ventricular end-diastolic volume
Table 1
Hemodynamic response to volume loading in echocardiographically studied group (group 1)
Parameter Before saline infusion After saline infusion Percentage change P
HR (beats/min) 64.4 ± 1.8 64.1 ± 2.0 –0.02 ± 1.9 NS
SBP (mmHg) 115.4 ± 2.2 115.2 ± 2.7 –0.1 ± 1.9 NS
DBP (mmHg) 59.3 ± 1.8 57.3 ± 1.8 –3.5 ± 1.5 NS
MAP (mmHg) 80.7 ± 1.8 79.6 ± 1.9 –1.2 ± 1.3 NS
TPR (dyne·s/cm
5
) 599 ± 25 491 ± 27 –17.8 ± 3.8 <0.0001
CI (l/min per m
2
) 2.90 ± 0.07 3.32 ± 0.09 14.7 ± 2.4 <0.0001
SVI (ml/m
2
) 47.5 ± 1.0 54.3 ± 1.2 14.6 ± 1.4 <0.0001
LVEDVI (ml/m
2
) 72.2 ± 1.8 72.7 ± 1.7 1.0 ± 1.3 NS
LVESVI (ml/m
2
) 24.6 ± 1.3 17.9 ± 1.0 –26.4 ± 2.4 <0.0001
LVEF (%) 65.5 ± 1.2 74.5 ± 1.0 14.0 ± 1.4 <0.0001
SBP/LVESVI (mmHg/ml per m
2
) 5.00 ± 0.31 6.88 ± 0.41 40.2 ± 6.4 <0.0001
CI, cardiac index; HR, heart rate; DBP, diastolic blood pressure; LVEDVI, left ventricular end-diastolic volume index; LVEF, left ventricular ejection
fraction; LVESVI, left ventricular end-systolic volume index; MAP, mean arterial pressure; SBP, systolic blood pressure; SVI, stroke volume index;
TPR, total peripheral resistance.
R132
index increased modestly with saline infusion (approximately
10%; P = 0.019) whereas right ventricular end-systolic volume
index (RVESVI) decreased by a smaller but still significant
amount (approximately 7%; P = 0.0335). Eight out of 12
participants exhibited this increase in right ventricular end-
diastolic volume index, and 8 out of 12 also demonstrated a
decrease in RVESVI with volume loading. The decrease in
RVESVI represented 38% of the measured increased in SVI.
Right ventricular contractility parameters (right ventricular EF,
right ventricular stroke work index, systolic pulmonary artery
pressure/RVESVI), like those of the left, were consistently
elevated by 13–88%. Again, all but one participant exhibited
increases in these parameters with volume loading.
Blood hemoglobin concentration dropped from a mean of
14.9 ± 0.4 g/dl (range 12.5–17 g/dl) to 12.7 ± 0.4 g/dl (range
10.5–14.2 g/dl) over the course of the intravascular volume
expansion (P < 0.0001). Total urine output during and imme-
diately after the 3 hours of this study was minimal (mean
<250 ml).
Discussion
In addition to reinforcing observations of known cardiac
responses to fluid resuscitation (modest or no increase in HR
and blood pressure, 15–30% increase in SV and CO), the
present study yielded several novel observations regarding
the mechanisms of that response. The most intriguing of
these pertain to the ventricular responses resulting in
increased SV. Standard clinical teaching suggests that the
increase in SV associated with volume loading is caused by
an increase in ventricular preload (i.e. an increase in EDV).
Despite consistent and highly significant increases in CO and
SV, diastolic ventricular volumes did not respond in parallel
(Fig. 1a, Fig. 2a,f). Group 1 participants in fact demonstrated
no mean change in LVEDVI (Table 1, Fig. 1a), whereas group
2 participants exhibited only a modest increase (Table 2,
Fig. 2f). The reasons for the absence of a consistent increase
in EDV in both ventricles, despite substantial increases in
CVP (about 40%) and PWP (about 80%) in the invasively
studied group 2 participants, are discussed elsewhere [9].
Novertheless, the decrease in LVESVI in both groups
contributed significantly to the increase in SVI (>90% in
group 1 and 43% group 2; Fig. 1b, Fig. 2g). Similarly, in
group 2 participants, a significant fall in RVESVI contributed
substantially (38%) to the increase in SVI (Table 2, Fig. 2b).
This latter observation may be entirely novel because it
appears that no other study has directly examined volumetric
right ventricular response to volume infusion in normal
Critical Care June 2004 Vol 8 No 3 Kumar et al.
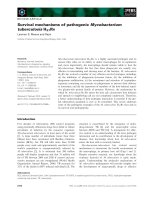
Figure 1
Individual and mean (± standard error) response to 3 l volume loading as measured echocardiographically. (a) Left ventricular end-diastolic volume
index (LVEDVI), (b) left ventricular end-systolic volume index (LVESVI), (c) left ventricular ejection fraction (LVEF), (d) peak systolic blood
pressure/end systolic volume index (PSP/ESVI; left ventricular contractility).
(a) (b)
(c) (d)
R133
animals or humans. The other novel finding of this study was
that volume loading resulted in an increase in indices of
ventricular contractility, including EF, stroke work parameters,
and the SBP/ESV ratios (Fig. 1c,d, Fig. 2c–e,h–j). Again, with
respect to the normal right ventricle, these data have not
previously been described.
The substantial contribution of non-preload-dependent
mechanisms to increased SV in both groups of participants
examined is intriguing in its inconsistency with the standard
teaching of resuscitative physiology. Starling’s law of the
heart has been interpreted to suggest that administration of
large volumes of fluid should result in increased SV through
an increase in EDV. However, data from both groups of
participants in the present study demonstrate that, despite
uniform increases in SV with volume loading, EDV increased
only inconsistently (8/12 in group 1 and 13/24 in group 2),
and that EDV-related increases in SV are relatively modest
(<10% in group 1, and 57% left and 62% right ventricle in
group 2). These data suggest that a significant component of
the increased SV and CO associated with fluid loading is due
to mechanisms that are unrelated to an increase in ventricular
preload and the concomitant Starling response. Given the
lack of significant alteration in HR, volume-related changes in
contractility or afterload are implicated.
The increased ventricular stroke work indices and EF seen in
virtually all patients are potentially compatible with a volume-
Available online />Table 2
Hemodynamic response to volume loading in pulmonary artery catheter/radionuclide cineangiogram studied group
Parameter Before saline infusion After saline infusion Percentage change P
HR (beats/min) 68.4 ± 3.4 72.2 ± 4.1 5.7 ± 3.5 NS
SBP (mmHg) 126.0 ± 4.7 132.4 ± 4.2 5.9 ± 1.8 0.0075
DBP (mmHg) 69.4 ± 2.8 75.7 ± 2.8 9.6 ± 3.0 0.0081
MAP (mmHg) 88.1 ± 3.3 94.6 ± 3.0 7.8 ± 2.2 0.004
CVP (mmHg) 9.4 ± 0.7 12.4 ± 0.9 41.5 ± 15.2 0.028
SPAP (mmHg) 22.5 ± 1.0 29.2 ± 1.4 30.6 ± 5.6 0.0001
DPAP (mmHg) 11.3 ± 0.8 15.4 ± 0.7 44.1 ± 13.4 0.0065
MPAP (mmHg) 15.1 ± 0.7 20.0 ± 0.9 36.2 ± 9.2 0.0019
PWP (mmHg) 9.7 ± 0.9 15.3 ± 0.8 77.8 ± 26.4 0.0128
CI (l/min per m
2
) 2.96 ± 0.12 3.87 ± 0.29 30.0 ± 6.5 0.0006
SVI (ml/m
2
) 44.0 ± 1.9 54.1 ± 3.0 23.1 ± 4.7 0.0005
LVEDVI (ml/m
2
) 70.6 ± 2.2 76.3 ± 4.0 7.7 ± 2.7 0.0138
LVESVI (ml/m
2
) 26.6 ± 0.8 22.3 ± 0.6 –17.1 ± 5.1 0.0131
LVEF (%) 62 ± 1 69 ± 1 11.2 ± 2.2 0.0003
LVSWI (g/beats per m
2
) 46.6 ± 2.5 58.0 ± 3.6 25.1 ± 5.1 0.0004
SBP/LVESVI (mmHg/ml per m
2
) 4.77 ± 0.25 5.71 ± 0.40 19.9 ± 6.1 0.0071
SVRI (dyne·s per cm
5
per m
2
) 2140 ± 100 1779 ± 114 –16.5 ± 4.6 0.0039
RVEDVI (ml/m
2
) 81.8 ± 4.2 89.6 ± 5.8 9.5 ± 3.5 0.019
RVESVI (ml/m
2
) 37.8 ± 2.7 34.0 ± 2.9 –6.5 ± 2.7 0.0335
RVEF (%) 54 ± 1 61 ± 2 12.9 ± 1.6 <0.0001
RVSWI (g/beat per m
2
) 3.4 ± 0.5 5.8 ± 0.9 88.7 ± 24.8 0.0038
SPAP/RVESVI (mmHg/ml per m
2
) 0.62 ± 0.04 0.94 ± 0.13 48.2 ± 14.6 0.0063
PVRI (dyne·s per cm
5
per m
2
) 147 ± 17 100 ± 16 –27.6 ± 10.9 0.0264
CI, cardiac index; CVP, central venous pressure; DBP, diastolic blood pressure; DPAP, diastolic pulmonary artery pressure; HR, heart rate;
LVEDVI, left ventricular end-diastolic volume index; LVEF, left ventricular ejection fraction; LVESVI, left ventricular end-systolic volume index;
LVSWI, left ventricular stroke work index; MAP, mean arterial pressure; MPAP, mean pulmonary artery pressure; PAC, pulmonary artery catheter;
PSP, peak systolic blood pressure; PVRI, pulmonary vascular resistance index; PWP, pulmonary artery wedge pressure; RVEDVI, right ventricular
end-diastolic volume index; RVEF, right ventricular ejection fraction; RVESVI, right ventricular end-systolic volume index; RVSWI, right ventricular
stroke work index; SBP, systolic blood pressure; SPAP, systolic pulmonary artery pressure; SVI, stroke volume index; SVRI, systemic vascular
resistance index.
R134
related increase in cardiac contractility (Fig. 1c, Fig. 2c,d,h,i).
In addition, the uniform decrease in ESVs in the absence of
evidence of increased sympathetic tone (with mean HR
unchanged) support this possibility (Fig. 1b, Fig. 2b,g) [10–13].
Although these parameters cannot differentiate between
increased contractility and decreased afterload because of
their load dependence, the relatively load-independent peak
systolic pressures/ESV (for both the right and left ventricles)
appear to support the former (Fig. 1d, Fig. 2e,j).
Several cellular and physiologic mechanisms could potentially
account for an increase in cardiac contractility in response to
high-volume saline infusion. Hypertonic saline exerts signifi-
cant inotropic effects based on modulation of sarcolemmal
calcium fluxes [14]. Because the sodium concentration of
normal saline is 5–10 mEq/l, which is higher than normal values
for serum, infusion of large volumes of normal saline may afford
a similar but attenuated myocardial stimulation. Alternatively,
Bainbridge described a neurologically mediated reflex of
increased HR and contractility in response to rapid volume
infusions in large animals [15,16]. More recently, Lew [17,18]
described volume-induced increases in myocardial contractility
in denervated dogs. Although these reflexes were elicited with
liters of fluid administered within minutes in both cases, an
attenuated form of the responses could explain our findings.
Although the hemodynamic parameters utilized in the present
study are commonly accepted among intensivists as indices
of contractility, they are substantially load-dependent. Augmen-
tation of SV due to increases in EDV will necessarily (as a
function of the mathematical relationship) be associated with
elevations in EF and SWI, even if there is no increase in
actual contractility. Only if preload and afterload hold constant
can improved contractility be inferred from increases in these
parameters. Even the ostensibly load-independent parameter
peak SBP/end-systolic volume index, although relatively
insensitive to preload alterations, has been shown to be
affected by alterations in afterload [19,20]. For these
reasons, the preload-independent element of the increase in
SV could be due to decreases in afterload that mimic
increased contractility when assessed using the hemo-
dynamic indices of this study.
Calvin and colleagues [21] have implicated volume-induced
vasodilation after noting significant decreases in end-systolic
volume index after fluid resuscitation in a subgroup of
critically ill patients. Several contributory mechanisms can be
proposed. A decrease in endogenous catecholamines,
particularly in stressed participants, could generate a relative
loss of vasoconstrictor tone. However, healthy, unstressed
adults were studied in our study. Centrally mediated
Critical Care June 2004 Vol 8 No 3 Kumar et al.
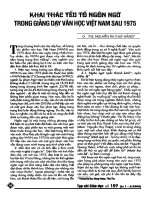
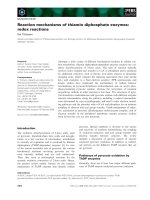
Figure 2
Individual and mean (± standard error) to 3 l volume loading as measured using radionuclide cineangiography and invasive hemodynamic
monitoring. (a) Right ventricular end-diastolic volume index (RVEDVI), (b) right ventricular end-systolic volume index (RVEDVI), (c) right ventricular
stroke work index (RVSWI), (d) right ventricular ejection fraction (RVEF), (e) peak systolic pulmonary artery pressure/right ventricular end-systolic
volume index (right ventricular contractility), (f) left ventricular end-diastolic volume index (LVEDVI), (g) left ventricular end-systolic volume index
(LVESVI), (h) left ventricular stroke work index (LVSWI), (i) left ventricular ejection fraction (LVEF), (j) peak systolic blood pressure/left ventricular
end-systolic volume index (PSP/LVESVI).
(a) (b) (c) (d) (e)
(f) (g) (h) (i) (j)
R135
vasomotor relaxation responses mediated by low pressure
baroreceptors could mediate peripheral vasodilation in
healthy individuals [22]. Alternatively, increased release of the
vasodilatory peptide atrial natriuretic factor has been
described with rapid volume expansion [23,24]. Large volume
infusion of saline could also cause alterations in blood electro-
lytes with increased chloride and decreased bicarbonate
(nonanion gap metabolic acidosis), which could also result in
vasomotor responses. Finally, a simple mechanical effect
related to decreased blood viscosity associated with
transient hypervolemic hemodilution could play a role. The
participants in this study exhibited a 14.3 ± 0.8% drop in
blood hemoglobin during the course of fluid infusion. At least
one study has suggested decreased whole blood viscosity as
a cause of decreased systolic left ventricular cross-sectional
area during volume loading [25].
Unfortunately, the design of the present study does not allow
definitive differentiation between altered contractility and
afterload as a cause of the preload-independent element of
the SV response. Systemic vascular resistance and TPR will
be decreased as a mathematical consequence of increased
CO with a maintained MAP, whereas EF, stroke work index,
and peak SBP/end-systolic volume index are sensitive to one
or both of preload and afterload alterations.
Studies of ventricular response to acute increases in
volume status in normal humans are extremely limited. Nixon
and colleagues [26] used a tilt table to alter preload in
healthy volunteers. A head-down tilt increased echo-
cardiographically determined left ventricular EDV without a
significant change in ESV; LVEF also increased but mean
velocity of circumferential cardiac fiber shortening – a
relatively preload-independent index of cardiac contractility –
was unchanged. Mangano and coworkers [27] examined
the ventricular responses of patients with normal ventricular
function following coronary artery bypass grafting to graded
infusion of whole blood using radionuclide ventriculography
and invasive hemodynamic monitoring. They found that EDV
increased (mostly at lower ventricular filling pressures) and
EF fell, implying an increase in ESV. In contrast, Van Daele
and colleagues [25] demonstrated a sequential increase in
EDV with a concurrent decrease in ESV during graded
volume loading with a fixed crystalloid/colloid fluid regimen
in preoperative patients undergoing orthopedic or
oncologic surgery. Calvin and colleagues [21] also
demonstrated an increase in EF (associated with a
decrease in ESV) as the dominant mechanism of
augmented SVI in response to fluid loading with 5%
albumin in about almost half of a group of critically ill
patients. One of the differentiating elements between the
contribution of decreased ESV to SV in the two latter
mentioned studies is that both were performed using a
standard crystalloid or colloid solution, whereas those with
an increase or no change in ESV involved whole blood
transfusion or internal blood volume recruitment.
The two subject groups in the present study differed in the
relative contribution of a decrease in ESV to augmentation of
SV. Group 1 participants studied echocardiographically
exhibited almost complete dependence of SV response on
decreased LVESVI, whereas in group 2 participants studied
with PAC/radionuclide cineangiography increases in ESV
accounted for almost half of the SV response. The reasons
for this difference may include random population variation,
sex differences between the groups, or methodologic
differences in the techniques used to measure cardiac
responses. We believe that the former is more likely because
a third, larger subject group has recently been examined
echocardiographically, yielding EDV changes intermediate to
the two groups in the present study [28] In addition,
examination of the responses of different sexes in group 2
demonstrated similar patterns. In either case, both groups in
the present study exhibited similar results with respect to
decreases in ESV and increases in contractility indices. An
increase in EDV was only inconsistently noted.
Although interesting, the findings of the study should only be
extrapolated to critically ill patients with substantial caution.
The healthy volunteers in the study were euvolemic and had
normal cardiac and vascular function. Critically ill patients, in
contrast, may have an abnormal volume status depending on
the nature of the underlying disorder and the degree of
resuscitation. In addition, alterations in systolic contractility,
diastolic lusitropy, and vascular impedance may exist in such
patients. Nevertheless, these data suggest that the effect of
large volume resuscitation in critically ill patients should be re-
examined with a view to developing a better understanding of
the cardiovascular mechanics of response. Standard medical
teaching suggesting that increased SV following fluid
resuscitation results solely from increased cardiac preload
(increased EDVI) may overlook significant elements of the
cardiovascular response that are independent of preload
(diastolic ventricular volume).
Conclusion
The mechanism of the cardiovascular responses noted in the
present study cannot be fully delineated based on the
available data. However, several conclusions may be drawn.
First, infusion of saline at a volume consistent with clinical
resuscitation produces a substantial increase in SV and CI in
normal individuals. Second, in contrast to standard dogma,
the increase in SV associated with such aggressive saline
loading is substantially generated by a decrease in ESV with
modest increases in EDV. Third, these changes in ventricular
volumes and performance occur in parallel in both the right
and left ventricles. Finally, these data suggest that resusci-
tative level volume loading leads to an increase in indices of
right and left ventricular contractility, including those that are
often considered to be load-independent. However, these
responses can potentially be explained by either increased
contractility or decreased afterload. Further studies will be
required if we are to understand fully the cardiovascular
Available online />R136
mechanics of volume loading in normal individuals as well as
critically ill patients in the intensive care unit.
Competing interests
None declared.
References
1. Committee on Trauma Research of the American College of Sur-
geons: Advanced Trauma Life Support Course Manual. 6th
Edition. Chicago: Committee on Trauma Research, American
College of Surgeons; 1997.
2. Huntsman LL, Stewart DK, Barnes SR, Franklin SB, Colocousis JS,
Hessel EA: Noninvasive doppler determination of cardiac
output in man. Clinical validation. Circulation 1983, 67:593-601.
3. Lewis JF, Kuo LC, Nelson JG, Limacher MC, Quinones MA:
Pulsed Doppler echocardiographic determination of stroke
volume and cardiac output: clinical validation of two new
methods using the apical window. Circulation 1984, 70:425-
531.
4. Takenaka A, Iwase M, Sobue T, Yokota M: The discrepancy
between echocardiography, cineventriculography and ther-
modilution. Evaluation of left ventricular volume and ejection
fraction. Int J Card Imaging 1995, 11:255-262.
5. Gordon EP, Schnittger I, Fitzgerald PJ, Williams P, Popp RL:
Reproducibility of left ventricular volumes by two-dimensional
echocardiography. J Am Coll Cardiol 1983, 2:506-513.
6. Morrison DA, Turgeon J, Ovitt T: Right ventricular ejection frac-
tion measurement: Contrast ventriculography versus gated
blood pool and gated first-pass radionuclide methods. Am J
Cardiol 1984, 54:651-653.
7. Port SC: Recent advances in first-pass radionuclide angiogra-
phy. Cardiol Clin North Am 1994, 12:359-372.
8. Nivatpumin T, Katz S, Scheuer J: Peak left ventricular systolic
pressure/end-systolic volume ratio: a sensitive detector of
left ventricular disease. Am J Cardiol 1979, 43:969-674.
9. Kumar A, Anel R, Bunnell E, Habet K, Zanotti S, Marshall S,
Neumann A, Ali A, Kavinsky C, Cheang M, Parrillo JE: PWP and
CVP fail to predict ventricular filling volume, cardiac perfor-
mance or the response to volume infusion in normal subjects.
Crit Care Med 2004, 32:691-699
10. Taylor RR, Cingolani HE, McDonald RH: Relationship between
left ventricular volume, ejected fraction, and wall stress. Am J
Physiol 1966, 211:674-680.
11. Weber KT, Janicki JS, Reeves RC, Hefner LL: Factors influenc-
ing left ventricular shortening in isolated canine heart. Am J
Physiol 1976, 230:419-426.
12. Weber KT, Janicki JS, Hefner LL: Left ventricular force-length
relations of isovolumic and ejecting contractions. Am J Physiol
1976, 231:337
13. Ilebekk A, Kiil F: Role of preload and inotropy in stroke volume
regulation at constant heart rate. Scand J Clin Lab Invest
1979, 39:71-78.
14. Mouren S, Delayance S, Mion G, Souktani R, Fellahi JL, Arthaud
M, Baron JF, Viars P: Mechanisms of increased myocardial
contractility with hypertonic saline solutions in isolated blood-
perfused rabbit hearts. Anesth Analg 1995, 81:777-782.
15. Hakumaki MO: Seventy years of the Bainbridge reflex. Acta
Physiol Scand 1987, 130:177-185.
16. Boettcher DH, Zimpfer M, Vatner SF: Phylogenesis of the Bain-
bridge reflex. Am J Physiol 1982, 242:R244-R246.
17. Lew WY: Mechanisms of volume-induced increase in left ven-
tricular contractility. Am J Physiol 1993, 265:H1778-H1786.
18. Lew WY: Time-dependent increase in left ventricular contrac-
tility following acute volume loading in the dog. Circ Res
1988, 63:635-647.
19. Robotham JL, Takata M, Berman M, Harasawa Y: Ejection frac-
tion revisited. Anesthesiology 1991, 74:172-183.
20. Carabello BA, Spann JF: The uses and limitations of end-sys-
tolic indices of left ventricular function. Circulation 1984, 69:
1058-1064.
21. Calvin JE, Driedger AA, Sibbald WJ: The hemodynamic effect of
rapid fluid infusion in critically ill patients. Surgery 1981, 90:
61-76.
22. Oberg B, Thoren P: Studies on left ventricular receptors; sig-
naling in non-medullated vagal afferents. Acta Physiol Scand
1972, 85:145-163.
23. Ohki S, Ishikawa S, Ohtaki A, Takahashi T, Koyano T, Otani Y,
Murakami J, Mohara J, Isa Y, Kunimoto F, Morishita Y: Hemody-
namic effects of alpha-human atrial natriuretic polypeptide on
patients undergoing open-heart surgery. J Cardiovasc Surg
1999, 40:781-785.
24. Legault L, van Nguyen P, Holliwell DL, Leenen FH: Hemody-
namic and plasma atrial natriuretic factor responses to
cardiac volume loading in young versus older normotensive
humans. Can J Physiol Pharmacol 1992, 70:1549-1554.
25. van Daele ME, Trouwborst A, van Woerkens LC, Tenbrinck R,
Fraser AG, Roelandt JR: Transesophageal echocardiography
monitoring of preoperative acute hypervolemic hemodilution.
Anesthesiology 1994, 81:602-609.
26. Nixon JV, Murray RG, Leonard PD, Mitchell JH, Blomqvist CG:
Effect of large variations in preload on left ventricular perfor-
mance characteristics in normal subjects. Circulation 1982,
65:698-703.
27. Mangano DT, Van Dyke DC, Ellis RJ: The effect of increasing
preload on ventricular output and ejection in man: limitations
of the Frank–Starling mechanism. Circulation 1980, 62:535-
541.
28. Kumar A, Anel R, Bunnell E, Habet K, Neumann A, Wolff D,
Rosenson R, Cheang M, Parrillo JE: Effect of large volume infu-
sion on left ventricular volumes, performance and contractility
parameters in normal volunteers. Intensive Care Med 2004, in
press.
Critical Care June 2004 Vol 8 No 3 Kumar et al.
Key messages
• Increased stroke volume associated with aggressive
saline infusion in normal subjects is substantially
generated through a decrease in end-systolic volumes
rather than increases in end-diastolic volume
• This response is consistent between both the right and
left ventricles.
• Large volume fluid infusion leads to increases in basic
indices of biventricular contractility although these
could be explained by changes in inotropy or afterload.