intensive insulin therapy in the medical icu
Bạn đang xem bản rút gọn của tài liệu. Xem và tải ngay bản đầy đủ của tài liệu tại đây (304.92 KB, 13 trang )
n engl j med 354;5 www.nejm.org february 2, 2006
449
The new england
journal
of medicine
established in 1812 february 2, 2006 vol. 354 no. 5
Intensive Insulin Therapy in the Medical ICU
Greet Van den Berghe, M.D., Ph.D., Alexander Wilmer, M.D., Ph.D., Greet Hermans, M.D.,
Wouter Meersseman, M.D., Pieter J. Wouters, M.Sc., Ilse Milants, R.N., Eric Van Wijngaerden, M.D., Ph.D.,
Herman Bobbaers, M.D., Ph.D., and Roger Bouillon, M.D., Ph.D.
Abstract
From the Departments of Intensive Care
Medicine (G.V.B., P.J.W., I.M.) and Medi-
cal Intensive Care Medicine (A.W., G.H.,
W.M., E.V.W., H.B.) and the Laboratory for
Experimental Medicine and Endocrinol-
ogy (R.B.), Catholic University of Leuven,
Leuven, Belgium. Address reprint requests
to Dr. Van den Berghe at the Department
of Intensive Care Medicine, Catholic Uni-
versity of Leuven, B-3000 Leuven, Bel-
gium, or at greta.vandenberghe@med.
kuleuven.be.
N Engl J Med 2006;354:449-61.
Copyright © 2006 Massachusetts Medical Society.
Background
Intensive insulin therapy reduces morbidity and mortality in patients in surgical in-
tensive care units (ICUs), but its role in patients in medical ICUs is unknown.
Methods
In a prospective, randomized, controlled study of adult patients admitted to our
medical ICU, we studied patients who were considered to need intensive care for at
least three days. On admission, patients were randomly assigned to strict normal-
ization of blood glucose levels (80 to 110 mg per deciliter [4.4 to 6.1 mmol per liter])
with the use of insulin infusion or to conventional therapy (insulin administered
when the blood glucose level exceeded 215 mg per deciliter [12 mmol per liter], with
the infusion tapered when the level fell below 180 mg per deciliter [10 mmol per
liter]). There was a history of diabetes in 16.9 percent of the patients.
Results
In the intention-to-treat analysis of 1200 patients, intensive insulin therapy reduced
blood glucose levels but did not significantly reduce in-hospital mortality (40.0 per-
cent in the conventional-treatment group vs. 37.3 percent in the intensive-treatment
group, P = 0.33). However, morbidity was significantly reduced by the prevention of
newly acquired kidney injury, accelerated weaning from mechanical ventilation, and
accelerated discharge from the ICU and the hospital. Although length of stay in the
ICU could not be predicted on admission, among 433 patients who stayed in the ICU
for less than three days, mortality was greater among those receiving intensive in-
sulin therapy. In contrast, among 767 patients who stayed in the ICU for three or
more days, in-hospital mortality in the 386 who received intensive insulin therapy
was reduced from 52.5 to 43.0 percent (P = 0.009) and morbidity was also reduced.
Conclusions
Intensive insulin therapy significantly reduced morbidity but not mortality among
all patients in the medical ICU. Although the risk of subsequent death and disease
was reduced in patients treated for three or more days, these patients could not be
identified before therapy. Further studies are needed to confirm these preliminary
data. (ClinicalTrials.gov number, NCT00115479.)
Copyright © 2006 Massachusetts Medical Society. All rights reserved.
Downloaded from www.nejm.org on April 10, 2006 . This article is being provided free of charge for use in Viet Nam.
The new england journal of medicine
n engl j med 354;5 www.nejm.org february 2, 2006
450
H
yperglycemia and insulin resis-
tance are common in severe illness and
are associated with adverse outcomes.
1-4
In a previous randomized, controlled study con-
ducted in a surgical intensive care unit (ICU), strict
control of blood glucose levels with insulin re-
duced morbidity and mortality,
5,6
significantly re-
ducing in-hospital mortality from 11 to 7 percent
in the entire study population. In a subgroup of
patients who stayed in the ICU for three or more
days, however, the benefit was much more pro-
nounced, reducing mortality from 21 to 14 percent
among patients treated for at least three days and
from 26 to 17 percent among those treated for at
least five days. Complications, such as severe in-
fections and organ failure, were reduced. Several
potential mechanisms may explain these benefits
— prevention of immune dysfunction,
7
reduction
of systemic inflammation,
8
and protection of the
endothelium
9,10
and of mitochondrial ultrastruc-
ture and function.
11
It remains unclear whether intensive insulin
therapy also improves the prognosis of patients in
a medical ICU, who often are more severely ill than
are patients in a surgical ICU and have a higher
risk of death.
4,12,13
The study in a surgical ICU,
5
two studies of patients with diabetes with acute
myocardial infarction,
14,15
and observations in pa-
tients with diabetes undergoing coronary-bypass
surgery
16
suggested that insulin-titrated blood glu-
cose control should be continued for at least a
few days to achieve a detectable outcome benefit.
We therefore conducted a randomized, controlled
study of patients in a medical ICU, targeting those
requiring intensive care for at least a third day.
Methods
Adult patients admitted to the medical ICU who
were assumed to require at least a third day of
intensive care were eligible for inclusion. We ex-
cluded surgical ICU patients and medical patients
able to receive oral nutrition, because such patients
usually need less than three days of intensive
care, and patients with do-not-resuscitate orders
on admission (Fig. 1). Written informed consent
was obtained from the closest family member, be-
cause patients were unable to give consent. The
protocol and consent forms were approved by
the institutional review board of the university.
The study was carried out between March 2002
and May 2005.
Study Design
On admission to the ICU, patients were randomly
assigned to receive either intensive insulin treat-
ment (intensive-treatment group) or conventional
insulin treatment (conventional-treatment group).
Treatment assignment was performed with the
use of sealed envelopes, stratified according to
diagnostic category (
Table 1
), and balanced with
the use of permuted blocks of 10. In the conven-
tional-treatment group, continuous insulin infu-
sion (50 IU of Actrapid HM [Novo Nordisk]) in
50 ml of 0.9 percent sodium chloride) with the use
of a pump (Perfusor-FM pump, B. Braun), was
started only when the blood glucose level exceed-
ed 215 mg per deciliter (12 mmol per liter) and
was adjusted to maintain a blood glucose level of
between 180 and 200 mg per deciliter (10 and 11
mmol per liter). When the blood glucose level fell
below 180 mg per deciliter, the insulin infusion
was tapered and eventually stopped.
In the intensive-treatment group, insulin in-
fusion was started when the blood glucose level
exceeded 110 mg per deciliter (6.1 mmol per liter)
and was adjusted to maintain normoglycemia (80
to 110 mg per deciliter [4.4 to 6.1 mmol per liter]).
The maximal continuous intravenous insulin
infusion was arbitrarily set at 50 IU per hour.
At the patient’s discharge from intensive care,
a conventional approach was adopted (mainte-
nance of blood glucose at 200 mg per deciliter
or less).
The dose of insulin was adjusted according to
whole-blood glucose levels, measured at one-to-
four-hour intervals in arterial blood or, when an
arterial catheter was not available, in capillary
blood, with the use of a point-of-care glucometer
(HemoCue B-glucose analyzer, HemoCue). Adjust-
ments were made by the nurses in the ICU; the
usual number of nurses (2.5 full-time-equivalent
nurses per bed in the ICU) was not changed for
the study. The nurses used titration guidelines that
were adapted from the study in the surgical ICU.
5
When patients were hemodynamically stable,
enteral feeding was started according to routine
guidelines. The guidelines aimed at a total of 22
to 30 kcal per kilogram of body weight per 24
hours with balanced composition (0.08 to 0.25 g
of nitrogen per kilogram of body weight per 24
hours and 20 to 40 percent of nonprotein kilo-
calories as lipids).
17
Enteral feeding was attempt-
ed as early as possible.
Copyright © 2006 Massachusetts Medical Society. All rights reserved.
Downloaded from www.nejm.org on April 10, 2006 . This article is being provided free of charge for use in Viet Nam.
Intensive Insulin Therapy in the Medical ICU
n engl j med 354;5 www.nejm.org february 2, 2006
451
Data Collec tion
At baseline, data on demographic and clinical char-
acteristics of the patients were obtained, includ-
ing information necessary to determine the se-
verity of illness and the use of intensive care
resources (
Table 1
). These data were scored ac-
cording to the Acute Physiology and Chronic
Health Evaluation (APACHE II)
18
system and sim-
plified Therapeutic Intervention Scoring System-
28 (TISS-28),
19,20
with higher values indicating
more severe illness and more therapeutic inter-
ventions, respectively.
Blood was systematically sampled and blood
glucose levels were measured on admission and
subsequently every four hours in all patients. More
frequent blood glucose measurements were per-
formed whenever the attending nurse considered
them necessary and whenever there had been a
steep rise or fall in the blood glucose level on the
previous reading. Blood glucose levels that were
measured on admission and daily in the morn-
ing during the study, and hypoglycemic events
(defined as blood glucose levels of ≤40 mg per
deciliter [2.2 mmol per liter]) were analyzed.
According to clinical guidelines, blood cultures
were obtained whenever the central body tem-
perature exceeded 38.5°C or when other clinical
signs of sepsis were present.
21,22
Results were in-
terpreted by an investigator blinded to the treat-
ment assignment. An episode of bacteremia was
defined by the first positive culture in a series.
To identify bacteremia with coagulase-negative
staphylococci, identical strains (compared by an-
tibiogram) in two or more positive blood cultures
were required.
21,22
A distinction was made between
primary and secondary bacteremia, depending on
whether or not a focus could be identified.
The clinical cause of a death in the ICU was
determined by a senior physician blinded to the
treatment assignments. The causes of deaths oc-
curring after discharge from the ICU could not be
identified.
Outcome Measures
The primary outcome measure was death from
any cause in the hospital. Secondary, predefined
outcome measures were mortality in the ICU, 90-
day mortality, days to weaning from mechanical
ventilation, days in the ICU and in the hospital,
the initiation of dialysis, new kidney injury during
intensive care (defined as either a level of serum
creatinine twice that present on admission to the
ICU
23
or a peak level of serum creatinine of >2.5 mg
per deciliter [220 μmol per liter]), days of inotro-
pic or vasopressor support, presence or absence of
hyperinflammation (defined as a C-reactive pro-
tein level of >150 mg per deciliter), presence or
absence of bacteremia, prolonged (i.e., more than
10 days) use of antibiotics, and the presence or
absence of hyperbilirubinemia (defined as a biliru-
bin level of >3 mg per deciliter [51 μmol per liter]).
Use of intensive care resources was assessed on
the basis of cumulative TISS-28 scores (the sum
of daily scores), indicating the total number of
interventions per patient.
19
We performed a pre-
defined subgroup analysis for patients staying in
the ICU for at least a third day. A post hoc explor-
atory mortality analysis was performed censoring
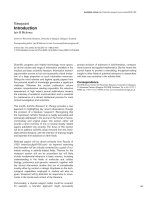
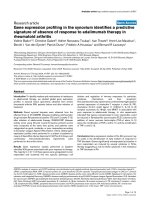
1200 Underwent randomization
2110 Evaluated
863 Were excluded
387 Were expected to stay
in ICU <3 days (eating)
269 Had DNR orders on
admission
150 Were postoperative
38 Were participating in
another study
19 Were ineligible for
other reasons
47 Did not provide consent
605 Assigned to conventional
treatment
595 Assigned to intensive
treatment
381 Stayed in ICU for 3 days 386 Stayed in ICU for 3 days
Figure 1. Patients in the Study.
All adult patients admitted to the medical intensive care unit (ICU) from
March 14, 2002, onward who were assumed to require at least a third day
of intensive care were eligible for inclusion. Of those, 767 patients re-
mained in the ICU for at least a third day. DNR denotes do not resuscitate.
Copyright © 2006 Massachusetts Medical Society. All rights reserved.
Downloaded from www.nejm.org on April 10, 2006 . This article is being provided free of charge for use in Viet Nam.
The new england journal of medicine
n engl j med 354;5 www.nejm.org february 2, 2006
452
patients for whom intensive care was limited or
who were withdrawn from intensive care by a se-
nior attending physician within 72 hours after
admission for reasons of futility.
To minimize the possibility of bias in assess-
ing the ICU stay caused by delays in the transfer
of patients to a regular ward because of the un-
availability of beds, patients were considered to
be ready for discharge when they no longer needed
vital-organ support and were receiving at least
two thirds of their caloric intake by the normal
enteral route or when they were sent to a ward.
Physicians on the general wards to which patients
were transferred from intensive care had no access
to the results of blood glucose testing and were
unaware of the study treatment assignment.
Statis tical Analysis
On the basis of data from our previous study,
5
we
hypothesized an absolute reduction in the risk of
death of 7 percent after at least three days of in-
tensive insulin therapy. Testing this hypothesis
required a sample of 1200 patients for a two-sided
alpha level of less than 0.05 and a beta level of 0.2
in the targeted group of patients staying in the
ICU for three or more days.
Table 1. Baseline Characteristics of the Patients.*
Variable Intention-to-Treat Group Group in ICU for ≥3 Days
Conventional
Treatment
(N = 605)
Intensive
Treatment
(N = 595)
P Value Conventional
Treatment
(N = 381)
Intensive
Treatment
(N = 386)
P Value†
Male sex — no. (%)
382 (63.1) 356 (60) 0.24 243 (64) 224 (58) 0.10
Age — yr
64±16 63±16 0.61 64±16 62±16 0.20
BMI
24.8±5.1 25.1±5.5 0.29 24.6±5.1 25.4±5.9 0.06
Diagnostic category — no. (% of
patients in the category)
0.99 0.70
Respiratory
261 (51.0) 251 (49.0) 172 (47.9) 187 (52.1)
Gastrointestinal or liver
152 (49.7) 154 (50.3) 89 (55.6) 71 (44.4)
Hematologic or oncologic
51 (52.6) 46 (47.4) 37 (48.7) 39 (51.3)
Other sepsis
45 (50.0) 45 (50.0) 30 (46.9) 34 (53.1)
Cardiovascular
24 (48.0) 26 (52.0) 15 (45.5) 18 (54.5)
Neurologic
31 (50.8) 30 (49.2) 14 (50.0) 14 (50.0)
Renal
20 (45.5) 24 (54.5) 11 (45.8) 13 (54.2)
Metabolic
11 (55.0) 9 (45.0) 10 (66.7) 5 (33.3)
Other
10 (50.0) 10 (50.0) 3 (37.5) 5 (62.5)
History of cancer — no. (%)
128 (21.2) 134 (22.5) 0.57 90 (23.6) 98 (25.4) 0.57
Dialysis-dependent kidney failure
before acute event — no. (%)
37 (6.1) 37 (6.2) 0.94 29 (7.6) 31 (8.0) 0.83
Kidney failure on admission
to ICU — no.(%)‡
120 (19.8) 119 (20.0) 0.94 92 (24.1) 82 (21.2) 0.34
History of diabetes — no. (%)
97 (16.0) 106 (17.8) 0.41 58 (15.2) 59 (15.3) 0.98
Treated with insulin
51 (8.4) 65 (10.9) 27 (7.0) 41 (10.6)
Treated with oral antidiabetic
agent, diet, or both
46 (7.6) 41 (6.9) 31 (8.1) 18 (4.7)
Baseline APACHE II score§
Mean
23±9 23±10 0.50 24±9 24±10 0.95
>40 — no. (%)
18 (3.0) 26 (4.4) 0.19 11 (2.9) 18 (4.7) 0.19
Copyright © 2006 Massachusetts Medical Society. All rights reserved.
Downloaded from www.nejm.org on April 10, 2006 . This article is being provided free of charge for use in Viet Nam.
Intensive Insulin Therapy in the Medical ICU
n engl j med 354;5 www.nejm.org february 2, 2006
453
The baseline and outcome variables were com-
pared with the use of Student’s t-test, the chi-
square test, and the Mann–Whitney U test, as
appropriate. The effect of the intervention on time
to death in the hospital was assessed with the use
of Kaplan–Meier estimates and proportional-haz-
ards regression analysis. Patients discharged alive
from the hospital were considered survivors. The
hazard ratios for death, calculated by propor-
tional-hazards regression analysis, were corrected
for all well-known, clinically relevant baseline risk
factors. The effect on time to weaning from me-
chanical ventilation and time to discharge from
the ICU and from the hospital was assessed by
cumulative hazard estimates and proportional-
hazards regression analysis, with censoring for
early deaths.
The data are presented as means ±SD or me-
dians (with interquartile ranges), unless otherwise
indicated. Separate analyses were performed for
Table 1. (Continued.)
Variable Intention-to-Treat Group Group in ICU for ≥3 Days
Conventional
Treatment
(N = 605)
Intensive
Treatment
(N = 595)
P Value Conventional
Treatment
(N = 381)
Intensive
Treatment
(N = 386)
P Value†
Baseline TISS-28 score¶
Mean score
29±7 29±7 0.45 30±7 31±7 0.46
Score >33 — no. (%)
125 (20.6) 158 (26.6) 0.02 96 (25.2) 129 (33.4) 0.01
Blood glucose on admission
— mg/dl
162±70 162±71 0.98 164±68 163±67 0.87
Glycosylated hemoglobin on
admission — %∥
6.2±0.9 6.3±0.9 0.12 6.2±0.9 6.3±0.9 0.21
Plasma creatinine on admission
— mg/dl
Median
1.2 1.2 0.25 1.4 1.3 0.06
Interquartile range
0.9–2.1 0.8–2.1 0.9–2.4 0.8–2.1
Plasma urea on admission — mg/dl
Median
67 65 0.26 71 69 0.16
Interquartile range
40–110 36–104 45–115 37–106
Plasma ALT on admission — IU/liter
Median
29 30 0.50 33 31 0.55
Interquartile range
15–64 16–63 17–77 17–63
Plasma CRP on admission — mg/liter
Median
124 108 0.27 146 132 0.31
Interquartile range
39–226 36–218 55–236 48–229
* Plus–minus values are means ±SD. To convert values for glucose to millimoles per liter, multiply by 0.05551. To convert values for urea to
millimoles per liter, multiply by 0.357. ICU denotes intensive care unit, BMI body-mass index (the weight in kilograms divided by the square
of the height in meters), APACHE II Acute Physiology and Chronic Health Evaluation, TISS-28 Therapeutic Intervention Scoring System, ALT
alanine aminotransferase, and CRP C-reactive protein.
† P values for the comparison between the conventional-treatment group and the intensive-treatment group were calculated by Student’s
t-test, the Mann–Whitney U test, or the chi-square test, as appropriate.
‡ Established kidney failure on admission was defined as dependence on dialysis or a serum creatinine level >2.5 mg per deciliter. To convert
values for creatinine to micromoles per liter, multiply by 88.4.
§ Higher APACHE II scores indicate more severe illness, with a score greater than 40 representing the 90th percentile, indicating the most
severe illness.
¶ According to the TISS-28, each therapeutic intervention is assigned a number of points, with higher scores indicating a greater number of
therapeutic interventions. The sum of the points is calculated daily for each patient. A score greater than 33 is at the upper limit of the inter
quartile range.
∥ Glycosylated hemoglobin was measured by immunoturbidimetric assay (Dimension, Dade Behring) (normal range, 4 to 6 percent).
Copyright © 2006 Massachusetts Medical Society. All rights reserved.
Downloaded from www.nejm.org on April 10, 2006 . This article is being provided free of charge for use in Viet Nam.
The new england journal of medicine
n engl j med 354;5 www.nejm.org february 2, 2006
454
the intention-to-treat group and for the group stay-
ing in the ICU for three or more days. For com-
parison with the results of our previous study in
the surgical ICU,
5
the effects on patients in the
ICU for at least a fifth day were also documented.
P values were not adjusted for multiple compari-
sons. The study sponsors were not involved in the
design of the study, the collection, analysis, or in-
terpretation of the data, or the preparation of the
manuscript.
Results
Nutrition and Blood Glucose Control
Table 1 gives the baseline characteristics on ad-
mission of all 1200 patients enrolled in the study,
including the 767 patients who stayed in the ICU
for at least a third day. Nutritional intake and blood
glucose levels are shown in Figure 2 (for insulin
doses, see Table A in the Supplementary Appen-
dix, available with the full text of this article at
www.nejm.org). Hypoglycemia occurred more of-
ten in the intensive-treatment group than the con-
ventional-treatment group. Most patients who had
hypoglycemia had only one episode. The severity
of hypoglycemia was similar in the two groups
(Table A in the Supplementary Appendix). No he-
modynamic deterioration, convulsions, or other
events were noted in association with any hypo-
glycemic event. Mortality among patients in the
ICU who had hypoglycemia was 66.7 percent in
the conventional-treatment group, as compared
with 46.4 percent in the intensive-treatment group
Total Intake of Nonprotein Calories
(kcal/24 hr)
1600
1200
800
400
0
2000
0 1 2 3 4 5 6 7 8 9
1410 11 12 13
Fraction of Kilocalories Administered
by Enteral Route
0.8
0.6
0.4
0.2
0.0
Day
Day
1.0
0 1 2 3 4 5 6 7 8 9
1410 11 12 13
180
Blood Glucose (mg/dl)
140
160
120
100
60
40
80
20
0
Admis-
sion
1 2 3 4 5 6 7 8 9
10
Day
No. of Patients
Conventional-
treatment group
Intensive-treat-
ment group
174
157
188
175
208
197
226
217
251
251
286
290
323
335
381
386
450
455
538
536
605
595
P<0.001
Conventional-treatment group Intensive-treatment group
A
C
B
Figure 2. Nutrition Administered to All 1200 Patients
during the First 14 Days of Intensive Care and Daily
Morning Blood Glucose Levels during the First 10 Days
of Intensive Care.
In Panel A, feeding at 0 represents the administration
of nutrition to patients admitted to the intensive care
unit (ICU) after midnight between admission and 7 a.m.,
and 1 represents feeding on the first day after admis-
sion, from 7 a.m. on. Nutrition in the two groups was
similar. Total kilocalories are given as means ±SE. In
Panel B, in the box plot the fraction of nutrition admin-
istered by the enteral route is expressed as medians
(indicated by horizontal lines within the bars) and in-
terquartile ranges (with the 90th percentile indicated
by the I bar). In Panel C, among patients staying in the
ICU for three or more days, intensive insulin treatment
was continued until discharge from the ICU (mean,
12.5 days, with a range up to 65 days). P<0.001 for the
comparison between the two groups. To convert val-
ues for glucose to millimoles per liter, multiply by
0.05551.
Copyright © 2006 Massachusetts Medical Society. All rights reserved.
Downloaded from www.nejm.org on April 10, 2006 . This article is being provided free of charge for use in Viet Nam.
Intensive Insulin Therapy in the Medical ICU
n engl j med 354;5 www.nejm.org february 2, 2006
455
(P = 0.1); the in-hospital mortality was 73.3 per-
cent and 61.9 percent, respectively (P = 0.4). Two
patients in the conventional-treatment group and
three in the intensive-treatment group died with-
in 24 hours after having a hypoglycemic event.
Independent risk factors for hypoglycemia, aside
from intensive insulin therapy (odds ratio, 7.50;
95 percent confidence interval, 4.50 to 12.50;
P<0.001), were a stay in the ICU for three or more
days (odds ratio, 3.33; 95 percent confidence in-
terval, 1.95 to 5.70; P<0.001), renal failure requir-
ing dialysis (odds ratio, 1.94; 95 percent confi-
dence interval, 1.19 to 2.84; P = 0.006), and liver
failure as defined by alanine aminotransferase lev-
els above 250 U per liter (odds ratio, 1.62; 95 per-
cent confidence interval, 1.01 to 2.60; P = 0.04).
Morbidity
Intention-to-Treat Population
In the intention-to-treat population, there was no
significant difference between the two treatment
groups in the use of medications other than in-
sulin. Of 1200 patients in the intention-to-treat
population, 9 were treated for septic shock with
activated protein C, 5 in the conventional-treat-
ment group and 4 in the intensive-treatment
group (P = 0.8). Of 644 patients receiving cortico-
steroid therapy, 327 were in the conventional-
treatment group and 317 were in the intensive-
treatment group (P = 0.8). The corticosteroid therapy
consisted largely of immunosuppressive or anti-
inflammatory treatment with methylprednisolone
(at a median dose of 40 mg [interquartile range,
24 to 75] per treatment day among 233 patients in
the conventional-treatment group and a median
dose of 40 mg [interquartile range, 29 to 65] per
day among 249 patients in the intensive-treatment
group; P>0.9). Hydrocortisone was given for pre-
sumed adrenal failure at a median dose of 125 mg
(interquartile range, 100 to 193) per day to 129
patients in the conventional-treatment group and
at a median dose of 135 mg (interquartile range,
100 to 240) per day to 118 patients in the inten-
sive-treatment group (P = 0.2). Five patients, two
in the conventional-treatment group and three in
the intensive-treatment group, received a median
daily dose of 10 mg of dexamethasone (P>0.9).
Morbidity was reduced in the intensive-treat-
ment group, as reflected by a reduction in newly
acquired kidney injury (8.9 to 5.9 percent, P = 0.04)
and in earlier weaning from mechanical ventila-
tion, as compared with the conventional-treat-
ment group (hazard ratio, 1.21; 95 percent con-
fidence interval, 1.02 to 1.44; P = 0.03), along with
earlier discharge from the ICU (hazard ratio,
1.15; 95 percent confidence interval, 1.01 to 1.32;
P = 0.04) and from the hospital (hazard ratio,
1.16; 95 percent confidence interval, 1.00 to 1.35;
P = 0.05) (Fig. 3). There was no significant effect
on bacteremia (reduction, 7 to 8 percent; P = 0.5),
prolonged requirement of antibiotic agents (re-
duction, 24 to 21 percent; P = 0.2), hyperbilirubi-
nemia (reduction, 27 to 25 percent; P = 0.4), hyper-
inflammation (reduction, 61 to 56 percent; P = 0.1),
or cumulative TISS-28 scores (reduction, 308±16
to 272±13; P = 0.08). Rates of readmission to the
ICU were similar (6.3 percent) in the two groups.
Stays in ICU Longer Than Three Days
Among the 767 patients who stayed for more than
three days in the ICU, there was no significant
difference between the two groups in the use of
any medications other than insulin. Among the
386 patients in the intensive-treatment group, in-
tensive insulin therapy for at least a third day, as
compared with conventional therapy, accelerated
weaning from mechanical ventilation (hazard ra-
tio, 1.43; 95 percent confidence interval, 1.16 to
1.75; P<0.001), discharge from the ICU (hazard
ratio, 1.34; 95 percent confidence interval, 1.12
to 1.61; P = 0.002), and discharge from the hospi-
tal (hazard ratio, 1.58; 95 percent confidence in-
terval, 1.28 to 1.95; P<0.001) (Fig. 3).
In the conventional-treatment group, 28.6 per-
cent of patients received dialysis therapy, as com-
pared with 27.2 percent of those in the intensive-
treatment group (P = 0.7). The use of dialysis in
patients who did not require dialysis before ad-
mission to the ICU was not significantly reduced
(22.7 percent in the conventional-treatment group
and 20.8 percent in the intensive-treatment group,
P = 0.5). However, acquired kidney injury occur-
ring after randomization, as defined by a serum
creatinine level at least twice that present on ad-
mission to the ICU (12.6 percent in the conven-
tional-treatment group and 8.3 percent in the in-
tensive-treatment group, P = 0.05) and the fraction
of patients reaching a peak serum creatinine level
greater than 2.5 mg per deciliter (39.4 and 32.5
percent, respectively; P = 0.04), was reduced. Hyper-
bilirubinemia was present in 55.2 percent of pa-
tients in the conventional-treatment group and
47.3 percent of those in the intensive-treatment
group (P = 0.04). The levels of alanine aminotrans-
ferase or aspartate aminotransferase were similar
in the two groups.
Copyright © 2006 Massachusetts Medical Society. All rights reserved.
Downloaded from www.nejm.org on April 10, 2006 . This article is being provided free of charge for use in Viet Nam.
The new england journal of medicine
n engl j med 354;5 www.nejm.org february 2, 2006
456
The proportion of patients who had bacteremia
(11.3 percent) or secondary bacteremia (7.3 per-
cent) or received prolonged antibiotic therapy (37.6
percent in the conventional-treatment group and
31.9 percent in the intensive-treatment group,
P = 0.09) was not significantly reduced. However,
intensive insulin therapy reduced the incidence of
hyperinflammation from 74 percent in the conven-
tional-treatment group to 67 percent in the inten-
sive-treatment group (P = 0.03).
Intensive insulin therapy reduced the cumula-
tive TISS-28 scores among patients in the ICU by
20 percent (454±22 in the conventional-treatment
group vs. 388±17 in the intensive-treatment group,
P = 0.02), reflecting a reduction in the costs of in-
tensive care.
19,20
Among patients who underwent
randomization and stayed in the ICU less than
three days, none of the morbidity end points
were significantly different in the two treatment
groups. Beyond the fifth day of intensive insulin
therapy, all the morbidity end points studied were
also beneficially affected, with no effect among
those treated for less than five days.
Mortality
Among the 1200 patients included in the inten-
tion-to-treat analysis, ICU and in-hospital mor-
tality were not significantly reduced by intensive
insulin therapy (
Table 2
and
Fig. 4
). For all patients,
mortality in the ICU at day 3 (2.8 percent vs. 3.9
percent, P = 0.31) and in-hospital mortality at day
3 (3.6 percent vs. 4.0 percent, P = 0.72) were not sig-
nificantly different in the two treatment groups.
Beyond the third day of intensive insulin therapy,
the in-hospital mortality was reduced from 52.5
to 43.0 percent (
Fig. 4
and
Table 2
). Death from
all causes in the ICU appeared to be reduced. The
effect on mortality among patients staying for
more than three days in the ICU was shown in
most of the subgroups stratified according to di-
agnostic category, but it was much less pronounced
Intensive
treatment
Intensive
treatment
Conventional
treatment
Conventional
treatment
Cumulative Hazard
3.0
3.5
2.5
2.0
1.0
0.5
1.5
0.0
0 10 20 30 40 50 60 70 80 90
4.0
P=0.03
Days after Admission to ICU
3.0
3.5
2.5
2.0
1.0
0.5
1.5
0.0
4.5
4.0
P=0.04
0 20 40 60 80 100 0 100 200 300 400 500 600
3.0
4.0
2.0
1.0
0.0
5.0
Cumulative Hazard
3.0
3.5
2.5
2.0
1.0
0.5
1.5
0.0
0 10 20 30 40 50 60 70 80 90
Days after Admission to ICU
3.0
3.5
2.5
2.0
1.0
0.5
1.5
0.0
4.0
0 20 40 60 80 100 0 100 200 300 400 500 600
3.0
4.0
2.0
1.0
0.0
5.0
P=0.05
P<0.001 P=0.002 P<0.001
A
B
Weaning from Mechanical
Ventilation
Discharge from ICU Discharge from Hospital
Weaning from Mechanical
Ventilation
Discharge from ICU Discharge from Hospital
Figure 3. Effect of Intensive Insulin Therapy on Morbidity.
The effect of intensive insulin therapy on time to weaning from mechanical ventilation, time to discharge from the intensive care unit
(ICU), and time to discharge from the hospital is shown for all patients (intention-to-treat analysis, Panel A) and for the subgroup of 767
patients staying in the ICU for three or more days (Panel B). P values for the comparison between the two groups were calculated by
proportional-hazards regression analysis with censoring for early deaths. Circles represent patients.
Copyright © 2006 Massachusetts Medical Society. All rights reserved.
Downloaded from www.nejm.org on April 10, 2006 . This article is being provided free of charge for use in Viet Nam.
Intensive Insulin Therapy in the Medical ICU
n engl j med 354;5 www.nejm.org february 2, 2006
457
Table 2. Mortality in the Study Groups.*
Variable Intention-to-Treat Group Group in ICU for ≥3 Days
Conventional
Treatment
(N = 605)
Intensive
Treatment
(N = 595)
P Value Conventional
Treatment
(N = 381)
Intensive
Treatment
(N = 386)
P Value
Total deaths during intensive care
— no. (%)
162 (26.8) 144 (24.2) 0.31 145 (38.1) 121 (31.3) 0.05
Causes of death during intensive care —
no. (% of patients in the category)
0.90 0.70
Persistent MOF after septic or
SIRS-induced shock
59 (51.3) 56 (48.7) 55 (51.4) 52 (48.6)
Respiratory failure 50 (54.3) 42 (45.7) 49 (55.7) 39 (44.3)
Therapy-resistant septic shock 21 (50.0) 21 (50.0) 14 (53.8) 12 (46.2)
Cardiovascular collapse 18 (54.5) 15 (45.5) 16 (66.7) 8 (33.3)
Severe brain damage 14 (58.3) 10 (41.7) 11 (52.4) 10 (47.6)
In-hospital deaths — no. (%) 242 (40.0) 222 (37.3) 0.33 200 (52.5) 166 (43.0) 0.009
Hazard ratio (95% CI) 0.94 (0.84–1.06) 0.31 0.84 (0.73–0.97) 0.02†
In-hospital deaths, according to diag-
nostic category — no. (% of
patients in the category)
Respiratory 115 (44.1) 98 (39.0) 100 (58.1) 78 (41.7)
Gastrointestinal or liver disease 49 (32.2) 41 (45.6) 39 (43.8) 23 (32.4)
Hematologic or oncologic disease 33 (64.7) 28 (60.9) 26 (70.3) 23 (58.9)
Other sepsis 13 (28.9) 19 (42.2) 11 (36.7) 16 (47.0)
Cardiovascular 8 (33.3) 14 (53.8) 6 (40.0) 11 (61.1)
Neurologic 9 (29.0) 9 (30.0) 6 (42.8) 5 (35.7)
Renal 8 (40.0) 6 (25.0) 7 (63.6) 4 (30.8)
Metabolic 4 (36.4) 2 (22.2) 4 (40.0) 2 (40.0)
Other 3 (30.0) 5 (50.0) 1 (33.3) 4 (80.0)
In-hospital deaths, according to
APACHE II quartile — no.
(% of patients in the category)
<17 25 (19.5) 28 (19.7) 25 (34.7) 20 (24.1)
17 to 22 63 (37.1) 54 (32.1) 51 (51.5) 38 (38.8)
23 to 29 74 (44.6) 66 (44.0) 63 (55.8) 51 (47.7)
>29 79 (58.1) 73 (55.3) 61 (62.9) 57 (58.2)
In-hospital deaths, according to history
of diabetes — no. (% of pa-
tients in the category)
No history of diabetes 208 (40.9) 180 (36.8) 173 (53.4) 137 (41.9)
History of diabetes 34 (35.0) 42 (39.6) 27 (47.4) 29 (49.2)
28-Day mortality — no. (%) 182 (30.0) 178 (29.9) 0.95 149 (39.1) 133 (34.5) 0.18
90-Day mortality — no. (%) 228 (37.7) 214 (35.9) 0.53 187 (49.1) 163 (42.2) 0.06
Deaths in ICU on day 3 — no. (%) 17 (2.8) 23 (3.9) 0.31
Deaths in hospital on day 3 — no. (%) 22 (3.6) 24 (4.0) 0.72
* ICU denotes intensive care unit, MOF multiple organ failure, SIRS systemic inflammatory response syndrome, and CI confidence interval.
P values were calculated by the chi-square test, uncorrected for the crude mortality data and corrected for baseline risk factors for the odds
ratios for in-hospital death obtained by proportional-hazards regression analysis. Clinically relevant baseline risk factors for death included
severity of illness scores (APACHE II and Therapeutic Intervention Scoring System-28 scores), a history of diabetes, active cancer and kidney
failure before admission to the ICU, dialysis dependence, signs of liver necrosis (alanine aminotransferase level, >150 IU per liter), baseline
plasma urea level >150 mg per deciliter, and hyperinflammation (C-reactive protein level, >150 mg per deciliter).
† The P value has been corrected for the risk factors.
Copyright © 2006 Massachusetts Medical Society. All rights reserved.
Downloaded from www.nejm.org on April 10, 2006 . This article is being provided free of charge for use in Viet Nam.
The new england journal of medicine
n engl j med 354;5 www.nejm.org february 2, 2006
458
in the highest APACHE II quartile (
Table 2
). Among
the 433 patients who stayed in the ICU less than
three days and for whom data were censored af-
ter randomization, 56 of those in the intensive-
treatment group and 42 in the conventional-treat-
ment group died, but the statistical significance
of this finding varied depending on the analyti-
cal approach (P = 0.05 with the chi-square test;
hazard ratio, 1.09; 95 percent confidence interval,
0.90 to 1.32; P = 0.35 by uncorrected proportional-
hazards analysis; hazard ratio, 1.09; 95 percent
confidence interval, 0.89 to 1.32; P = 0.41 after cor-
recting for baseline risk factors listed in
Table 2
).
Beyond the fifth day of intensive insulin ther-
apy, mortality was reduced from 54.9 to 45.9 per-
cent (P = 0.03), with no significant effect among
patients staying less than five days in the ICU
(P = 0.50).
Post Hoc Exploratory Mortality Analysis
Of the 1200 patients in the total study group, a
post hoc analysis censored data on 65 patients for
whom intensive care had been limited or with-
drawn within 72 hours after admission to the ICU
(26 patients in the conventional-treatment group
and 39 in the intensive-treatment group). Of these
65 patients, 29 had long stays in the ICU (16 in
the conventional-treatment group and 13 in the in-
tensive-treatment group), and 36 had short stays
(10 and 26, respectively). After censoring, the
in-hospital mortality in the intention-to-treat pop-
ulation was 37.8 percent in the conventional-treat-
ment group versus 33.5 percent in the intensive-
treatment group (P = 0.1); among those with long
stays in the ICU, the in-hospital mortality was 50.9
percent versus 41.5 percent (P = 0.01); and among
those with short stays, it was 15.4 percent versus
16.9 percent (P = 0.7).
Discussion
Intensive insulin therapy during intensive care
prevented morbidity but did not significantly re-
duce the risk of death among all patients in the
In-Hospital Survival (%)
80
60
40
20
0
0 50 100 150 200 250 300 350 500
Days
Intensive treatment
Conventional treatment
100
A Intention-to-Treat Group (N=1200) B
Subgroup in ICU ≥3 Days (N=767)
100
80
60
40
0
0 10 20 30
In-Hospital Survival (%)
80
60
40
20
0
0 100 200 300 400 500
Days
Intensive treatment
Conventional treatment
100
100
80
60
40
0
0 10 20 30
First 30 days First 30 days
Figure 4. Kaplan–Meier Curves for In-Hospital Survival.
The effect of intensive insulin treatment on the time from admission to the intensive care unit (ICU) until death is
shown for the intention-to-treat group (Panel A) and the subgroup of patients staying in the ICU for three or more
days (Panel B). Patients discharged alive from the hospital were considered survivors. P values calculated by the
log-rank test were 0.40 for the intention-to-treat group and 0.02 for the subgroup staying in the ICU for three or
more days. P values calculated by proportional-hazards regression analysis were 0.30 and 0.02, respectively.
Copyright © 2006 Massachusetts Medical Society. All rights reserved.
Downloaded from www.nejm.org on April 10, 2006 . This article is being provided free of charge for use in Viet Nam.
Intensive Insulin Therapy in the Medical ICU
n engl j med 354;5 www.nejm.org february 2, 2006
459
medical ICU included in the intention-to-treat
population. However, among those who stayed
in the ICU for three or more days, intensive insu-
lin therapy reduced morbidity and mortality.
The reduced morbidity resulted from the pre-
vention of acquired kidney injury, earlier weaning
from mechanical ventilation, and earlier discharge
from the medical ICU and the hospital in patients
who received intensive insulin therapy as com-
pared with those who did not. In contrast to pa-
tients in the surgical ICU,
5
however, those in the
medical ICU had no detectable reduction in bac-
teremia, which may be explained by the fact that
among medical patients sepsis often triggers ad-
mission to the ICU, irrespective of the disease ne-
cessitating hospital admission. Although infec-
tions other than bacteremia were not analyzed for
our study and may have been missed, the anti-
inflammatory effect
8
and the protection of organ
function
9
appeared to be independent of preven-
tion of infection. Possible mechanisms of action
include the prevention of cellular hypoxia by means
of reduced endothelial damage
10
and the preven-
tion of cytopathic hypoxia.
11
Analysis of the subgroup treated in the ICU
for three or more days showed not only a benefi-
cial effect on morbidity but also a reduction in
mortality that was absent in the total study popu-
lation. However, since the length of stay in the ICU
cannot be predicted for an individual patient and
therefore the analysis based on length of stay in-
evitably requires post-randomization stratifica-
tion, there is a risk of bias. It is unclear whether
intensive insulin therapy received for less than
three days caused harm, as might be inferred from
the greater number of deaths among patients
staying less than three days in the ICU. Post hoc
exploratory analysis, with its inherent limitations,
suggested that this apparent difference in mor-
tality among those staying a shorter time in the
ICU could be explained by the higher number of
patients in the intensive-treatment group for whom
intensive care was limited or withdrawn for rea-
sons of futility within 72 hours after admission.
In our previous study, brief exposure to insulin
therapy had no significant effect on the risk of
death.
5
Why 48 hours or less of insulin therapy
would cause harm, whereas sustained treatment
would be beneficial, is unclear.
An alternative and more likely explanation for
the difference in the effect of intensive insulin
therapy in the intention-to-treat population, as
compared with patients staying in the ICU for at
least three days, is that the benefit from inten-
sive insulin therapy requires time to be realized.
Indeed, the intervention is aimed not at curing
disease but at preventing complications that occur
during and, perhaps in part as a result of, inten-
sive care. Prevention probably does not occur when
the patient has a high risk of death from the dis-
ease causing admission to the ICU and when the
intervention is administered for a relatively short
time. However, among patients in whom compli-
cations resulting from intensive care contribute
to an adverse outcome, such a preventive strategy,
if continued long enough, is likely to be effective.
This would explain why patients with long stays in
the medical ICU benefit more than those with
short stays, as shown in a surgical ICU.
5
Among patients staying for at least three days
in the ICU, the absolute reduction in in-hospital
mortality associated with intensive insulin ther-
apy was similar to that in our previous report
5
and exceeded the effect on mortality in the ICU,
indicating that intensive insulin therapy during
intensive care had a carryover effect. Such a lon-
ger-term effect is in line with our previous find-
ing of superior long-term rehabilitation among
patients with brain injury who received intensive
insulin therapy during intensive care.
24
Mortality
in a subgroup with a diagnosis of diabetes ap-
peared to be unaffected by intensive insulin ther-
apy, although the numbers were small. This find-
ing may be explained in part by the fact that the
target blood glucose level was not reached in this
subgroup. Indeed, achieving normoglycemia ap-
pears crucial to obtaining the benefit of intensive
insulin therapy.
6
In the present study, normoglycemia was
achieved with insulin titrated by the attending
nurses in the ICU. Despite the use of guidelines
similar to those used in the surgical study,
5
an epi-
sode of biochemical hypoglycemia occurred more
often among the patients in the medical ICU. Liver
failure and kidney failure, which increase the vul-
nerability to hypoglycemia, may partly explain this
observation. However, logistic-regression analysis
identified hypoglycemia as an independent risk
factor for death. Hence, it is possible that hypogly-
cemia induced by intensive insulin therapy may
have reduced a portion of the potential benefit.
This study has certain limitations. Like our
previous study of the surgical ICU,
5
this was a
single-center study; and as in previous studies in
Copyright © 2006 Massachusetts Medical Society. All rights reserved.
Downloaded from www.nejm.org on April 10, 2006 . This article is being provided free of charge for use in Viet Nam.
The new england journal of medicine
n engl j med 354;5 www.nejm.org february 2, 2006
460
patients with diabetes mellitus,
25,26
it was not pos-
sible to achieve strict blinding, because safe insu-
lin titration requires monitoring of blood glucose
levels. However, because physicians on the gen-
eral wards were unaware of the treatment as-
signments of patients receiving intensive care and
had no access to the results of blood glucose test-
ing, bias in the analysis of the effect on length
of stay in the hospital and in the analysis of in-
hospital mortality was prevented. Furthermore,
since there was no survival benefit in the inten-
tion-to-treat group, as compared with the sub-
group staying in the ICU for three or more days,
the use of intensive insulin therapy in all patients
in the medical ICU, including those staying less
than three days, could be questioned. Because pa-
tients who will have a prolonged stay in the ICU
cannot be identified with certainty on admission,
adequately powered trials are needed to address
this important issue. On the basis of our current
data, such studies would require at least 5000 pa-
tients in the medical ICU.
Thus, targeting blood glucose levels to below
110 mg per deciliter with insulin therapy prevented
morbidity but did not significantly reduce mor-
tality among all patients in our medical ICU. How-
ever, intensive insulin therapy in patients who
stayed in the ICU for at least three days was as-
sociated with reduced morbidity and mortality.
Large multicenter trials are needed to confirm
these preliminary results.
Supported by grants from the Belgian Fund for Scientific Re-
search (G.0278.03 and G.3C05.95N), the Research Council of the
University of Leuven (OT/03/56), and the Belgian Foundation for
Research in Congenital Heart Diseases (to Dr. Van den Berghe).
Dr. Van den Berghe reports having received an unrestricted
research grant from Novo Nordisk; and Dr. Bouillon, an unre-
stricted research grant from Servier. No other potential conflict
of interest relevant to this article was reported.
We are indebted to Mona Eerdekens, M.Sc., and Peggy Claes,
R.N., for assistance with blood samples and data collection; to
the clinical fellows in the ICU for APACHE II scoring; to the
nurses for daily TISS-28 scoring and for excellent compliance
with the protocol; to Prof. Emmanuel Lesaffre for inspiring dis-
cussions of the statistical analysis; and to HemoCue, Ängel-
holm, Sweden, for generously providing the equipment and re-
agents for point-of-care blood glucose measurements.
References
Mizock BA. Alterations in carbohy-
drate metabolism during stress: a review of
the literature. Am J Med 1995;98:75-84.
McCowen KC, Malhotra A, Bistrian BR.
Stress-induced hyperglycemia. Crit Care
Clin 2001;17:107-24.
Capes SE, Hunt D, Malmberg K, Ger-
stein HC. Stress hyperglycaemia and in-
creased risk of death after myocardial in-
farction in patients with and without
diabetes: a systematic overview. Lancet
2000;355:773-8.
Cely CM, Arora P, Quartin AA, Kett
DH, Schein RMH. Relationship of base-
line glucose homeostasis to hyperglyce-
mia during medical critical illness. Chest
2004;126:879-87.
Van den Berghe G, Wouters P, Week-
ers F, et al. Intensive insulin therapy in
critically ill patients. N Engl J Med 2001;
345:1359-67.
Van den Berghe G, Wouters PJ, Bouil-
lon R, et al. Outcome benefit of intensive
insulin therapy in the critically ill: insulin
dose versus glycemic control. Crit Care
Med 2003;31:359-66.
Weekers F, Giulietti A-P, Michalaki M,
et al. Metabolic, endocrine, and immune
effects of stress hyperglycemia in a rabbit
model of prolonged critical illness. Endo-
crinology 2003;144:5329-38.
Hansen TK, Thiel S, Wouters PJ,
Christiansen JS, Van den Berghe G. Inten-
sive insulin therapy exerts anti-inflam-
matory effects in crit ically ill patients and
counteracts the adverse effect of low man-
1.
2.
3.
4.
5.
6.
7.
8.
nose-binding lectin levels. J Clin Endocri-
nol Metab 2003;88:1082-8.
Van den Berghe G. How does blood
glucose control with insulin save lives in
intensive care? J C l i n I nve s t 20 0 4;114 :1 187-
95.
Langouche L, Vanhorebeek I, Vlasse-
laers D, et al. Intensive insulin therapy
protects the endothelium of critically ill
patients. J Clin Invest 2005;115:2277-86.
Vanhorebeek I, De Vos R, Mesotten
M, Wouters PJ, De Wolf-Peeters C, Van
den Berghe G. Protection of hepatocyte
mitochondrial ultrastructure and function
by strict blood glucose control with insu-
lin in critically ill patients. Lancet 2005;
365:53-9.
Evans TW. Hemodynamic and meta-
bolic therapy in critically ill patients.
N Engl J Med 2001;345:1417-8.
Clement S, Braithwaite SS, Magee MF,
et al. Management of diabetes and hyper-
glycemia in hospitals. Diabetes Care 2004;
27:553-91. [Errat a, Diabetes Ca re 2004;27:
856, 2004;27:1255.]
Malmberg K, Ryden L, Efendic S, et
al. Randomized trial of insulin-glucose
infusion followed by subcutaneous insulin
treatment in diabetic patients with acute
myocardial infarction (DIGAMI study): ef-
fects on mortality at 1 year. J Am Coll Car-
diol 1995;26:57-65.
Malmberg K, Ryden L, Wedel H, et al.
Intense metabolic control by means of in-
sulin in patients with diabetes mellitus
and acute myocardial infarction (DIGAMI
9.
10.
11.
12.
13.
14.
15.
2): effects on mortality and morbidity.
Eur Heart J 2005;26:650-61.
Furnary AP, Gao G, Grunkemeier GL,
et al. Continuous insulin infusion reduces
mortality in patients with diabetes under-
going coronary artery bypass grafting.
J Thorac Cardiovasc Surg 2003;125:1007-21.
Souba WW. Nutritional support.
N Engl J Med 1997;336:41-8.
Knaus WA, Draper EA, Wagner DP,
Zimmerman JE. APACHE II: a severity of
disease classification system. Crit Care
Med 1985;13:818-29.
Miranda DR, de Rijk A, Schaufeli W.
Simplified Therapeutic Intervention Scor-
ing System: the TISS-28 items — results
from a multicenter study. Crit Care Med
1996;24:64-73.
Keene AR, Cullen DJ. Therapeutic In-
tervention Scoring System: update 1983.
Crit Care Med 1983;11:1-3.
Weinstein MP, Towns ML, Quartey
SM, et al. The clinical significance of posi-
tive blood cultures in the 1990s: a pro-
spective comprehensive evaluation of the
microbiology, epidemiology, and outcome
of bacteremia and fungemia in adults. Clin
Infect Dis 1997;24:584-602.
Weinstein MP, Mirrett S, Van Pelt L, et
al. Clinical importance of identifying co-
agulase-negative staphylococci isolated
from blood cultures: evaluation of MicroScan
Rapid and Dried Overnight Gram-Positive
panels versus a conventional reference
method. J Clin Microbiol 1998;36:2089-92.
Bellomo R, Ronco C, Kellum JA, et al.
16.
17.
18.
19.
20.
21.
22.
23.
Copyright © 2006 Massachusetts Medical Society. All rights reserved.
Downloaded from www.nejm.org on April 10, 2006 . This article is being provided free of charge for use in Viet Nam.
Intensive Insulin Therapy in the Medical ICU
n engl j med 354;5 www.nejm.org february 2, 2006
461
Acute renal failure: definition, outcome
measures, animal models, fluid therapy
and information technology needs: the
Second International Consensus Confer-
ence of the Acute Dialysis Quality Initia-
tive (ADQI) Group. Crit Care 2004;8:
R204–R212.
Van den Berghe G, Schoonheydt K,
Becx P, Bruyninckx F, Wouters PJ. Insulin
24.
therapy protects the central and peripheral
nervous system of intensive care patients.
Neurology 2005;64:1348-53.
Diabetes Control and Complications
Trial Research Group. The effect of inten-
sive treatment of diabetes on the develop-
ment and progression of long-term com-
plications in insulin-dependent diabetes
mellitus. N Engl J Med 1993;329:977-86.
25.
UK Prospective Diabetes Study Group.
Intensive blood-glucose control with sul-
phonylureas or insulin compared with
conventional treatment and risk of com-
plications in pat ients with type 2 diabetes
(UKPDS 33). Lancet 1998;352:837-53. [Er-
ratum, Lancet 1999;354:602.]
Copyright © 2006 Massachusetts Medical Society.
26.
Copyright © 2006 Massachusetts Medical Society. All rights reserved.
Downloaded from www.nejm.org on April 10, 2006 . This article is being provided free of charge for use in Viet Nam.