O’Reilly Mastering Perl 2007 phần 3 pot
Bạn đang xem bản rút gọn của tài liệu. Xem và tải ngay bản đầy đủ của tài liệu tại đây (559.59 KB, 32 trang )
BEGIN {
use Carp::Heavy;
no warnings 'redefine';
*Carp::format_arg = sub {
package Carp;
my $arg = shift;
if( not defined $arg )
{ $arg = 'undef' }
elsif( ref $arg )
{
use Data::Dumper;
local $Data::Dumper::Indent = 0; # salt to taste
local $Data::Dumper::Terse = 0;
$arg = Dumper( $arg );
$arg =~ s/^\$VAR\d+\s*=\s*//;
$arg =~ s/;\s*$//;
}
else
{
$arg =~ s/'/\\'/g;
$arg = str_len_trim($arg, $MaxArgLen);
$arg = "'$arg'" unless $arg =~ /^-?[\d.]+\z/;
}
$arg =~ s/([[:cntrl:]]|[[:^ascii:]])/sprintf("\\x{%x}",ord($1))/eg;
return $arg;
};
}
I do a little bit of extra work on the Dumper output. It normally gives me something I
can use in eval, so it’s a Perl expression with an assignment to a scalar and a trailing
semicolon. I use a couple of substitutions to get rid of these extras. I want to get rid of
the Data::Dumper artifacts on the ends:
$VAR = ; # leave just the
Now, when I run the same program I had earlier, I get better output. I can see in elements
of the anonymous array that I passed to multiply_and_divide:
at confess.pl line 65
main::divide(4, 4) called at confess.pl line 57
main::multiply_and_divide([4,5]) called at confess.pl line 46
main::do_it(4, 5) called at confess.pl line 38
9 20 1
The best part of all of this, of course, is that I only had to add cluck in one subroutine
to get all of this information. I’ve used this for very complex situations with lots of
arguments and complex data structures, giving me a Perl-style stack dump. It may be
tricky to go through, but it’s almost painless to get (and to disable, too).
The Best Debugger in the World | 55
Safely Changing Modules
In the previous section I changed &Carp::format_arg to do something different. The
general idea is very useful for debugging since I’m not only going to find bugs in the
code that I write, but most often in the modules I use or in code that someone else
wrote.
When I need to debug these things in other files, I want to add some debugging state-
ments or change the code somehow to see what happens. However, I don’t want to
change the original source files; whenever I do that I tend to make things worse no
matter how careful I am to restore them to their original state. Whatever I do, I want
to erase any damage I do and I don’t want it to affect anyone else.
I do something simple: copy the questionable module file to a new location. I set up a
special directory for the debugging section just to ensure that my mangled versions of
the modules won’t infect anything else. Once I do that, I set the
PERL5LIB environ-
ment variable so Perl finds my mangled version first. When I’m done debugging, I can
clear PERL5LIB to use the original versions again.
For instance, I recently needed to check the inner workings of
Net::SMTP because I didn’t
think it was handling the socket code correctly. I choose a directory to hold my copies,
in this case ~/my_debug_lib, and set PERL5LIB to that path. I then create the directories
I need to store the modified versions, then copy the module into it:
$ export PERL5LIB=~/my_debug_lib
$ mkdir -p ~/my_debug_lib/Net/
$ cp `perldoc -l Net::SMTP` ~/my_debug_lib/Net/.
Now, I can edit ~/my_debug_lib/Net/SMTP.pm, run my code to see what happens, and
work toward a solution. None of this has affected anyone else. I can do all the things
I’ve already showed in this chapter, including inserting
confess statements at the right
places to get a quick dump of the call stack. Every time I wanted to investigate a new
module, I copied it into my temporary debugging library directory.
Wrapping Subroutines
I don’t have to copy a module file to change its behavior. I can override parts of it
directly in my code. Damian Conway wrote a wonderful module called Hook::Lex
Wrap
to wrap a subroutine around another subroutine. That means that my wrapper
subroutine can see the arguments coming in and the return values going out. I can
inspect the values, or even change them if I like.
I’ll start with my simple example program that adds a couple of numbers. As before, it
has some problems because I’m passing it the wrong arguments since I can’t tell the
difference between
$n and $m, and have used $n twice in my call to add. Just running
the program gives me the wrong answer, but I don’t know where the problem is:
#!/usr/bin/perl
56 | Chapter 4: Debugging Perl
# @ARGV = qw( 5 6 );
my $n = shift @ARGV;
my $m = $ARGV[0];
print "The sum of $n and $m is " . add( $n, $n ) . "\n";
sub add
{
my( $n, $m ) = @_;
my $sum = $n + $m;
return $sum;
}
I don’t want to change anything in the code, or, I should say, I want to look at what’s
happening without affecting the statements that are already there. As before, I want
everything back to normal when I’m finished debugging. Not editing the subroutine
makes that easier.
The
Hook::LexWrap gives me a chance to do something right after I make a subroutine
call and right before the subroutine returns. As the name suggests, it wraps the sub-
routine with another one to provide the magic. The Hook::LexWrap::wrap function takes
the name of the subroutine it will wrap, add in this case, and then anonymous subrou-
tines as pre- and posthandlers:
#!/usr/bin/perl
use Hook::LexWrap qw(wrap);
my $n = shift @ARGV;
my $m = $ARGV[0];
wrap add,
pre => sub { print "I got the arguments: [@_]\n" },
post => sub { print "The return value is going to be $_[-1]\n" }
;
# this line has the error
print "The sum of $n and $m is " . add( $n, $n ) . "\n";
sub add
{
my( $n, $m ) = @_;
my $sum = $n + $m;
return $sum;
}
The prehandler sees the same argument list as my call to add. In this case I just output
the list so I can see what it is. The posthandler gets the same arguments, but Hook::Lex
Wrap
adds another element, the return value, on the end of @_. In the posthandler,
The Best Debugger in the World | 57
$_[-1] is always the return value. My program now outputs some useful debugging
output, and I see that I’m passing the same argument twice:
$ perl add_numbers.pl 5 6
I got the arguments: [5 5 ]
The return value is going to be 10
The sum of 5 and 6 is 10
In that output, notice the space after the last 5. Since wrap added an element to @_, even
though it’s undef, I get a space between it and the preceding 5 when I interpolate the
array in the double-quoted string.
Hook::LexWrap has the magic to handle all the calling contexts too. It’s smart enough
to handle scalar, list, and void contexts. In list context, that last element of @_ in the
posthandler will be an array reference. In void context, it won’t be anything.
It gets even better than that, though.
Hook::LexWrap actually adds that extra element to
@_ before it does anything. Look at the last output carefully. After the second argument,
there’s a space between the second 5 and the closing square bracket. That’s the space
between 5 and the undef value of the extra element in @_.
In the prehandler, I can assign to that element, signaling to
Hook::LexWrap that it should
assume that it already has the return value, so it doesn’t need to actually run the original
subroutine. If the subroutine isn’t doing what I need, I can force it to return the right
value:
#!/usr/bin/perl
use Hook::LexWrap;
my $n = shift @ARGV;
my $m = $ARGV[0];
{
wrap add,
pre => sub {
print "I got the arguments: [@_]\n";
$_[-1] = "11";
},
post => sub { print "The return value is going to be $_[-1]\n" }
;
print "The sum of $n and $m is " . add( $n, $m ) . "\n";
}
sub add
{
my( $n, $m ) = @_;
my $sum = $n + $m;
return $sum;
}
58 | Chapter 4: Debugging Perl
Now that I’ve assigned to $_[-1] in my prehandler, the output is different. It doesn’t
run the subroutine or the posthandler, and I get back 11:
$ perl add_numbers.pl 5 6
I got the arguments: [5 6 ]
The sum of 5 and 6 is 11
With my fake return value, I can give myself the right answer and get on with the right
program, and do it without changing the subroutine I want to investigate. This can be
especially handy if I’m working on a big problem where other things are broken, too.
I know what I need to return from the subroutine so I make it do that until I fix the
other parts, or at least investigate the rest of the program while the subroutine returns
what it should. Sometimes eliminating a source of error, even temporarily, makes it
easier to fix other things.
perl5db.pl
We introduced the standard Perl debugger in Intermediate Perl so we could examine
complex data structures. It’s well documented in the perldebug, and Richard Foley
devoted an entire book, Pro Perl Debugging (Apress), to it, so I will only cover enough
of the basics here so I can move on to the fancier debuggers.
I invoke the Perl debugger with Perl’s
-d switch:
perl -d add_number.pl 5 6
Perl compiles the program, but stops before running the statements, giving me a
prompt. The debugger shows me the program name, line number, and the next state-
ment it will execute:
Loading DB routines from perl5db.pl version 1.25
Editor support available.
Enter h or `h h' for help, or `man perldebug' for more help.
main::(Scripts/debugging/add_numbers.pl:3):
3: my $n = shift @ARGV;
D<1>
From there I can do the usual debugging things, such as single-stepping through code,
setting breakpoints, and examining the program state.
I can also run the debugger on a program I specify on the command line with the
-e. I
still get the debugger prompt, but it’s not very useful for debugging a program. Instead,
I have access to the debugger prompt where I can try Perl statements:
$ perl -d -e 0
Loading DB routines from perl5db.pl version 1.25
Editor support available.
Enter h or `h h' for help, or `man perldebug' for more help.
perl5db.pl | 59
main::(-e:1): 0
D<1> $n = 1 + 2;
D<2> x $n
0 3
D<3>
We showed this debugger in Intermediate Perl, and it’s well documented in perldebug
and many other tutorials, so I won’t spend time on it here. Check the references in the
last section in this chapter, “Further Reading,” for sources of more information.
Alternative Debuggers
Besides the standard perl5db.pl, there are several other sorts of debuggers that I can
use, and there are several code analysis tools which use the debugging infrastructure.
There’s a long list of Devel:: modules on CPAN, and one of them probably suits your
needs.
Using a Different Debugger with -D
I can use an alternative debugger by giving the -d switch an argument. In this case, I
want to run my program under the Devel::DProf module. The -d switch implies the
Devel::, so I leave that off. I’ll cover profilers in depth in Chapter 5.
$ perl -d:DProf program.pl
If I write my own debugging module, I can pass arguments to the module just like I can
with the -M switch. I add the arguments as a comma-separated list after the module
name and an equal sign. In this example, I load the Devel::MyDebugger with the argu-
ments foo and bar:
$ perl -d:MyDebugger=foo,bar
As normal Perl code, this is the same as loading Devel::MyDebugger with use.
use Devel::MyDebugger qw( foo bar );
Devel::ptkdb
I can use a Tk-based debugger that provides a graphical interface to the same features
I have from perl5db.pl. The Devel::ptkdb module does not come with Perl, so I have to
install it myself.
*
I start ptkdb by specifying it as the debugger I want to use with the
-d switch:
$ perl -d:ptkdb program.pl
*
This might mean that I have to install the Tk module too. Once installed, I also have to be able to display it
in some sort of window manager. On my Powerbook, I use Apple’s X11 program (which is really XFree86
to the rest of the world). Windows users might want to use something such as ReflectionX.
60 | Chapter 4: Debugging Perl
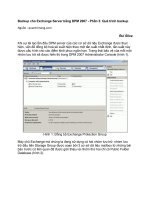
It starts by creating an application window. In the left pane, I see the program lines
around the current line, along with their line numbers (Figure 4-1). Buttons along the
code pane allow me to search through the code. In the right pane, I have tabs to examine
expressions, subroutines, and the list of current breakpoints.
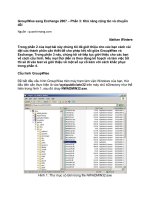
The “Subs” tab gives me a hierarchal list of package names and the subroutines defined
in them (Figure 4-2). These are all of the loaded modules, and I can immediately display
the code for any of those functions by selecting the one I want to see. I can select one
either by double-clicking or navigating with the arrow keys and hitting
<RETURN> when
I get to the one I want. It doesn’t change the state of my program, and I can use the
“Subs” tab to decide to step into a subroutine to watch its execution, or step over it
and continue with the execution of the program.
The “Exprs” tab is especially useful. It has two text entries at the top. “Quick Expr”
allows me to enter a Perl expression, which it then replaces with its result, and affects
the state of the program if my quick expression sets or changes variables. This is the
equivalent of trying a one-off expression in the terminal debugger. That’s nice, but the
“Enter Expr” is even better. I enter a Perl expression and it adds it to the list of expres-
sions in the pane below the tabs (Figure 4-3). As I run my code, these expressions update
their results based on the current state of the program. I can add the variables I want
to track, for instance, and watch their values update.
I start with a simple program where I want to add two numbers. It’s not something that
I need to debug (I hope), but I can use it to show the expressions tab doing its thing.
At the start of the program, I’m at the start of the program and nothing has run yet. I
single-step over the first line of code and can see the values for
$m and $n, which I had
previously entered as expressions. I could enter much more complex expressions, too,
and ptkdb will update them as I move through the code.
Figure 4-1. The Devel::ptkdb provides a graphical debugger using Tk
Alternative Debuggers | 61
Devel::ebug
The Devel::ebug module by Léon Brocard provides an object-oriented interface to Perl’s
debugger facility. It’s a work in progress, so what I say here might be different by the
time you read this. The main features should still be there, though.
It comes with its own terminal-based debugger named
ebug. It’s a bit of an odd name
until you realize how you call it. The missing d in the name comes from Perl’s -d switch.
$ perl -d:ebug program.pl
Figure 4-2. In the Subs tab, I can see the subroutine in any loaded package
Figure 4-3. I can track variable values in the Exprs tab
62 | Chapter 4: Debugging Perl
I don’t need to use the -d switch, though, since I can call it directly with the ebug
program, but I have to call it by quoting the entire command line:
†
$ ebug "add_numbers.pl 5 6"
* Welcome to Devel::ebug 0.46
main(add_numbers.pl#3):
my $n = shift @ARGV;
ebug: x @ARGV
5
6
main(add_numbers.pl#3):
my $n = shift @ARGV;
ebug: s
main(add_numbers.pl#4):
my $m = $ARGV[0];
ebug: x $n
5
The ebug program is really just a wrapper around Devel::ebug::Console, and I can call
Devel::ebug in many different ways. At the core of its design is a detached process. The
backend runs the program under the debugger, and the frontend communicates with
it over TCP. This means, for instance, I can debug the program on a different machine
than on the one it’s running.
The
Devel::ebug::HTTP module uses the same Devel::ebug backend, but sets up a mini
web server.
‡
I start the ebug_http the same way I did with the console version, but
instead of giving me a prompt, it tells me the URL I need to access to see the
debugger:
§
$ ebug_http "add_numbers.pl 4 5"
You can connect to your server at al:8321
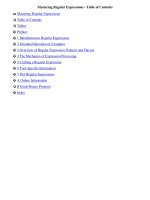
The web page shows me a bare bones debugger interface (Figure 4-4). Remember, this
is basically a proof of concept, but even as that it’s very impressive and can serve as the
basis for your own tailor-made programs.
†
The run method to Devel::ebug::Console concatenates with an empty string everything in @ARGV, so calling
this example without the quotes tries to run the program named
add_numbers.pl56 with no arguments.
‡
Once you get everything installed, but sure that you copy the root/ directory from the Devel::ebug::HTTP
distribution to the same directory as the Devel::ebug::HTTP modules. Find that directory with perldoc -l
Devel::ebug::HTTP
. The root/ directory has the files that Catalyst needs to make the web pages.
§
I can also guess the URL, since I know the name of the machine and can figure out which port it will use.
Alternative Debuggers | 63
Other Debuggers
EPIC
Eclipse
‖
is an open source development environment that runs on a variety of plat-
forms. It’s a Java application, but don’t let that scare you off. It has a modular design
so people can extend it to meet their needs. EPIC
#
is the Perl plug-in for Eclipse.
Eclipse is not just a debugger though, and that’s probably not even its most interesting
features. From the source code of my Perl program I can inspect classes, call up parts
of the Perl documentation, and do quite a bit more.
Komodo
ActiveState’s Komodo (Figure 4-5) started off as an integrated development environ-
ment for Perl on Microsoft Windows, although it’s now available on Solaris, Linux,
and Mac OS X. It handles Perl as well as several other languages, including Tcl, Ruby,
PHP, and Python.
Figure 4-4. The Devel::ebug::HTTP module lets me debug a program on a remote server through my
browser
‖
The Eclipse Foundation ().
#
Eclipse Perl Integration ().
64 | Chapter 4: Debugging Perl
Affrus
Affrus is a Perl-only debugger from Late Night Software
*
for Mac OS X. Since I work
almost exclusively on Mac, I really appreciate a debugger that’s quite Mac-like. Late
Night Software started with Script Debugger for AppleScript, so they’re tuned into
Macs. Besides that, Affrus has the usual debugging features.
One of the features I find especially useful is Affrus’s Arguments pane. I can add invo-
cations of my program, and then select which one I want to run. In Figure 4-6, I’ve
added two different command lines and selected the first one, which has the solid
diamond next to it. When I run the program,
@ARGV gets the elements 5 and 6. If I save
this as an Affrus file, the next time I open the program with Affrus I still have access to
those command lines.
Figure 4-5. ActiveState’s Komodo is a complete development environment and even comes with a
tutorial on its use
*
Late Night Software ().
Other Debuggers | 65
Like other debuggers, Affrus has a window where I can track the values of expressions.
Affrus uses a separate window to display those. I can also look in the Debugging pane
to see a list of all of the variables at any time (Figure 4-7).
Summary
I can debug my Perl program at almost any level I want, from inserting debugging code
around that part I want to inspect, or tweaking it from the outside with an integrated
development environment. I can even debug the program on a machine other than the
one I run it on. I don’t have to stick with one approach, and might use many of them
at the same time. If I’m not satisfied with the existing debuggers, I can even create my
own and tailor it for my particular task.
Further Reading
Perl Debugged by Peter Scott and Ed Wright (Addison-Wesley) is one of the best books
about actually programming with Perl. Not only do they show you how to effectively
debug a Perl program, but they also show you how to not get yourself into some of the
common traps that force you to debug a program. Sadly, this book appears to be out
Figure 4-6. Affrus allows me to configure several different command lines to use with my program;
it updates expressions as my program runs
66 | Chapter 4: Debugging Perl
of print, but don’t let the $1.99 price for a used version on Amazon.com color your
notion of its usefulness.
Pro Perl Debugging (Apress) by Richard Foley tells you everything you need to know
about the
perl5db.pl debugger, which comes with Perl. If you like Perl’s default de-
bugger, this book will tell you everything you want to know about it.
My first ever piece of Perl writing was a little piece for The Perl Journal number 9 called
“Die-ing on the Web.” It’s available at my personal web site: />comdog/Articles/Die_and_the_Web.txt.
I talk more about
Hook::LexWrap in “Wrapping Subroutines” in the July 2005 issue of
The Perl Journal. The article originally appeared in The Perl Journal and now appears
in the “Lightweight Languages” section on Dr. Dobb’s Journal Online: http://
www.ddj.com/dept/lightlang/184416218.
The Practice of Programming by Brian W. Kernighan and Rob Pike (Addison-Wesley)
discusses their approach to debugging. Although this isn’t a Perl book, it really doesn’t
need to be about any language. It’s practical advice for any sort of programming.
Figure 4-7. Affrus shows me the values of package variables in the Debugging pane
Further Reading | 67
CHAPTER 5
Profiling Perl
Before I can do anything to improve my programs, I have to make a decision about
what I am going to fix. Before I spend the time to do that, I want to figure out what I
should focus on. How do I get the most improvement for the least amount of fiddling?
What should I work on first? Through the process of profiling, by which I record and
summarize what a program is doing, I can make those decisions. Luckily, Perl already
offers several tools to do this.
Finding the Culprit
I want to compute a factorial. It’s the old saw of performance discussions, and I’ll get
to something more interesting in a moment. When I Googled for “factorial subrou-
tines,” almost every implementation (aside from those in assembly language) was a
recursive algorithm, meaning that a subroutine had to figure out part of the problem,
then call itself with a subproblem, and keep doing that until there are no more sub-
problems, eventually working its way up to the original call. Here’s how I’d write that
in Perl:
#!/usr/bin/perl
# factorial-recurse.pl
sub factorial
{
return unless int( $_[0] ) == $_[0];
return 1 if $_[0] == 1;
return $_[0] * factorial( $_[0] - 1 );
}
print factorial( $ARGV[0] ), "\n";
Now I want to figure out how to improve this toy program. It’s already pretty fast
because Perl can’t really count that high. With anything over 170, my program on my
machine returns Inf (more on that in a moment). Despite that, I’ll profile it anyway. I
use the Devel::SmallProf module to get a quick summary. I invoke it with the -d switch,
which already assumes the
Devel portion of the name (see Chapter 4):
69
% perl -d:SmallProf factorial.pl 170
The Devel::SmallProf module leaves behind a human-readable text file named
smallprof.out. In its columnar output, it shows each line of the program, how many
times I executed that line, and the real and CPU times for each line:
================ SmallProf version 1.15 =========================
Profile of factorial.pl Page 1
=================================================================
count wall tm cpu time line
0 0.000000 0.000000 1:#!/usr/bin/perl
0 0.000000 0.000000 2:
170 0.000000 0.000000 3:sub factorial {
170 0.001451 0.000000 4: return unless int( $_[0] ) == $_[0];
170 0.004367 0.000000 5: return 1 if $_[0] == 1;
169 0.004371 0.000000 6: return $_[0] * factorial( $_[0] - 1 );
0 0.000000 0.000000 7: }
0 0.000000 0.000000 8:
1 0.000009 0.000000 9:print factorial( $ARGV[0] ), "\n";
To compute the factorial of 170, I had to call the subroutine 170 times. Each time (save
for one!) I called that subroutine, I had to execute the lines in the subroutine. I had to
check that the argument was an integer each time, I had to check if the argument was
1 each time, and in almost every case, I had to call the subroutine again. That’s a lot of
work. By profiling my program, I can see what is taking up all the time, and then
concentrate on improving those areas.
The best way to fix these problems is to come up with a better way to get the answer.
Better algorithms get you better performance than almost any other method. Instead
of using a recursive solution, I changed it to an iterative one. I can easily get the range
of integers using the range operator, and in other languages, a C style
for loop can stand
in:
#!/usr/bin/perl
# factorial-iterate.pl
sub factorial {
return unless int( $_[0] ) == $_[0];
my $f = 1;
foreach ( 2 $_[0] ) { $f *= $_ };
$f;
}
print factorial( $ARGV[0] ), "\n";
When I profile this program, I see that I did not have to do as much work. I didn’t have
as much code to run. I only had to check the argument once, I didn’t have to check if
the argument was 1, and I don’t have to make repeated calls to a subroutine:
================ SmallProf version 1.15 =========================
Profile of factorial2.pl Page 1
=================================================================
count wall tm cpu time line
0 0.000000 0.000000 1:#!/usr/bin/perl
70 | Chapter 5: Profiling Perl
0 0.000000 0.000000 2:
1 0.000000 0.000000 3:sub factorial {
1 0.000021 0.000000 4: return unless int( $_[0] ) == $_[0];
1 0.000000 0.000000 5: my $f = 1;
170 0.001632 0.000000 6: foreach ( 2 $_[0] ) { $f *= $_ };
1 0.002697 0.000000 7: $f;
0 0.000000 0.000000 8: }
0 0.000000 0.000000 9:
1 0.000006 0.000000 10:print factorial( $ARGV[0] ), "\n";
Earlier I said that my program topped out at 170. I can get past that limit by telling Perl
to use the bignum pragma:
#!/usr/bin/perl
# factorial-recurse-bignum.pl
use bignum;
sub factorial {
return unless int( $_[0] ) == $_[0];
return 1 if $_[0] == 1;
return $_[0] * factorial( $_[0] - 1 );
}
print factorial( $ARGV[0] ), "\n";
Now I can see some real performance differences by comparing the factorials of really
big numbers. As I was finishing this book, I switched to a MacBook Pro and its dual
core architecture had no problem with speed in either of the approaches. Only with
really large numbers did the recursive approach really slow down.
That’s not the whole story, though. I’ve shown a really simple program that calculates
a single number. In a real program I would most likely use the
factorial routine many,
many times with several different values. When I profile the application, I’ll see the
number of times I run the lines of the subroutine throughout the entire process.
Either approach can benefit from caching its results. Here’s a program that repeatedly
prompts me for a number. It computes the factorial and caches the results along the
way, trading memory for speed. The first time I ask it to compute the factorial for
10,000, it takes several seconds. After that, when I ask it for the factorial for any number
less than 10,000, it’s just a very fast lookup:
#!/usr/bin/perl
# factorial-iterate-bignum-memo.pl
use bignum;
{
my @Memo = (1);
sub factorial {
my $number = shift;
return unless int( $number ) == $number;
Finding the Culprit | 71
return $Memo[$number] if $Memo[$number];
foreach ( @Memo $number )
{
$Memo[$_] = $Memo[$_ - 1] * $_;
}
$Memo[ $number ];
}
}
{
print "Enter a number> ";
chomp( my $number = <STDIN> );
exit unless defined $number;
print factorial( $number ), "\n";
redo;
}
I can do the same with the recursive solution, although the Memoize module does the
extra work for me:
#!/usr/bin/perl
# factorial-recurse-bignum-memo.pl
use bignum;
use Memoize;
memoize( factorial );
sub factorial {
return unless int( $_[0] ) == $_[0];
return 1 if $_[0] == 1;
return $_[0] * factorial( $_[0] - 1 );
}
{
print "Enter a number> ";
chomp( my $number = <STDIN> );
exit unless defined $number;
print factorial( $number ), "\n";
redo;
}
While profiling, I must remember that some things in isolation don’t tell me the whole
story. The profile can help me make decisions, but I’m the one who has to do the
thinking, not the computer.
72 | Chapter 5: Profiling Perl
The General Approach
Profiling means counting, and to count something, I need to make the statements do
something so I can count them. I might, for instance, use some of the features from
Chapter 4 to add accounting code to my subroutines. That’s much too tedious, though.
Instead of trying to account for things in individual subroutines, I try to make everything
flow through a single control subroutine. This is probably too much for a small pro-
gram, but in a large system, the extra computing pays off in saved developer time when
I work on optimizing the program.
The most common place I do this is in database code. In the database case, I want to
track with queries I make, usually so I can get an idea of which queries take a long time
or which ones I most frequently use. From that, I can figure out what I should optimize.
Here’s an example of a nexus for all queries that allows me to profile my database code.
I’ve simplified this example, but this is close to some actual code I’ve used, minus some
stuff that doesn’t apply to profiling. I have a package-scoped lexical variable
%Queries
that will hold my profile data. The simple_query method is essentially a wrapper around
prepare and execute with some accounting overhead:
package My::Database;
my %Queries;
sub simple_query
{
my( $self, @args ) = @_;
my $sql_statement = shift @args;
$Queries{$sql_statement}++; # < Profiling hook
my $sth = $self->dbh->prepare( $sql_statement );
unless( ref $sth ) { warn $@; return }
my $rc = $sth->execute( @args );
wantarray ? ( $sth, $rc ) : $rc;
}
In the rest of my database code, I have functions that use simple_query instead of using
the DBI interface directly. My get_postage_rates_by_country grabs the amount of post-
age I need to send mail overseas. It passes the SQL statement and a bind parameter to
simple_query. As before, this is real code, although I’ve cut out some bits to only show
the relevant parts:
sub get_postage_rates_by_country
{
my( $self, $country ) = @_;
my( $sth ) = $self->simple_query( <<"SQL", $country );
SELECT
The General Approach | 73
PostageRates.ounces,
PostageRates.rate,
PostageServices.name
FROM
PostageRates, Countries, PostageServices
WHERE
Countries.pk = ?
AND
Countries.usps_zone = PostageRates.usps_zone
AND
PostageRates.service = PostageServices.pk
ORDER BY
PostageRates.ounces
SQL
return $sth->fetchall_arrayref;
}
As my program does its work, the queries flow through simple_query, which counts
and records what happens. To get the profile data, I use an END block to create the
report. The particular format depends on what I collected during the run. In this ex-
ample I just counted statements, but I could use that %Queries hash to store anything
I wanted, including the bind parameters, the function that called simple_query, and so
on:
END {
foreach my $statement ( sort { $b <=> $a } keys %Queries )
{
printf "%5d %s\n\n", $Queries{$statement}, $statement;
}
}
I might find, for instance, that in a long report that I repeatedly fetch the postage data
for each country, even though it’s not going to change. When I realize I’m doing this
after looking at the profile data, I can optimize my code to cache some of the data in
memory rather than asking for the same answer in the database.
I’ve actually been coding my Perl database stuff like this for quite a while, and I recently
found out that Tim Bunce added these features directly to DBI. He did the same sort
of thing by making everything flow through a central function. That was really easy
because
DBI already does that for queries.
Profiling DBI
The DBI::Profile module can do much of the same work but for my use of Perl’s
database interface module, DBI. Database interactions are often the biggest performance
drain on my programs, and that’s a place I usually start to look for improvements.
Instead of calling subroutines unnecessarily, as in my last example, I might be making
unnecessary database queries.
74 | Chapter 5: Profiling Perl
Here’s a short program that takes quite a bit of time because it makes almost 2,000
database queries. I want to build a table of number names, so given a digit I can get the
name (e.g., 9 has the name “Nine”), or go from the name to the digit. I should probably
use a Lingua::* module, but then I don’t want to start off with something smart. In this
example, I use the
DBD::CSV module to use a comma-separated value file as my database
store. I create a table to hold the pairs, and then start to populate the table. I bootstrap
the data by getting the first 19 names into the table, then looking up the names I already
have to create further names:
#!/usr/bin/perl
# dbi-number-inserter.pl
use strict;
use DBI;
my $dbh = DBI->connect( "DBI:CSV:f_dir=." );
$dbh->do( "DROP TABLE names" );
$dbh->do( "CREATE TABLE names ( id INTEGER, name CHAR(64) )" );
my $sth = $dbh->prepare( "INSERT INTO names VALUES ( ?, ? )" );
my $id = 1;
foreach my $name (
qw(One Two Three Four Five Six Seven Eight Nine Ten),
qw(Eleven Twelve Thirteen Fourteen Fifteen Sixteen Seventeen Eighteen
Nineteen)
)
{
$sth->execute( $id++, $name );
}
foreach my $name ( qw( Twenty Thirty Forty Fifty Sixty Seventy Eighty Ninety ) )
{
$sth->execute( $id++, $name );
foreach my $ones_digit ( 1 9 )
{
my( $ones_name ) = map { lc } $dbh->selectrow_array(
"SELECT name FROM names WHERE id = $ones_digit"
);
$sth->execute( $id++, "$name $ones_name" );
}
}
foreach my $digit ( 1 9 )
{
my( $hundreds ) = $dbh->selectrow_array(
"SELECT name FROM names WHERE id = $digit"
);
$sth->execute( $id++, "$hundreds hundred" );
foreach my $tens_digit ( 1 99 )
Profiling DBI | 75
{
my( $tens_name ) = map { lc } $dbh->selectrow_array(
"SELECT name FROM names WHERE id = $tens_digit"
);
$sth->execute( $id++, "$hundreds hundred $tens_name" );
}
}
I run this from the command line, and it takes almost two minutes on my Powerbook
G4. That’s okay; I need a nice, slow example. Now I want to profile this program to
see where I can improve it, pretending I was just handed it without knowing how it
works. I set the DBI_PROFILE environment variable to turn on database profiling.
*
To
get a report ordered by statements, I set DBI_PROFILE='!Statement'. The sort key has
an exclamation point, !, prepended to it. At the end of the run, I get a long report. Here
are the first several lines:
$ env DBI_PROFILE='!Statement' perl dbi-profile.pl
DBI::Profile: 109.671362s 99.70% (1986 calls) dbi-profile.pl @ 2006-10-10 02:18:40
'' =>
0.000784s / 10 = 0.000078s avg (first 0.000023s, min 0.000001s, max 0.000618s)
'CREATE TABLE names ( id INTEGER, name CHAR(64) )' =>
0.004258s
'DROP TABLE names' =>
0.008017s
'INSERT INTO names VALUES ( ?, ? )' =>
3.229462s / 1002 = 0.003223s avg (first 0.001767s, min 0.000037s, max 0.108636s)
'SELECT name FROM names WHERE id = 1' =>
1.204614s / 18 = 0.066923s avg (first 0.012831s, min 0.010301s, max 0.274951s)
'SELECT name FROM names WHERE id = 10' =>
1.118565s / 9 = 0.124285s avg (first 0.027711s, min 0.027711s, max 0.341782s)
'SELECT name FROM names WHERE id = 11' =>
1.136748s / 9 = 0.126305s avg (first 0.032328s, min 0.032328s, max 0.378916s)
The top line gives me the wallclock time and the total number of DBI method calls;
that’s the number of method calls to DBI, not the number of queries. After that, I get a
report for each query, in lexical order. Just because it looks like it’s sorted by total time
or number of queries, don’t forget to look at the rest of the report. It’s actually sorted
in alphabetical order of the query.
For each query,
DBI::Profile reports the total wallclock time and the number of meth-
od calls for that statement. It doesn’t report the CPU time because it isn’t very
interesting; the database server might be another machine, and even if it is local, it’s
often a separate process. It gives an average time for that query, and then the times for
the first call, the call that took the least amount of time, and the call that took the most.
This isn’t as simple as timing a program. The database server might perform differently
given the same input because it might be doing something else, the data size might be
different, or many other things.
*
Alternately, I can set $dbh->{Profile} from within my program.
76 | Chapter 5: Profiling Perl
From the full report, I see that most calls took about the same amount of time since
they are all running pretty quickly, so I can’t make a big speedup by optimizing a query
so it performs better on the database. No indexing or rearrangement of joins will likely
help here.
What I really need to reduce is the number of queries so I interact with the database
less. I can’t get away from the
INSERTs since I still have to make each row, but I don’t
need to make all of those select statements. I should cache the result so I don’t fetch
the same data twice (or even at all):
#!/usr/bin/perl
# dbi-number-inserter-cached.pl
use strict;
use DBI;
my $dbh = DBI->connect( "DBI:CSV:f_dir=." );
$dbh->do( "DROP TABLE names" );
$dbh->do( "CREATE TABLE names ( id INTEGER, name CHAR(64) )" );
my $insert = $dbh->prepare( "INSERT INTO names VALUES ( ?, ? )" );
my @array = ( qw( Zero ),
qw(One Two Three Four Five Six Seven Eight Nine Ten),
qw(Eleven Twelve Thirteen Fourteen Fifteen Sixteen Seventeen Eighteen
Nineteen)
);
my $id = 0;
foreach my $name ( @array )
{
$insert->execute( $id++, $name );
}
foreach my $name ( qw( Twenty Thirty Forty Fifty Sixty Seventy Eighty Ninety ) )
{
$array[ $id ] = $name;
$insert->execute( $id++, $name );
foreach my $ones_digit ( 1 9 )
{
my $full_name = $array[ $id ] = "$name $array[$ones_digit]";
$insert->execute( $id++, $full_name );
}
}
foreach my $digit ( 1 9 )
{
my( $hundreds ) = $array[ $digit ];
my $name = $array[$id] = "$hundreds hundred";
$insert->execute( $id++, $name );
foreach my $tens_digit ( 1 99 )
Profiling DBI | 77
{
my( $tens_name ) = lc $array[ $tens_digit ];
$array[$id] = "$hundreds hundred $tens_name";
$insert->execute( $id++, "$name $tens_name" );
}
}
In my first pass at improvement, I don’t have any select statements at all because I cache
the results. That cuts out most of the runtime in this program. The times for each
program are remarkably different. Remember, however, that I’ve made a trade-off be-
tween speed and memory. The second program is faster, but it takes up more memory:
$ time perl dbi-profile.pl
real 1m48.676s
user 1m21.136s
sys 0m1.698s
$ time perl dbi-profile2.pl
real 0m2.638s
user 0m1.736s
sys 0m0.307s
Here’s the entire profile report for my new program, which now runs in two percent
of the original runtime. Most of the calls are INSERTs:
$ env DBI_PROFILE='!Statement' perl dbi-profile2.pl
DBI::Profile: 2.118577s 105.93% (1015 calls) dbi-profile2.pl @ 2006-10-10 02:31:10
'' =>
0.000757s / 10 = 0.000076s avg (first 0.000021s, min 0.000001s, max 0.000584s)
'CREATE TABLE names ( id INTEGER, name CHAR(64) )' =>
0.004216s
'DROP TABLE names' =>
0.006906s
'INSERT INTO names VALUES ( ?, ? )' =>
2.106698s / 1003 = 0.002100s avg (first 0.001713s, min 0.000037s, max 0.005587s)
By looking at the profile, I was able to target part of the program for improvement. It
didn’t tell me how to improve it, but at least I know where I should spend my time.
Other DBI::Profile Reports
The runtime report isn’t the only one I can get. With DBI_PROFILE='!MethodName', DBI
orders the report according to the name of the DBI function. It’s in ASCII-betical order
with the uppercase letters sorting before the lowercase ones (and I’ve redacted part of
these reports since they shows all of the methods, including the ones I didn’t even know
I was using):
$ env DBI_PROFILE='!MethodName' perl dbi-profile2.pl
DBI::Profile: 2.168271s 72.28% (1015 calls) dbi-profile2.pl @ 2006-10-10 02:37:16
'DESTROY' =>
0.000141s / 2 = 0.000070s avg (first 0.000040s, min 0.000040s, max 0.000101s)
'FETCH' =>
0.000001s
'STORE' =>
78 | Chapter 5: Profiling Perl
0.000067s / 5 = 0.000013s avg (first 0.000022s, min 0.000006s, max 0.000022s)
'do' =>
0.010498s / 2 = 0.005249s avg (first 0.006602s, min 0.003896s, max 0.006602s)
'execute' =>
2.155318s / 1000 = 0.002155s avg (first 0.002481s, min 0.001777s, max 0.007023s)
'prepare' =>
0.001570s
I can even combine the two since DBI::Profile can deal with multiple sort keys if I join
them with a colon. With DBI_PROFILE='!Statement:!MethodName', DBI gives me a double
layer report. Under each SQL statement, it breaks the time down by the particular
function it used. I might, for instance, want to compare the time my database query
spends in the DBI guts and actually fetching the data:
$ env DBI_PROFILE='!Statement:!MethodName' perl dbi-profile2.pl
DBI::Profile: 2.123325s 106.17% (1015 calls) dbi-profile2.pl @ 2006-10-10 02:38:22
'' =>
'FETCH' =>
0.000001s
'STORE' =>
0.000069s / 5 = 0.000014s avg (first 0.000024s, min 0.000005s,↲
max 0.000024s)
'connect' =>
0.000644s
'default_user' =>
0.000030s
'disconnect' =>
0.000050s
'disconnect_all' =>
0.000024s
'CREATE TABLE names ( id INTEGER, name CHAR(64) )' =>
'do' =>
0.004616s
'DROP TABLE names' =>
'do' =>
0.007191s
'INSERT INTO names VALUES ( ?, ? )' =>
'DESTROY' =>
0.000149s / 2 = 0.000075s avg (first 0.000050s, min 0.000050s,↲
max 0.000099s)
'execute' =>
2.108945s / 1000 = 0.002109s avg (first 0.002713s, min 0.001796s,↲
max 0.005454s)
'prepare' =>
0.001606s
I can flip that last report around by using DBI_PROFILE='!MethodName:!Statement'. The
first layer lists the DBI method and then breaks it down by SQL statements after that:
$ env DBI_PROFILE='!MethodName:!Statement' perl dbi-profile2.pl
DBI::Profile: 2.431843s 81.06% (1015 calls) dbi-profile2.pl @ 2006-10-10 02:40:40
'DESTROY' =>
'INSERT INTO names VALUES ( ?, ? )' =>
0.000142s / 2 = 0.000071s avg (first 0.000039s, min 0.000039s,↲
max 0.000103s)
Profiling DBI | 79
'FETCH' =>
'' =>
0.000001s
'STORE' =>
'' =>
0.000065s / 5 = 0.000013s avg (first 0.000022s, min 0.000005s,↲
max 0.000022s)
'connect' =>
'' =>
0.000685s
'default_user' =>
'' =>
0.000024s
'disconnect' =>
'' =>
0.000050s
'disconnect_all' =>
'' =>
0.000023s
'do' =>
'CREATE TABLE names ( id INTEGER, name CHAR(64) )' =>
0.004287s
'DROP TABLE names' =>
0.006389s
'execute' =>
'INSERT INTO names VALUES ( ?, ? )' =>
2.418587s / 1000 = 0.002419s avg (first 0.002549s, min 0.001819s,↲
max 0.013104s)
'prepare' =>
'INSERT INTO names VALUES ( ?, ? )' =>
0.001589s
Making It Even Easier
Sam Tregar’s DBI::ProfileDumper module does the same thing as DBI::Profile, but it
saves its result in a file instead of dumping it to standard output.
†
By default, this file
is named dbi.prof, but I can use any name I like. For anything but a small application,
I’ll probably have to do quite a bit of custom slicing and dicing to extract the informa-
tion I need.
First, I tell DBI which profiling class it should use by including it in the
DBI_PROFILE
value. I join the class name to the profiling sort keys with a /:
$ env DBI_PROFILE='!Statement'/DBI::ProfileDumper ./program.pl
Once that command completes, dbi.prof has all of the profiling data. If I want to change
the filename, I just add that to DBI_PROFILE by appending it after the class name:
$ env DBI_PROFILE='!Statement'/DBI::ProfileDumper/File:dbi.prof ./program.pl
†
Sam also wrote DBI::ProfileDumper::Apache for use under mod_perl.
80 | Chapter 5: Profiling Perl