Báo cáo khoa học: "parison between logistic regression and neural networks to predict death in patients with suspected sepsis in the emergency room" ppsx
Bạn đang xem bản rút gọn của tài liệu. Xem và tải ngay bản đầy đủ của tài liệu tại đây (155.87 KB, 7 trang )
Open Access
Available online />R150
April 2005 Vol 9 No 2
Research
Comparison between logistic regression and neural networks to
predict death in patients with suspected sepsis in the emergency
room
Fabián Jaimes
1
, Jorge Farbiarz
2
, Diego Alvarez
3
and Carlos Martínez
4
1
Associate Professor, Department of Internal Medicine and Escuela de Investigaciones Médicas Aplicadas (EIMA – GRAEPI), School of Medicine,
Universidad de Antioquia, Medellín, Colombia
2
Chairman, Department of Physiology, Universidad de Antioquia, Medellín, Colombia
3
Assistant Professor, Department of Physiology, Universidad de Antioquia, Medellín, Colombia
4
Assistant Physician, Department of Internal Medicine, Division of Pulmonary and Critical Care Medicine, Fundación Santa Fe de Bogotá, Bogotá,
Colombia
Corresponding author: Fabián Jaimes,
Abstract
Introduction Neural networks are new methodological tools based on nonlinear models. They appear
to be better at prediction and classification in biological systems than do traditional strategies such as
logistic regression. This paper provides a practical example that contrasts both approaches within the
setting of suspected sepsis in the emergency room.
Methods The study population comprised patients with suspected bacterial infection as their main
diagnosis for admission to the emergency room at two University-based hospitals. Mortality within the
first 28 days from admission was predicted using logistic regression with the following variables: age,
immunosuppressive systemic disease, general systemic disease, Shock Index, temperature, respiratory
rate, Glasgow Coma Scale score, leucocyte counts, platelet counts and creatinine. Also, with the same
input and output variables, a probabilistic neural network was trained with an adaptive genetic
algorithm. The network had three neurone layers: 10 neurones in the input layer, 368 in the hidden layer
and two in the output layer. Calibration was measured using the Hosmer-Lemeshow goodness-of-fit
test and discrimination was determined using receiver operating characteristic curves.
Results A total of 533 patients were recruited and overall 28-day mortality was 19%. The factors
chosen by logistic regression (with their score in parentheses) were as follows: immunosuppressive
systemic disease or general systemic disease (2), respiratory rate 24–33 breaths/min (1), respiratory
rate ≥ 34 breaths/min (3), Glasgow Come Scale score ≤12 (3), Shock Index ≥ 1.5 (2) and temperature
<38°C (2). The network included all variables and there were no significant differences in predictive
ability between the approaches. The areas under the receiver operating characteristic curves were
0.7517 and 0.8782 for the logistic model and the neural network, respectively (P = 0.037).
Conclusion A predictive model would be an extremely useful tool in the setting of suspected sepsis in
the emergency room. It could serve both as a guideline in medical decision-making and as a simple way
to select or stratify patients in clinical research. Our proposed model and the specific development
method – either logistic regression or neural networks – must be evaluated and validated in an
independent population.
Received: 5 October 2004
Revisions requested: 1 December 2004
Revisions received: 17 December 2004
Accepted: 13 January 2005
Published: 17 February 2005
Critical Care 2005, 9:R150-R156 (DOI 10.1186/cc3054)
This article is online at: />© 2005 Jaimes et al.; licensee BioMed Central Ltd.
This is an Open Access article distributed under the terms of the
Creative Commons Attribution License ( />licenses/by/2.0), which permits unrestricted use, distribution, and
reproduction in any medium, provided the original work is properly
cited.
ANN = artificial neural network; APACHE = Acute Physiology and Chronic Health Evaluation; ER = emergency room; GCS = Glasgow Coma Scale;
GSD = general systemic disease; ICU = intensive care unit; ISD = immunosuppressive systemic disease; ROC = receiver operating characteristic;
SIRS = systemic inflammatory response syndrome.
Critical Care April 2005 Vol 9 No 2 Jaimes et al.
R151
Introduction
Sepsis is the second leading cause of death among patients
in noncoronary intensive care units (ICUs) and is the 10th
leading cause of death overall in the USA [1]. Despite new and
complex therapies, the incidence of sepsis has increased
annually at a constant rate over the past 20 years, and there
have been no substantial changes in the associated mortality
[2].
A tool that could stratify the severity of sepsis from the initial
stages in the clinical course would enhance our understanding
of this disorder and its management. A simple system
designed to estimate the probability of death would represent
the basis for improved diagnosis, prognostication and treat-
ment. Specifically, such a model, in the setting of the emer-
gency room (ER), could guide decisions regarding ICU
admission or whether a particular type of therapy should be
instituted. The strategy may be developed from the definitions
proposed by the American College of Chest Physicians/Soci-
ety of Critical Care Medicine in 1992 [3]. These definitions
include a generalized process with clinical findings that may
represent an initial phase during the sepsis phenomenon – the
systemic inflammatory response syndrome (SIRS). Although
the natural history seems to reflect a continuum through differ-
ent stages of an inflammatory response, from SIRS to septic
shock [4], an unequivocal linear sequence of events is far from
clinically apparent. Thus, classical analytical models, such as
logistic regression, are limited in terms of their ability to eluci-
date the interplay that underlies the sepsis phenomenon.
Advances in statistical methods have supplied the tools nec-
essary to model complex nonlinear relationships among many
variables relevant to biological systems. Artificial neural net-
works (ANNs) are computer programs that simulate some of
the higher level functions of the human brain. As in the brain,
there are neurones and synapses, with various synaptic con-
nection strengths – called 'weights' – for each connected pair
of neurones. However, unlike the brain but similar to many
computer programs, there is a specific set of input and output
neurones for each problem and each net. These input and out-
put neurones correspond to the inputs to and outputs from a
traditional computer program. The other, termed 'hidden' neu-
rones, along with the synapses and weights, correspond to the
instructions in a traditional program. Use of ANNs as clinical
prediction models has been explored in many areas of medi-
cine, including nephrology [5], microbiology [6], radiology [7]
and neurology [8]. Thus far, however, we are unaware of their
use in sepsis. In this study we present a practical example that
contrasts the abilities of logistic regression and neural net-
works to predict death in patients admitted to the ER with sus-
pected sepsis as their main cause of hospitalization.
Materials and methods
Study design
In this longitudinal cohort study, patients were recruited
between August 1998 and March 1999. Starting from admis-
sion to the ER, the patients were followed for 28 days or until
death.
Setting
The patients were admitted to the ERs of two reference hospi-
tals: the Hospital Universitario San Vicente de Paúl and the
Hospital General de Medellín. Hospital Universitario San Vice-
nte de Paúl is a 550-bed, fourth level university hospital, and is
a referral centre for a region including approximately 3 million
habitants. Hospital General de Medellín is a 300-bed, third
level teaching hospital, and is a referral centre for the metro-
politan area. Both are located in Medellín, Colombia.
Participants
We included patients aged 15 years or older with any sus-
pected or confirmed bacterial infection as their admission
diagnosis and at least one of the following SIRS criteria: tem-
perature >38°C or <36°C; and leucocyte count >12000/
mm
3
, <4000/mm
3
, or >10% immature forms (bands). We
excluded eligible participants if they, their relatives, or their
doctors refused to provide consent to participate in the study,
or if they died or were discharged before 24 hours. Ethics
committees of both hospitals had previously approved the pro-
tocol, and patients or their legal representatives signed an
informed consent form.
Measurements
The primary outcome variable was mortality within the first 28
days after admission to the ER. For those patients who were
discharged before day 28, an evaluation of their vital status
was conducted in the outpatient control centre or by phone if
a personal interview was not possible. Independent variables
recorded at admission were as follows: age, immunosuppres-
sive systemic disease (ISD; i.e. any of cancer, chemotherapy,
steroid use or AIDS), general systemic disease (GSD; i.e. any
of cardiac failure, diabetes, renal failure, chronic obstructive
lung disease, or cirrhosis), Shock Index (heart rate/systolic
arterial pressure), body temperature, respiratory rate, Glasgow
Coma Scale (GCS) score, leucocyte count, platelet count and
creatinine blood level. Research assistants in the ER collected
clinical variables at admission in a standardized manner. Lab-
oratory variables were analyzed using standard quality control
procedures at the participating institutions. Missing data for
continuous variables were estimated with simple imputations
using the median nonmissing value. In total, estimation proce-
dures were performed in 2.6% (14 simple records) of baseline
values.
Data analysis and management
The procedure for the logistic model has been described in
detail elsewhere [9]. Briefly, we conducted univariate logistic
Available online />R152
regression analysis for each candidate variable, with P < 0.25
being the criterion for acceptance in the model. Collinearity
was checked with a matrix of correlations, using the Spearman
rank correlation coefficient between independent variables.
We chose a conservative strategy, with r ≥ 0.4 in at least one
correlation as the criterion for multicollinearity. Logistic model
assumptions (i.e. no interaction terms and a linear relationship
between the logit and the continuous covariates) were veri-
fied. Then, a logistic regression analysis, employing a forward
stepwise inclusion method, was developed using a P value of
0.05 at entry. This automatic procedure was contrasted with a
backward elimination method and with a full model that
included all of the candidate variables, in order to confirm the
validity and stability of our results. For continuous variables,
the cutoff points for changes in the probability of death were
explored with locally weighted regression analysis and the
lowess procedure [10]. According to the cutoff points
detected, dummy variables were constructed and a new logis-
tic regression model was fitted with those variables. In order to
obtain the simplest score with the same scale within and
between ranges of physiological variables and co-morbid con-
ditions, the regression coefficients were all divided by the low-
est one, and then rounded off to the nearest whole number, as
the weight reflecting 'risk' for death for each variable. In defin-
ing the severity levels by the size of the coefficients, compara-
ble severity levels within variables or conditions were grouped
together. The global score for every patient in the cohort was
calculated and a new logistic regression equation with the
score as independent variable was fitted.
The model calibration – observed mortality versus that pre-
dicted with the score – was evaluated using the Hosmer-
Lemeshow goodness-of-fit test. The test result, under a χ
2
dis-
tribution, provides a P value in which higher values (P > 0.05)
indicate nonsignificant differences between observed and
predicted mortality. The discriminatory ability – the capacity of
the model to separate survivors from nonsurvivors, with 1.0
and 0.5 meaning perfect and random discrimination, respec-
tively – was determined using receiver operating characteristic
(ROC) curve analysis. Internal validation was done with 2000
bootstrap replications of the model. All statistical analyses
were performed with Stata Statistical Software, Release 7.0
(Stata Corporation, College Station, TX, USA).
Using the same input and output variables, a probabilistic neu-
ral network was trained using an adaptive genetic algorithm
(NeuroShell
©
; Ward Systems Group Inc., Frederick, MD,
USA). The network has three neurone layers, with 10 neurones
in the input layer, 368 in the hidden layer and two in the output
layer, the latter indicating death versus survival. Of the cohort
75% was used to train the network and 25% was used in test-
ing. The training criterion was that 20 generations had elapsed
without changes in the minimum error. The general perform-
ance of the neural network was evaluated using the ROC
curve and the Hosmer-Lemeshow goodness-of-fit test. The
difference between the two ROC curves – logistic regression
and neural network – was tested using the Wilcoxon statistic
based on pairwise comparisons [11].
Results
A total of 542 potentially eligible participants were admitted
during the study period. Nine were excluded because of death
(n = 5) or discharge (n = 4) during the first 24 hours. The final
study population therefore included 533 patients, 55% (n =
293) of whom were male. Their age (mean ± standard devia-
tion) was 48 ± 21 years, and their median hospital stay was 8
days (interquartile range 4–15 days). Overall 28-day mortality
was 19% (n = 101), and 14% (n = 75) of the cohort was
admitted to ICU.
The most common diagnoses suspected at admission were
community-acquired pneumonia (recorded in 36% of
patients), followed by soft tissue infection (17%), intra-abdom-
inal infection (12%), urinary tract infection (11%) and others
(11%); sepsis of undetermined source was recorded in 13%
patients. The major pre-existing conditions related to admis-
sion were trauma or surgery more than 24 hours before admis-
sion (21%), chronic obstructive pulmonary disease (12%),
diabetes (13%) and miscellaneous others (9%). Of the
patients, 45% were free of associated diseases.
A total of 283 (53%) out of 533 cases of clinically suspected
bacterial infection were microbiologically confirmed, 113 of
which (40%) grew on blood samples. The rate of positive
blood cultures among the total requested was 27%, and the
most frequently isolated micro-organisms were Escherichia
coli (19%), Staphylococcus aureus (16%), Streptococcus
pneumoniae (13%), Staphylococcus coagulase negative
(13%), Klebsiella pneumoniae (9%), Enterobacter spp. (6%),
Enterococcus spp. (4%), Streptococcus pyogenes (3%), non-
fermenting Gram-negative bacilli (3%) and others (14%).
After conducting univariate analysis for the logistic regression,
leucocyte count was considered ineligible for inclusion in the
model (P = 0.893). The evaluation of collinearity was carried
out for all variables using the Spearman correlation coefficient.
A significant correlation (r = 0.44) was found between age and
GSD (P = 0.0000). Similar correlations, but to a lesser
degree, were found between age and Shock Index (r =
0.1453; P = 0.0008) and between age and temperature (r =
0.1940; P = 0.0000). Therefore, age was excluded from the
predictor variables. A multiple logistic regression model was
applied to the overall 28-day mortality, taking into account
GSD, ISD, Shock Index, respiratory rate, temperature, GCS
score, creatinine and platelet count as predictive variables.
This model allowed us to discard the latter two variables
because they were statistically nonsignificant. For the varia-
bles respiratory rate, temperature, Shock Index and GCS
score, the cutoff points for changes in the probability of death
Critical Care April 2005 Vol 9 No 2 Jaimes et al.
R153
were sought by locally weighted regression. The results are
shown in Table 1.
With the previous values, 12 dummy variables were con-
structed considering the first level (1) as the reference value.
These new variables, in conjunction with the two nominal vari-
ables previously involved (GSD and ISD), were fitted in a new
logistic regression model for prediction of mortality. After divid-
ing and rounding off coefficients to the nearest whole number,
some levels and variables were bound together, namely co-
morbid conditions, GCS score, Shock Index and body temper-
ature. The final meaningful variables are summarized in Table
2 according to their levels and relative weights.
In this way the final scale of severity was a range between 0
and 12. With these data, the score for each patient in the
cohort was calculated, and a model that provides an estimate
of severity, defined as the probability of 28-day mortality, was
obtained. The Hosmer-Lemeshow goodness-of-fit test yielded
a value of 7.54 (P = 0.5807). By ROC curve analysis for dis-
criminative capacity, the area under the curve was 0.7517.
The bootstrapped coefficients for 2000 replications exhibited
standard errors of under 10% of those observed in the model,
and the values for the Hosmer-Lemeshow goodness-of-fit test
and the area under the ROC curve in this set were 8.96 (P =
0.4321) and 0.7119, respectively.
The neural network included all of the independent variables.
Their weight, by the smoothing factor, ranged from 2.65 for
temperature to 0.34 for ISD. The Hosmer-Lemeshow good-
ness-of-fit test yielded a value of 8.03 (P = 0.475), and the
area under the ROC curve was 0.8782. The difference
between ROC curves was statistically significant according to
the Wilcoxon statistic based on pairwise comparisons (P =
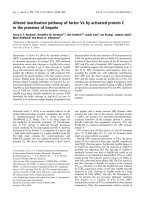
0.037). Figure 1 shows the comparison of observed and pre-
dicted deaths with both methods.
Discussion
The present study shows that it is possible to obtain a simple
indicator of the risk for death under clinical conditions compat-
ible with severe infections. The system uses variables taken
from the initial clinical interview and physical examination, all of
which are available at the moment of admission to the ER. This
suggests that it is possible to develop a reproducible and
transportable predictive instrument in patients with signs
indicative of sepsis. However, the model must be specifically
tested in an independent population with a larger sample size.
The main determinants of mortality reflect two acknowledged
host factors, namely co-morbid conditions and the type of
individual biological response, the latter being determined
from clinical findings such as vital signs and GCS score.
The use of ANNs in the setting of sepsis has not been
explored. However, with regard to overall mortality in ICUs,
two recent studies compared hospital outcome prediction
Table 1
Cutoff points on continuous variables for changes in the probability of death according to locally weighted regression
Variable Cutoff points
123
Respiratory rate (breaths/min) <24 24–33 ≥ 34
GCS score >12 8–12 <8
Temperature (°C) >38 36.6–38 ≤ 36.5
Shock Index <1 1–1.4 ≥ 1.5
GCS, Glasgow Coma Scale.
Table 2
Level of variables and relative weight according to their score
Variable Level of variable Score
GSD or ISD
a
Presence of GSD or ISD 2
Respiratory rate Rate >34 breaths/min 3
Respiratory rate Rate 24–33 breaths/min 1
GCS score Score <12 3
Temperature <38°C 2
Shock Index ≥ 1.5 2
a
See text for definitions of general systemic disease (GSD) and immunosuppressive systemic disease (ISD). GCS, Glasgow Coma Scale.
Available online />R154
using neural networks versus logistic regression [12,13]. Cler-
mont and coworkers [12] designed a prospective cohort study
including 1647 patients admitted to seven ICUs at a tertiary
care centre. The predictor variables considered were age and
the acute physiology variables of the Acute Physiology and
Chronic Health Evaluation (APACHE) III score. They con-
structed logistic regression and ANN models for a random set
of 1200 admissions (development set), and used the remain-
ing 447 admissions as the validation set. Then, model con-
struction was repeated on progressively smaller development
sets (800, 400 and 200 admissions) and re-tested in the orig-
inal validation set. As the size of the development set sample
decreased, the performance of the model on the validation set
deteriorated rapidly, although the ANNs retained marginally
better fit than logistic regression, as measured using the Hos-
mer-Lemeshow test, at 800 admissions. At under 800 admis-
sions, however, the fit was poor with both approaches. The
authors concluded that both ANN and logistic regression have
similar performance with appropriate sample size, and share
the same limitations with development sets on small samples.
Nimgaonkar and coworkers [13] compared the performance
of the APACHE II score with that of a neural network in a med-
ical-neurological ICU at a university hospital in Mumbai, India.
A total of 2062 consecutive admissions between 1996 and
1998 were evaluated. Data from 2962 patients were used to
train the neural network and data from the remaining 1000
patients were used to test the model and compare it with the
APACHE II score. There were 337 deaths in these 1000
patients; APACHE II predicted 246 deaths whereas the neural
network predicted 336 deaths. Calibration, as assessed using
the Hosmer-Lemeshow statistic, was better with the neural
network than with APACHE II score, and so was discrimina-
tion. As probable explanations for this apparent superiority of
the ANN, the authors suggested differences in demographic
characteristics and case-mix of patients in Indian ICUs. These
specific features were certainly not accounted for in the origi-
nal Western cohorts used to develop and validate the
APACHE score.
In our research, both logistic regression and neural network
models did a good job of predicting death. Although there was
a statistically significant difference in discrimination as meas-
ured by ROC curve in favour of the neural network, the clinical
meaning of this difference is not clear. A prediction model can-
not be both perfectly reliable (i.e. calibrated) and perfectly dis-
criminatory. According to Diamond [14], 'A model that
maximizes discrimination does so at the expense of reliability
On the other hand, a model that maximizes reliability does so
at the expense of discrimination, and thereby trades categori-
cal confidence for quantitative meaning.'
One of the advantages of neural network analysis is that there
are few assumptions that must be verified before the models
can be constructed; also, ANNs are able to model complex
nonlinear relationships between independent and dependent
variables, and so they allow the inclusion of a large number of
variables. The comparison method is supposed to constrain
the neural network analysis by limiting the number of potential
predictor variables to the same set of predictor variables used
in the logistic regression analysis. However, in this practical
example, our network was able to use all of the 10 initial varia-
Figure 1
Observed and predicted deaths with logistic regression and neural network in patients with suspected sepsis admitted to the emergency roomObserved and predicted deaths with logistic regression and neural network in patients with suspected sepsis admitted to the emergency room.
There were no patients with scores 11 or 12 in the cohort.
0
0.2
0.4
0.6
0.8
1
1.2
0 (73) 1 (47) 2 (125) 3 (93) 4 (53) 5 (86) 6 (14) 7 (36) 8 (3) 9 (1) 10 (2)
Score (number of patients)
Probability of death
Observed Logistic Model Neural Network
Critical Care April 2005 Vol 9 No 2 Jaimes et al.
R155
bles in its modelling, whereas logistic regression excluded four
variables in the final model. Nevertheless, the predictive ability
was almost the same with both approaches. A limitation of
ANNs in the setting of aetiological research is that standard-
ized coefficients and/or odds ratios corresponding to each
variable cannot be calculated and presented as they can in
regression models. This lack of interpretability at the level of
individual predictors is one of the most criticized features of
neural network models [15]. Furthermore, neural network
models require sophisticated software, and the computer
resources involved in training and testing neural networks can
be substantial.
Our work has some limitations. First, the sample size – specif-
ically the number of outcomes (101 deaths) – limit the number
of potential predictor variables. As a rule of thumb, no more
that 10 outcome events for each independent variable are per-
missible if over-fitting or under-fitting problems are to be
avoided [16]. We tried to overcome this limitation by consid-
ering just those variables that are more likely to be related to
mortality from a clinical point of view. However, as is usual in
any observational study, residual confounding or unmeasured
factors may compromise the scope or precision of the model.
Second, external validity was tested neither for logistic regres-
sion nor for the ANN. Furthermore, the small sample size pre-
vented a comprehensive split-sample validation with any
strategy. Determination of the applicability and usefulness of
any predictive model requires independent and external valida-
tion in a population that is intrinsically different from the devel-
opment sample [17]. Therefore, both the proposed score and
the neural network merit a new cohort study before any poten-
tial clinical use can be considered.
Conclusion
A predictive model would be an extremely useful tool in the
setting of suspected sepsis in the ER. It could serve both as a
guideline in medical decision-making regarding ICU admission
or specific therapies, and as a simple way to select or stratify
patients for clinical research. Our proposed model and the
specific development method – either logistic regression or
neural networks – must be evaluated and validated in an inde-
pendent population. Further research is required to determine
whether there are practical or clinical advantages to one
approach over the other. As a general concept, we agree with
Tu [15] that logistic regression remains the best choice when
the primary goal of model development is to examine possible
causal relationships among variables, but that some form of
hybrid technique incorporating the best features of both
approaches might lead to the development of optimal predic-
tion models.
Competing interests
The author(s) declare that they have no competing interests.
Authors' contributions
FJ conceived the study, participated in its design and coordi-
nation, performed the statistical analysis for logistic regres-
sion, and drafted the manuscript. CM participated in the
design and coordination of the study, and contributed to the
statistical analysis. JF and DA participated in the design of the
study and performed the procedures for the neural network
analysis. All authors read and approved the final manuscript.
Acknowledgements
We are indebted to the staff of emergency services at Hospital Univer-
sitario San Vicente de Paul and Hospital General de Medellín for their
collaboration. We appreciated helpful suggestions from three anony-
mous referees. The research was partially supported by a grant 'Comité
para el desarrollo de la Investigacion (CODI) – Universidad de
Antioquia'.
References
1. Martin GS, Mannino DM, Eaton S, Moss M: The epidemiology of
sepsis in the United Sates from 1979 through 2000. N Engl J
Med 2003, 348:1546-1554.
2. Moss M, Martin GS: A global perspective on the epidemiology
of sepsis. Intensive Care Med 2004, 30:527-529.
3. American College of Chest Physicians/Society of Critical Care
Medicine Consensus Conference: Definitions for sepsis and
organ failure and guidelines for the use of innovative thera-
pies in sepsis. Crit Care Med 1992, 20:864-874.
4. Rangel-Frausto S, Pittet D, Costignan M, Hwang T, Davis CS,
Wenzel RP: The natural history of the systemic inflammatory
response syndrome. JAMA 1995, 273:117-123.
5. Gabutti L, Burnier M, Mombelli G, Male F, Pellegrini L, Marone C:
Usefulness of artificial neural networks to predict follow-up
dietary protein intake in hemodialysis patients. Kidney Int
2004, 66:399-407.
6. Maiellaro PA, Cozzolongo R, Marino P: Artificial neural networks
for the prediction of response to interferon plus ribavirin treat-
ment in patients with chronic hepatitis C. Curr Pharm Des
2004, 10:2101-2109.
7. Lim WK, Er MJ: Classification of mammographic masses using
generalized dynamic fuzzy neural networks. Med Phys 2004,
31:1288-1295.
8. Loukas C, Brown P: Online prediction of self-paced hand-
movements from subthalamic activity using neural networks
in Parkinson's disease. J Neurosci Methods 2004,
137:193-205.
9. Jaimes F, Garcés J, Cuervo J, Ramírez F, Ramírez J, Quintero C,
Vargas A, Zapata L, Ochoa J, Yepes M, et al.: Prognostic factors
in systemic inflammatory response syndrome (SIRS). Devel-
opment of a severity index [in Spanish]. Acta Medica
Colombiana 2001, 26:149-157.
10. Loader C: Local Regression and Likelihood New York: Springer-
Verlag; 1999.
Key messages
- Simple clinical variables were useful in predicting death in
patients with suspected sepsis in the ER.
- Logistic regression and ANNs were equivalent in terms of
predictive ability.
- Discriminative ability, as measured using ROC curve anal-
ysis, was better with the ANN.
- Further research is required to validate the model and to
determine whether there are practical or clinical advan-
tages to one approach over the other.
Available online />R156
11. Hanley JA, McNeil BJ: The meaning and use of the area under
a receiver operating charasteristic (ROC) curve. Radiology
1982, 143:29-36.
12. Clermont G, Angus D, DiRusso S, Griffin M, Linde-Zwirble W: Pre-
dicting hospital mortality for patients in the intensive care unit:
a comparison of artificial neural networks with logistic regres-
sion models. Crit Care Med 2001, 29:291-296.
13. Nimgaonkar A, Karnad D, Sudarshan S, Ohno-Machado L, Kohane
I: Prediction of mortality in an Indian intensive care unit. Com-
parison between APACHE II and artificial neural networks.
Intensive Care Med 2004, 30:248-253.
14. Diamond G: What price perfection? Calibration and discrimina-
tion of clinical prediction models. J Clin Epidemiol 1992,
45:85-89.
15. Tu J: Advantages and disadvantages of using artificial neural
networks versus logistic regression for predicting medical
outcomes. J Clin Epidemiol 1996, 49:1225-1231.
16. Concato J, Feinstein AR, Holford TR: The risk of determining risk
with multivariable models. Ann Intern Med 1993, 118:201-210.
17. Justice AC, Covinsky KE, Berlin JA: Assessing the generalizabil-
ity of prognostic information. Ann Intern Med 1999,
130:515-524.