Báo cáo khoa học: "Respiratory compliance but not gas exchange correlates with changes in lung aeration after a recruitment maneuver: an experimental study in pigs with saline lavage lung injury" pptx
Bạn đang xem bản rút gọn của tài liệu. Xem và tải ngay bản đầy đủ của tài liệu tại đây (1.01 MB, 12 trang )
Open Access
Available online />R471
Vol 9 No 5
Research
Respiratory compliance but not gas exchange correlates with
changes in lung aeration after a recruitment maneuver: an
experimental study in pigs with saline lavage lung injury
Dietrich Henzler
1
, Paolo Pelosi
2
, Rolf Dembinski
3
, Annette Ullmann
4
, Andreas H Mahnken
5
,
Rolf Rossaint
6
and Ralf Kuhlen
7
1
Senior Anesthesiologist, Anesthesiology Department, University Hospital RWTH Aachen, Germany
2
Professor of Anesthesiology, Environment, Health and Safety Department, University of Insubria, Varese, Italy
3
Intensivist, Surgical Intensive Care Department, University Hospital RWTH Aachen, Germany
4
Resident, Anesthesiology Department, University Hospital RWTH Aachen, Germany
5
Department of Clinical Radiology, University Hospital RWTH Aachen, Germany
6
Professor of Anesthesiology, Anesthesiology Department, University Hospital RWTH Aachen, Germany
7
Head, Surgical Intensive Care Department, University Hospital RWTH Aachen, Germany
Corresponding author: Dietrich Henzler,
Received: 8 May 2005 Revisions requested: 27 May 2005 Revisions received: 10 Jun 2005 Accepted: 24 Jun 2005 Published: 13 Jul 2005
Critical Care 2005, 9:R471-R482 (DOI 10.1186/cc3772)
This article is online at: />© 2005 Henzler et al., licensee BioMed Central Ltd.
This is an Open Access article distributed under the terms of the Creative Commons Attribution License ( />2.0), which permits unrestricted use, distribution, and reproduction in any medium, provided the original work is cited.
Abstract
Introduction Atelectasis is a common finding in acute lung
injury, leading to increased shunt and hypoxemia. Current
treatment strategies aim to recruit alveoli for gas exchange.
Improvement in oxygenation is commonly used to detect
recruitment, although the assumption that gas exchange
parameters adequately represent the mechanical process of
alveolar opening has not been proven so far. The aim of this
study was to investigate whether commonly used measures of
lung mechanics better detect lung tissue collapse and changes
in lung aeration after a recruitment maneuver as compared to
measures of gas exchange
Methods In eight anesthetized and mechanically ventilated pigs,
acute lung injury was induced by saline lavage and a recruitment
maneuver was performed by inflating the lungs three times with
a pressure of 45 cmH
2
O for 40 s with a constant positive end-
expiratory pressure of 10 cmH
2
O. The association of gas
exchange and lung mechanics parameters with the amount and
the changes in aerated and nonaerated lung volumes induced
by this specific recruitment maneuver was investigated by multi
slice CT scan analysis of the whole lung.
Results Nonaerated lung correlated with shunt fraction (r =
0.68) and respiratory system compliance (r = 0.59). The arterial
partial oxygen pressure (PaO
2
) and the respiratory system
compliance correlated with poorly aerated lung volume (r = 0.57
and 0.72, respectively). The recruitment maneuver caused a
decrease in nonaerated lung volume, an increase in normally and
poorly aerated lung, but no change in the distribution of a tidal
breath to differently aerated lung volumes. The fractional
changes in PaO
2
, arterial partial carbon dioxide pressure
(PaCO
2
) and venous admixture after the recruitment maneuver
did not correlate with the changes in lung volumes. Alveolar
recruitment correlated only with changes in the plateau pressure
(r = 0.89), respiratory system compliance (r = 0.82) and
parameters obtained from the pressure-volume curve.
Conclusion A recruitment maneuver by repeatedly
hyperinflating the lungs led to an increase of poorly aerated and
a decrease of nonaerated lung mainly. Changes in aerated and
nonaerated lung volumes were adequately represented by
respiratory compliance but not by changes in oxygenation or
shunt.
ARDS = acute respiratory distress syndrome; C
INF
= maximum inflation compliance; C
RS
= compliance of the respiratory system; CT = computer
tomography; E = elastance; FiO
2
= fraction of inspired oxygen; HU = Hounsfield unit; LIP = lower inflection point; PaO
2
= arterial partial oxygen pres-
sure; PEEP = positive end-expiratory pressure; PV-curve = (respiratory system) pressure volume curve; Q
VA
/Q
T
= venous admixture (according to
Berggren's formula); RM = recruitment maneuver 45 cmH
2
O/40 s; = ventilation-perfusion distribution; V
D
/V
T
= physiological dead space
(according to Bohr/Enghoff's formula); V
GAS
= intrathoracic gas volume; V
HYP
= volume of hyperinflated lung parenchyma; V
NON
= volume of nonaer-
ated lung parenchyma; V
NORM
= volume of normally aerated lung parenchyma; V
POOR
= volume of poorly aerated lung parenchyma; V
REC
= recruitable
volume at end-expiration; V
TISS
= intrathoracic tissue volume.
V/Q
A
Critical Care Vol 9 No 5 Henzler et al.
R472
Introduction
Severe impairment of oxygenation in acute lung injury and in
the acute respiratory distress syndrome (ARDS) is caused by
an inhomogenous ventilation-perfusion distribution ( )
and an increase in shunt fraction. The amount of aerated lung
is markedly reduced due to alveolar collapse and flooding
[1,2]. Mechanical ventilation has been shown to further aggra-
vate the mismatch [3]. Even though it is unclear if the
optimal treatment should aim to improve gas exchange, to pre-
vent additional lung damage or to resolve the existing damage,
one of the commonly used treatment concepts is the open-
lung approach [4], aiming at recruitment and maintenance of
ventilated lung volume. In general, recruitment means to trans-
form nonaerated into aerated lung. These regions can open
and close or can be kept opened if sufficient positive endexpir-
atory pressure (PEEP) is applied. Significant controversy
exists over the optimal method to achieve alveolar recruitment
and to the definition of recruitment, whether it means re-open-
ing of collapsed alveoli or edema clearance [2]. Improvement
in oxygenation is commonly used to detect recruitment,
although gas exchange is also influenced by many other fac-
tors, like ventilation-perfusion distribution, pulmonary blood
flow and regional vascular regulation [5,6]. The assumption
that the gas exchange parameters adequately represent the
mechanical process of alveolar opening has not been proven
so far. The best available technique to detect recruitment is
computed lung tomography [7] where the decrease of atelec-
tatic lung can be visualized [8]. Since computer tomographic
(CT) scanning cannot be performed repeatedly under clinical
conditions, different parameters must be obtained at the bed-
side in order to indicate successful recruitment. The aim of this
study was to investigate whether commonly used measures of
lung mechanics better detect lung tissue collapse and
changes in lung aeration after a recruitment maneuver as com-
pared to measures of gas exchange.
Materials and methods
After governmental approval, eight anesthetized female pigs
(31.3 ± 1.9 kg) were orotracheally intubated and ventilated in
constant flow mode with a fraction of inspired oxygen (FiO
2
) of
1.0, a tidal volume of 8 ml/kg with an inspiratory-expiratory (I:E)
ratio of 1:1 and PEEP of 10 cmH
2
O throughout the study.
Deep anesthesia was maintained with a continuous infusion of
propofol (7.7 ± 1.7 mgkg
-1
h
-1
) and fentanyl (8.0 ± 2.2 µgkg
-1
h
-
1
) and animals were additionally paralyzed with pancuronium
(0.3 ± 0.1 mgkg
-1
h
-1
) for the actual experimental phase. Han-
dling of animals conferred to the guidelines laid out in the
Guide for the Care and Use of Laboratory Animals [9].
Arterial and pulmonary artery catheters (Becten Dickinson,
Heidelberg, Germany) were placed and cardiac output was
determined through thermodilution with equipment from
Datex-Ohmeda (Duisburg, Germany). The extravascular lung
water index was determined by transcardiopulmonary ther-
modilution with equipment from Pulsion (Munich, Germany).
Gas flow and airway pressures were measured at the proximal
end of the tracheal tube. The esophageal pressure was meas-
ured using a balloon catheter (International Medical, c/o Alle-
giance, Kleve, Germany). Expiratory volumes were corrected
as described previously [10]. A more detailed description can
be found in Additional file 1.
Experimental protocol
Acute lung injury was induced through repeated lung lavage
as described previously [11] and allowed to stabilize until the
arterial blood partial oxygen pressure (PaO
2
) had been below
100 mmHg for 60 minutes. The following measurements were
obtained before and 10 minutes after a recruitment maneuver
was performed.
Lung volumes
Contiguous multi-slice CT scans of the whole lung (Siemens
Sensation 16, Forchheim, Germany) were taken at end-expir-
atory and end-inspiratory occlusion [1,12]. From the recon-
structed slices (2 mm) the lung was delineated by hand from
the inner pleura. The calculations for hyperinflated paren-
chyma (HYP; -1000 to -900 Hounsfield units (HU)), normally
aerated (NORM; -900 to -500 HU), poorly aerated (POOR; -
500 to -100 HU) and non-aereated parenchyma (NON; -100
to +100 HU) were done by the CT software with a pixel size
of 0.59 mm. The resulting areas were multiplied with the slice
thickness and then added together for lung volumes (V
TOT
,
V
HYP
, V
NORM
, V
POOR
, V
NON
). The intrathoracic gas volume was
calculated as V
GAS
= V
TOT
× HU
MEAN
/-1000 and the intratho-
racic tissue volume was calculated as V
TISS
= V
TOT
- V
GAS
. The
lung volumes consisted of V
GAS
+ V
TISS
, for example, a mean
HU of -500 representing 50% gas and 50% tissue. Recruit-
ment was defined as a decrease in the nonaerated lung vol-
ume after the recruitment maneuver [13].
Venous admixture and dead space
Arterial and mixed venous blood samples were collected
simultaneously and analyzed immediately using equipment by
Radiometer, Copenhagen, Denmark. Venous admixture (Q
VA
/
Q
T
) was calculated using the shunt equation [14] and dead
space (V
D
/V
T
) according to the modified Bohr equation.
Compliance of the respiratory system
The static compliance of the respiratory system (C
RS
) was
computed using the occlusion technique [15].
Inflation compliance and recruitable volume
An inflation-deflation pulmonary pressure-volume curve (PV-
curve) starting from zero end-expiratory pressure (ZEEP) was
V/Q
A
V/Q
A
Available online />R473
performed using a new tool that was built into the ventilator
(Galileo Gold, Hamilton, Rhäzüns, Switzerland). Objective
analysis of inflation and deflation curves was performed by fit-
ting it to the Venegas-Harris equation [16]. The corner points
stating the point of maximum compliance increase and
decrease, being the mathematical equivalents of lower and
upper inflection points, were calculated. The maximum infla-
tion compliance (C
INF
) was calculated through numerical dif-
ferentiation of the true inflection point. The recruitable volume
(V
REC
) was defined as the end-expiratory volume difference
between the inflation and deflation pressure obtained at PEEP
level (10 cmH
2
O).
The actual recruitment maneuver was performed by inflating
the lungs three times with a pressure of 45 cmH
2
O for 40 s
[8,17-19], with 10 normal tidal breaths between inflations. A
detailed description of animal preparation and measurements
can be found in Additional file 1. After the experiment, the ani-
mals were killed with a barbiturate overdose.
Statistical analysis
All data are reported as mean ± SD. To correlate the parame-
ters under investigation with the CT measurements, the Pear-
son's coefficient (r) was calculated. Where appropriate,
multiple linear regression was used. The validity of the model
was verified by a Durbin-Watson statistic. Because correla-
tions of parameters with end-inspiratory or end-expiratory CT
measurements exhibited equal results, only the end-expiratory
data are presented. To determine the parameter with the
strongest influence, the dimensionless standardized beta
coefficient (beta
S
) was calculated. Pre- and post-recruitment
maneuver (RM) values were compared using Wilcoxon's
signed ranks test. In the case of parameters exhibiting a signif-
icant difference, the dimensionless fractional change for any
parameter 'X' was then calculated as fractional change (X) =
X
postRM
/X
preRM
- 1 and correlation analysis performed as
explained above. Fractional change values are expressed as
percentages. Statistical significance was accepted at p <
0.05 (SPSS 11.0, SPSS, Chicago, USA).
Results
Correlation of the CT data with gas exchange and
respiratory mechanics parameters before and after a
recruitment maneuver
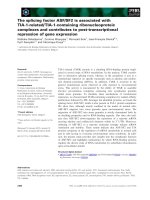
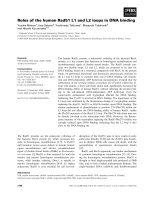
Parameters correlating with aerated lung
No significant correlations were found between the gas
exchange or respiratory mechanics parameters and normally
aerated lung volume. Instead, a significant correlation was
observed between poorly aerated lung volume and the PaO
2
(r = 0.569, p = 0.022) (Fig. 1c) and also between V
POOR
and
respiratory system compliance (r = 0.719, p = 0.006) (Fig. 1a)
and the inflation pressure maximum compliance increase (r =
0.655, p = 0.008).
Parameters correlating with nonaerated lung
Venous admixture correlated directly with nonaerated lung vol-
ume (r = 0.678, p = 0.004) (Fig. 1d), but the PaO
2
did not (p
= 0.098). Similarly, nonaerated lung volume correlated with
physiologic dead space (r = 0.534, p = 0.04), but not with the
arterial blood partial carbon dioxide pressure (PaCO
2
; p =
0.154). Of the respiratory mechanics parameters, the respira-
tory system compliance (r = -0.587, p = 0.035) and the infla-
tion point of maximum compliance decrease (r = -0.77, p =
0.001) correlated with the nonaerated lung volume (Fig. 1b).
Multiple regression analysis revealed that the best prediction
of nonaerated volume was achieved by a combination of infla-
tion point of maximum compliance decrease (beta
S
= -0.563)
and venous admixture (beta
S
= 0.45).
Effects of the recruitment maneuver
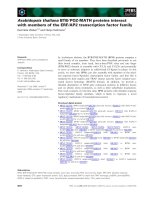
CT lung volume measurements
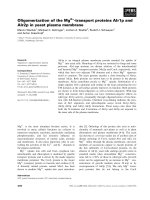
Atelectasis and consolidation were found predominately in the
dependent two-thirds of the lung (Fig. 2). The recruitment
maneuver caused a significant decrease in nonaerated lung
volume by approximately 22% (Table 1). It is important to note
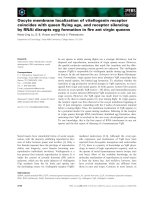
that the recruitment was associated with an increase in poorly
aerated and normally aerated lung volume. The individual
changes in CT lung volumes are shown in Fig. 3. The increase
of V
POOR
(21.7%, beta
S
= 0.668) contributed more to recruit-
ment than the increase of V
NORM
(11%, beta
S
= 0.641).
The 13% increase in V
GAS
represents an increase in the func-
tional residual capacity, because the inspiratory-expiratory vol-
ume difference did not change (211 ± 33 ml pre-RM versus
221 ± 45 ml post-RM, p = 0.46). No differences in tidal vol-
umes were found between the measurement with CT and
spirometry. Importantly, the inspiratory-expiratory volume
change in nonaereated regions (62 ± 18 ml), representing
opening and collapse of alveoli, was not significantly reduced
after the recruitment maneuver (43 ± 26 ml, p = 0.114). The
fractional change (V
GAS
), however, was not correlated with
any parameter of gas exchange or respiratory mechanics; it
only correlated with fractional change (V
NORM
), which could be
expected from recruitment.
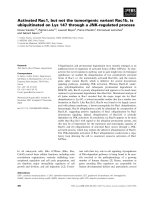
Effects on gas exchange
The distributions of the fractional changes of the parameters
under investigation can be seen in Fig. 4. Overall, a significant
improvement in oxygenation (fractional change (PaO
2
),
+33%) and a shunt reduction (fractional change (Q
VA
/Q
T
), -
20.8%) were observed (Table 2). The fractional change
(PaO
2
) did not correlate well with the increase of normally or
poorly aerated lung (r = 0.51, p = 0.18), however, nor did the
fractional change (Q
VA
/Q
T
) correlate with the decrease of non-
aerated lung (r = 0.50, p = 0.21) (Fig. 5a,b). No significant
changes in PaCO
2
nor dead space were observed. From
these data it seems that the changes in gas exchange param-
eters do not correlate with the changes in aerated or nonaer-
ated volumes caused by a recruitment maneuver.
Critical Care Vol 9 No 5 Henzler et al.
R474
Effects on respiratory mechanics
In accordance with the CT-measurements, there were no
changes in tidal volume, but peak and plateau pressures did
decrease (Table 3), which correlated with the fractional
change (V
NON
) (Fig. 5c). There was a significant increase in
compliance and recruitable volume. The increase in C
RS
corre-
Figure 1
Correlation of expiratory multi-slice CT lung volumes with respiratory mechanics and gas exchange parametersCorrelation of expiratory multi-slice CT lung volumes with respiratory mechanics and gas exchange parameters. CRS, static compliance of respira-
tory system; PaO
2
, arterial partial oxygen pressure; P
mcd
, pressure of maximum compliance decrease on inflation curve; Q
VA
/Q
T
, venous admixture;
V
NON
, nonaerated lung volume; V
POOR
, poorly aerated lung volume.
700.0500.0300.0
40.0
30.0
20.0
10.0
CRS (ml/cmH
2
O)
400.0300.0200.0100.0
80.0
70.0
60.0
50.0
40.0
30.0
20.0
P
mcd
inflation (cmH
2
O)
r = 0.655
P = 0.008
(a) (b)
(c) (d)
800.0600.0400.0200.0
140.0
120.0
100.0
80.0
60.0
40.0
V
POOR
(ml)
PaO
2
(mmHg)
400.0300.0200.0100.0
70.0
60.0
50.0
40.0
30.0
20.0
V
NON
(ml)
Q
VA
/Q
T
r = 0.678
P = 0.004
r = 0.569
P = 0.02
r = 0.72
P = 0.006
V
POOR
(ml)
V
NON
(ml)
Available online />R475
lated positively with the increase in poorly aerated lung (r =
0,822, p = 0.012) and inversely with the decrease in nonaer-
ated lung volumes (r = -0.721, p = 0.043). The decrease of
nonaerated lung volume could be predicted from the equation
fractional change (V
NON
) = -0.69 × fractional change (C
RS
).
This means the decrease of atelectasis can be estimated to be
roughly two-thirds of the increase in C
RS
. Interestingly, we
Figure 2
Representative CT scan of one animal at three different levels (apical, middle, basal)Representative CT scan of one animal at three different levels (apical, middle, basal). (a) Expiratory occlusion (10 cmH2O) before and after the
recruitment maneuver. Lung volumes in this animal changed as follows: V
HYP
+1%, V
NORM
+15%, V
POOR
+17%, V
NON
-30%, V
GAS
+11%. (b) Inspir-
atory occlusion at plateau pressure before and after the recruitment maneuver. Lung volumes in this animal changed as follows: V
HYP
+6%, V
NORM
+17%, V
POOR
+26%, V
NON
-29%, V
GAS
+17%. V
GAS
, intrathoracic gas volume; V
HYP
, volume of hyperinflated lung parenchyma; V
NON
, volume of non-
aerated lung parenchyma; V
NORM
, volume of normally aerated lung parenchyma; V
POOR
, volume of poorly aerated lung parenchyma.
pre-recruitment maneuver
post-recruitment maneuver
post-recruitment maneuver
pre-recruitment maneuver
(a)
(b)
Critical Care Vol 9 No 5 Henzler et al.
R476
found no significant correlations with normally aerated lung
volume.
After the recruitment maneuver, the PV-curve was expanded
vertically (see Additional file 1; Fig. 4). The resultant increase
in the inflational point of maximum compliance increase corre-
lated with the increase in the sum of V
NORM
and V
POOR
(r =
0.914) (Fig. 5d). The fractional changes of V
REC
correlated
positively with an increase in V
POOR
(r = 0.863, p = 0.034) and
also inversely with a decrease in V
NON
(r = -0.775 (p = 0.041).
Effects on hemodynamics
With no changes in sedation and fluid management, only heart
rate and cardiac output decreased after the recruitment
maneuver. However, no changes in systemic or pulmonary
pressures nor vascular resistance could be observed. The
extravascular lung water index indicated massive pulmonary
edema, but did not change after the recruitment maneuver
either (see Additional file 1; Table 2).
In summary, changes in compliance of the respiratory system
but not in gas exchange parameters correlated with changes
in nonaerated and aerated lung before and after a recruitment
maneuver at the same PEEP level of 10 cmH
2
O.
Discussion
Experimental considerations
We investigated parameters used to indicate the amount and
the change of aerated and nonaerated lung in acute lung
injury. We chose the lavage model in pigs for this because it is
known to be easily recruitable. This model has been shown to
cause lung inflammation [20], ventilation-perfusion mismatch
equal to other models [21] and an increase in extravascular
lung water and excess tissue [22]. Furthermore, the preferen-
tial distribution of atelectasis to the dependent lung could also
be demonstrated in patients with ARDS by use of CT scanning
[12]. The number of experiments is in line with recent studies
investigating respiratory mechanics in acute lung injury
[23,24]. Increasing the power may have resulted in more sub-
tle correlations, although we have found some correlations to
be significant (certain effect) and others not (possible effect).
Our definition of recruitment may be questioned, because
what we measured really is a density scale proportional to gas-
tissue distributions. Thus, the decrease in a portion of HU
labeled 'atelectasis' does not necessarily mean opening of
alveoli. Instead, edema fluid could be squeezed out of the lung
and pushed into poorly aerated lung; however, we did not find
changes in extravascular lung water [22] or lung tissue after
the recruitment maneuver. Therefore, the observed changes in
differently aerated lung volumes could have been caused by
Table 1
Lung volumes measured by multi-slice computer tomography
Pre-recruitment maneuver Post-recruitment maneuver P-value fractional change (%)
Expiration
V
HYP
(ml) 60 ± 21 67 ± 28 0.025 11.2 ± 10
V
NORM
(ml) 577 ± 142 649 ± 206 0.036 11.0 ± 12
V
POOR
(ml) 406 ± 83 493 ± 112 0.017 21.7 ± 18
V
NON
(ml) 357 ± 53 275 ± 72 0.012 -23.3 ± 15
V
TOT
(ml) 1401 ± 136 1483 ± 175 0.025 5.8 ± 5
V
GAS
(ml) 629 ± 83 711 ± 133 0.012 13.1 ± 10
V
TISS
(ml) 838 ± 62 832 ± 60 0.263 -
Inspiration
V
HYP
(ml) 109 ± 38 115 ± 42 0.093 -
V
NORM
(ml) 789 ± 140 889 ± 197 0.012 12.4 ± 12
V
POOR
(ml) 397 ± 94 478 ± 124 0.017 20.9 ± 18
V
NON
(ml) 295 ± 54 232 ± 75 0.012 -22.3 ± 16
V
TOT
(ml) 1589 ± 139 1713 ± 150 0.012 7.9 ± 5
V
GAS
(ml) 838 ± 84 939 ± 128 0.012 12.5 ± 8
V
TISS
(ml) 819 ± 56 838 ± 64 0.263 -
Data are reported as mean ± SD. V
GAS
, total lung gas volume; V
HYP
, hyperinflated lung volume; V
NON
, non-aereated lung volume; V
NORM
, normally
aereated lung volume; V
POOR
, poorly aerated lung volume; V
TISS
, total lung tissue volume; V
TOT
, total lung volume.
Available online />R477
Figure 3
Distribution of differently aerated lung volumesDistribution of differently aerated lung volumes. Individual curves for eight animals before (solid line) and after (dashed line) a recruitment maneuver.
Multi-slice CT of the whole lung with characterization of lung parenchyma according to Hounsfield units at end-expiration. V
HYP
, volume of hyperin-
flated lung parenchyma; V
NON
, volume of nonaerated lung parenchyma; V
NORM
, volume of normally aerated lung parenchyma; V
POOR
, volume of
poorly aerated lung parenchyma.
V
HYP
V
NORM
V
POOR
V
NON
V
HYP
V
NORM
V
POOR
V
NON
-1000 HU +100 -1000 HU +100
V(ml)
200
200
200
200
V (ml)
V(ml)
V (ml)
V(ml)
V (ml)
V(ml)
V (ml)
Critical Care Vol 9 No 5 Henzler et al.
R478
transformation of completely collapsed lung into partly opened
lung or by an increased homogeneity in the distribution of
alveolar fluid [25]. Importantly, the observed changes in aer-
ated lung volume were relatively small 10 minutes after the
recruitment maneuver and do not support the usefulness of
such a maneuver, which has also been demonstrated in clini-
cal studies [26]. Possibly higher levels of PEEP could have
enhanced recruitment, but to avoid possible influences of
PEEP on the physiological parameters studied we maintained
the same level of PEEP (10 cmH
2
O).
Evaluation of gas exchange parameters
Although impaired oxygenation is the main symptom in acute
lung injury [27] correlated with atelectasis [28,29], our study
suggests that PaO
2
is less related to the amount of atelectatic
lung than to the aerated lung that remains for ventilation. These
studies suggested that there was a linear correlation between
PaO
2
or shunt and atelectasis formation, especially if
atelectasis was below 5% of total lung [28]. Lung healthy sub-
jects were studied, however, and only one slice of the lung
close to the diaphragm was analyzed, representing the area
where most atelectases occur. So atelectasis as a fraction of
the whole lung was probably much lower. Furthermore, there
seems to be a difference in the characteristic of atelectasis
formation between otherwise healthy lungs and injured lungs
with high proportions of instable alveolar units that are poorly
ventilated. Poorly aerated lung has been considered as low
regions. Because we found a correlation between the
PaO
2
and poorly aerated lung, it is possible that the regional
blood flow through these regions was considerably high.
Therefore, intrapulmonary shunt does not only happen in
totally collapsed, but also in low , units. What the clini-
cian wants to know is whether a certain improvement in oxy-
genation can predict the amount of recruitment. Improvements
Table 2
Gas exchange and hemodynamics parameters
Pre-recruitment maneuver Post-recruitment maneuver P-value fractional change (%)
PaO
2
(mmHg) 71 ± 21 94 ± 28 0.017 33.0 ± 23
PaCO
2
(mmHg) 81 ± 20 81 ± 19 0.575 -
PvO
2
(mmHg) 45 ± 10 49 ± 10 0.093 -
Q
VA
/Q
T
(%) 50.2 ± 9.9 39.3 ± 8.6 0.036 -20.8 ± 16
V
D
/V
T
(%) 84 ± 2.9 83.7 ± 3.4 0.31 -
HR (min
-1
) 85 ± 84 77 ± 21 0.025 -11.3 ± 9
MAP (mmHg) 80 ± 15 83 ± 24 0.498 -
Q
T
(l min
-1
) 3.7 ± 0.2 3.4 ± 0.2 0.018 -9.6 ± 6
VO
2
(ml min
-1
) 138 ± 39 141 ± 35 0.889 -
DO
2
(ml min
-1
) 401 ± 118 412 ± 101 0.575 -
EVLWI (ml kg
-1
) 20.6 ± 7.9 21.1 ± 9.6 0.499 -
Data are reported as mean ± SD. DO
2
, oxygen delivery; EVLWI, extravascular lung water index; HR, heart rate; MAP, mean arterial pressure;
PaCO
2
, arterial carbon dioxide partial pressure; PaO
2
, arterial partial oxygen pressure; , mixed venous partial oxygen pressure; Q
T
, cardiac
output; Q
VA
/Q
T
, venous admixture; V
D
/V
T
, dead space fraction; VO
2
, oxygen consumption.
PvO
2
Figure 4
Fractional changes in investigated parameters (means with confidence intervals)Fractional changes in investigated parameters (means with confidence
intervals). Cinf, maximum inflation compliance; Crs, static compliance of
respiratory system; PaO
2
, arterial partial oxygen pressure; Pplat, pla-
teau pressure; Q
VA
/Q
T
, venous admixture; V
NON
, nonaerated lung vol-
ume; V
NORM
, normally aerated lung volume; V
POOR
, poorly aerated lung
volume; Vrec, recruitable volume at PEEP.
Fractional change (%)
–40 –20 0 20 40 60 80 100
Vnon
Vpoor
Vnorm
Qva/Qt
PaO2
Vrec
Cinf
Crs
Pplat
V/Q
A
V/Q
A
Available online />R479
in gas exchange after recruitment are attributed mainly to two
basic mechanisms: first, by redirection of blood flow from non-
aerated to aerated lung regions and reduction of venous
admixture, which we observed; and second, which we did not
observe, through an increase in alveolar ventilation, leading to
a reduction in PaCO
2
. In several clinical studies that have
Figure 5
Correlation of the fractional changes (FC; %) of parameters with multi-slice CT lung volumesCorrelation of the fractional changes (FC; %) of parameters with multi-slice CT lung volumes. Regression lines with 95% individual confidence inter-
vals.(a) Insignificant correlation of arterial partial oxygen pressure (PaO
2
) with nonaerated lung. Note the large confidence intervals. (b) Insignificant
correlation of venous admixture (Q
VA
/Q
T
) with nonaerated lung. (c) Close relation between changes in plateau pressure (P
PLAT
) and poorly aerated
lung. (d) Pressure of maximum compliance increase on inflation curve (Pmci) correlates non-linearly with aerated volume (volume of normally aerated
lung parenchyma (V
NORM
) + volume of poorly aerated lung parenchyma (V
POOR
)). Note the sharp increase of Pmci beyond 20% increase in aerated
lung volume.
-60 -40 -20 0 20 40 60 80
FC(Vnon) (%)
-60
-40
-20
0
20
40
60
80
FC(PaO2) (%)
r =–0.597
P =0.118
-60 -40 -20 0 20 40 60 80
-60
-40
-20
0
20
40
60
80
F
C
(Qva/Qt) (%)
r = 0.497
P = 0.211
-60 -40 -20 0 20 40 60 80
-60
-40
-20
0
20
40
60
80
r =0.945
P <0.001
010203040
-200
0
200
400
600
FC (Pmci,inf) (%)
FC(Vnon) (%)
FC(Vpoor) (%)
FC(Vnorm+Vpoor) (%)
F
C
(Pplat) (%)
(a) (b)
(c) (d)
Critical Care Vol 9 No 5 Henzler et al.
R480
failed to demonstrate a benefit for active recruitment
[26,30,31], oxygenation parameters, but not mechanical
parameters, were used for decision making. Because we
could not find the PaO
2
changes representative of recruitment,
even in a very recruitable model, this could have important
implications on the interpretation of these studies. It seems
that the amount of oxygenation improvement is not so much
determined by the reduction of nonaerated lung, but by the
blood flow through these regions.
Evaluation of respiratory mechanics parameters
The plateau pressure and static lung compliance correlated
equally with nonaerated and poorly aerated lung volumes. It
appears that in lung injury, V
POOR
and V
NON
are the main deter-
minants in overall lung compliance. Following the argument of
Barnas et al. [32] that the elastance (E) of the rib cage com-
partment is parallel to the elastance of the diaphragm-abdo-
men compartment, the elastances of the differently aerated
lung compartments could behave similarly and thus be
described by the equation 1/E
LUNG
= k
1
/E
HYP
+ k
2
/E
NORM
+ k
3
/
E
POOR
+ k
4
/E
NON
, where the constants k
1–4
depend on their
fraction of total lung volume. Thus in healthy lungs, E
L
is mainly
dependent on E
NORM
, because it has the highest fraction of
lung volume. But with increasing fractions of E
POOR
and E
NON
(with much higher values than E
NORM
) they will become
increasingly determinant for lung compliance. This hypothesis
is supported by multiple regression analysis, showing that the
fractional change of C
INF
was most dependent on V
POOR
(beta
S
0.550) and V
NON
(beta
S
-0.331).
The PV-curve has been used to obtain information about dis-
eased lungs [33-36]. Although the calculated curve may not
equally fit all data [37], the mathematical analysis of the PV-
curve is objective and the best available algorithm so far [38].
Because the PV-curve characteristics reflect a dynamic
investigation of the lung, they have been used to set the
parameters of ventilation [39]. We did not investigate whether
the point of maximum compliance increase really reflects the
lower inflection point (LIP). We were surprised that the infla-
tion point of maximum compliance increase actually increased
after recruitment in a nonlinear way (Fig. 5d), with a sharp
increase beyond an increase in aerated lung >20%. If the
point of maximum compliance increase truly represented the
commencement of alveolar recruitment, it should be lower in
conditions with less atelectasis. An explanation for this phe-
nomenon could be that recruitment happens throughout the
inflation curve [36], making the existence of a singular thresh-
old opening pressure unlikely. Also, inflation LIP has been
shown to only poorly represent the pressure at which recruited
lung stays open [33,40]. But since we did observe an increase
in the LIP with recruitment, the logical consequence would be
to increase PEEP after the recruitment maneuver.
Another parameter of the PV-curve, V
REC
has been used as an
indicator of recruited volume in several investigations
[36,41,42], but it had never been validated with actual CT
measurements. Especially in ventilation with FiO
2
1.0, the V
REC
represents unstable lung units prone to collapse. In our
results, there was a significant increase in V
REC
after the
recruitment maneuver, which correlated with the observed
changes in V
POOR
and V
NON
. This means that a significant por-
tion of the recruited lung still collapsed endexpiratory, proba-
bly because we did not increase PEEP after the recruitment.
Therefore, V
REC
could not only serve as a measurement for
recruited lung, but also for the lung in danger of being de-
recruited.
Conclusion
The findings of this study suggest that an improvement in oxy-
genation does not necessarily mean recruitment of nonaerated
Table 3
Respiratory mechanics parameters
Pre-recruitment maneuver Post-recruitment maneuver P-value fractional change(%)
PIP (cmH
2
O) 36.6 ± 4 31.1 ± 3.7 0.012 -12.5 ± 6
P
PLAT
(cmH
2
O) 30.7 ± 3.1 27.2 ± 2.8 0.028 -13.8 ± 7
C
RS
(ml cmH
2
O
-1
) 13.5 ± 2.2 17.9 ± 2.6 0.028 34.5 ± 17
Pmci,
INF
(cmH
2
O) 22.4 ± 11.9 32.3 ± 5.4 0.046 113 ± 192
Pmcd,
INF
(cmH
2
O) 43.3 ± 9.5 56.6 ± 15.5 0.075 -
C
INF
(ml cmH
2
O
-1
) 24.4 ± 14.7 42.0 ± 14.5 0.028 101.8 ± 92
Pmci,
DEF
(cmH
2
O) 9.4 ± 2.2 9.9 ± 1.1 0.463 -
Pmcd,
DEF
(cmH
2
O) 19.9 ± 2.0 21.4 ± 1.9 0.046 7.0 ± 0.7
V
REC
(ml) 183 ± 135 256 ± 145 0.028 66.5 ± 47
Data are reported as mean ± SD. C
INF
, maximum inflation compliance; PIP, peak inspiratory pressure; P
PLAT
, plateau pressure; C
RS
, static
respiratory system compliance; Pmci,
DEF
, point of maximum compliance increase of deflation curve; Pmcd,
DEF
, point of maximum compliance
decrease of deflation curve; Pmcd,
INF
, point of maximum compliance decrease of inflation curve; Pmci,
INF
, point of maximum compliance increase
of inflation curve; V
REC
, recruitable volume at 10 cmH
2
O.
Available online />R481
lung and that measures to recruit collapsed lung will have
unpredictable results on gas exchange. The effects were
diverse in magnitude and predicted changes in oxygenation
and shunt did not correlate with alveolar recruitment. Poorly
aerated lung regions were the main determinant for the
observed changes in plateau pressure, respiratory system
compliance and recruitable volume.
Lung recruitment might be grossly overestimated when simply
looking at the PaO
2
. Also, the effects of a standard open-lung
maneuver or currently advocated PEEP strategies on recruit-
ment are relatively small [43]. Because we did not focus on
optimal recruitment but on the relationship of certain
parameters with changes in lung aeration, however, we used
a recruitment procedure as proposed previously. Obviously,
this specific recruitment maneuver was not sufficient to
homogenize lung ventilation. Common treatment strategies in
ARDS aim to improve oxygenation, and the mechanical prop-
erties of ventilator settings are adjusted according to gas
exchange parameters (e.g. PEEP/FiO
2
tables). The poor corre-
lation we have found between oxygenation and recruitment
might be a reason that several of these approaches have failed
to show a benefit for the patients treated this way. We specu-
late that parameters other than gas exchange should be inves-
tigated as targets in treating these patients.
Competing interests
DH has received an unrestricted research grant in 2003 from
Hamilton Medical Deutschland GmbH, by which the study
was partially funded. All other authors declare that they have
no competing interests.
Authors' contributions
DH conceived the study, participated in the design and execu-
tion of the study, the analysis of data and finalized the manu-
script. PP participated in analysis and interpretation of the data
and revised the manuscript. RD participated in the animal
experiments and the analysis of data. AU participated in the
animal experiments and the analysis of multi-slice CT data. AM
did the radiology studies and participated in the analysis of
multi-slice CT data. RR participated in the study design and
coordination and helped to draft the manuscript. RK partici-
pated in the study design, interpretation of results and writing
of the manuscript.
Additional files
Acknowledgements
We are thankful to Ingo Weber, MD, Anesthesiology Department of the
University Hospital RWTH Aachen, for English editing of the manuscript.
We would also like to thank Thaddeus Stopinski and Kira Scherer, Insti-
tute for Animal Research at the University Hospital RWTH Aachen, for
their invaluable help and assistance.
References
1. Gattinoni L, Caironi P, Pelosi P, Goodman LR: What has com-
puted tomography taught us about the acute respiratory dis-
tress syndrome? Am J Respir Crit Care Med 2001,
164:1701-1711.
2. Hubmayr RD: Perspective on lung injury and recruitment: a
skeptical look at the opening and collapse story. Am J Respir
Crit Care Med 2002, 165:1647-1653.
3. Tokics L, Hedenstierna G, Strandberg A, Brismar B, Lundquist H:
Lung collapse and gas exchange during general anesthesia:
effects of spontaneous breathing, muscle paralysis, and posi-
tive end-expiratory pressure. Anesthesiology 1987,
66:157-167.
4. Lachmann B: Open up the lung and keep the lung open. Inten-
sive Care Med 1992, 18:319-321.
5. Rossaint R, Hahn SM, Pappert D, Falke KJ, Radermacher P: Influ-
ence of mixed venous PO2 and inspired O2 fraction on
intrapulmonary shunt in patients with severe ARDS. J Appl
Physiol 1995, 78:1531-1536.
6. Brimioulle S, Julien V, Gust R, Kozlowski JK, Naeije R, Schuster
DP: Importance of hypoxic vasoconstriction in maintaining
oxygenation during acute lung injury. Crit Care Med 2002,
30:874-880.
7. Gattinoni L, Pelosi P, Vitale G, Pesenti A, D'Andrea L, Mascheroni
D: Body position changes redistribute lung Computed-Tomo-
Key messages
• The respiratory mechanics parameters correlated with
the amount of aerated lung better than gas exchange
parameters, with the venous admixture being the only
oxygenation parameter that correlated with nonaerated
lung volume.
• A recruitment maneuver without PEEP adjustment led to
a decrease of nonaerated lung, presumably towards
poorly aerated lung mainly. This did not significantly
alter the distribution of a tidal breath to the differently
aerated lung regions, however, implying that there was
no reduction in the opening and collapse of alveoli.
• Changes in aerated and nonaerated lung volumes after
the recruitment maneuver were adequately represented
by changes in plateau pressure, respiratory system
compliance and recruitable volume.
• An improvement in oxygenation does not necessarily
mean recruitment of nonaerated lung and measures to
recruit collapsed lung will have unpredictable results on
gas exchange.
• In the clinical context, or even worse in clinical studies,
using PaO
2
changes as a surrogate for lung recruitment
should be done with caution, as it lacks a clear physio-
logical basis.
The following Additional files are available online:
Additional File 1
Additional information on materials and methods.
See />supplementary/cc3772-S1.doc
Critical Care Vol 9 No 5 Henzler et al.
R482
graphic density in patients with acute respiratory failure.
Anesthesiology 1991, 74:15-23.
8. Crotti S, Mascheroni D, Caironi P, Pelosi P, Ronzoni G, Mondino
M, Marini JJ, Gattinoni L: Recruitment and derecruitment during
acute respiratory failure: a clinical study. Am J Respir Crit Care
Med 2001, 164:131-140.
9. Institute of Laboratory Animal Resources, National Research
Council: Guide for the Care and Use of Laboratory Animals.
National Academy Press Washington, D.C.; 1996. Ref Type: Inter-
net Communication
10. Jonson B, Beydon L, Brauer K, Mansson C, Valind S, Grytzell H:
Mechanics of respiratory system in healthy anesthetized
humans with emphasis on viscoelastic properties. J Appl
Physiol 1993, 75:132-140.
11. Dembinski R, Max M, Bensberg R, Rossaint R, Kuhlen R: Pressure
Support Compared with Controlled Mechanical Ventilation in
Experimental Lung Injury. Anesth Analg 2002, 94:1570-1576.
12. Puybasset L, Cluzel P, Gusman P, Grenier P, Preteux F, Rouby JJ:
Regional distribution of gas and tissue in acute respiratory
distress syndrome. I. Consequences for lung morphology. CT
Scan ARDS Study Group. Intensive Care Med 2000,
26:857-869.
13. Puybasset L, Gusman P, Muller JC, Cluzel P, Coriat P, Rouby JJ:
Regional distribution of gas and tissue in acute respiratory
distress syndrome. III. Consequences for the effects of posi-
tive end-expiratory pressure. CT Scan ARDS Study Group.
Adult Respiratory Distress Syndrome. Intensive Care Med
2000, 26:1215-1227.
14. Berggren SM: The oxygen deficit of arterial blood caused by
non-ventilated parts of the lung. Acta Physiol Scand Suppl
1942, 4:4-92.
15. Polese G, Rossi A, Appendini L, Brandi G, Bates JH, Brandolese
R: Partitioning of respiratory mechanics in mechanically venti-
lated patients. J Appl Physiol 1991, 71:2425-2433.
16. Venegas JG, Harris RS, Simon BA: A comprehensive equation
for the pulmonary pressure-volume curve. J Appl Physiol
1998, 84:389-395.
17. Pelosi P, Goldner M, McKibben A, Adams A, Eccher G, Caironi P,
Losappio S, Gattinoni L, Marini JJ: Recruitment and derecruit-
ment during acute respiratory failure: an experimental study.
Am J Respir Crit Care Med 2001, 164:122-130.
18. Marini JJ: Recruitment maneuvers to achieve an "open lung" –
whether and how? Crit Care Med 2001, 29:1647-1648.
19. Grasso S, Mascia L, del Turco M, Malacarne P, Giunta F, Brochard
L, Slutsky AS, Marco RV: Effects of recruiting maneuvers in
patients with acute respiratory distress syndrome ventilated
with protective ventilatory strategy. Anesthesiology 2002,
96:795-802.
20. Kaisers U, Max M, Walter J, Kuhlen R, Pappert D, Falke KJ, Ros-
saint R: Partial liquid ventilation with small volumes of FC 3280
increases survival time in experimental ARDS. Eur Respir J
1997, 10:1955-1961.
21. Neumann P, Hedenstierna G: Ventilation-perfusion distribu-
tions in different porcine lung injury models. Acta Anaesthesiol
Scand 2001, 45:78-86.
22. Luecke T, Roth H, Herrmann P, Joachim A, Weisser G, Pelosi P,
Quintel M: PEEP decreases atelectasis and extravascular lung
water but not lung tissue volume in surfactant-washout lung
injury. Intensive Care Med 2003, 29:2026-2033.
23. Grasso S, Terragni P, Mascia L, Fanelli V, Quintel M, Herrmann P,
Hedenstierna G, Slutsky AS, Ranieri VM: Airway pressure-time
curve profile (stress index) detects tidal recruitment/hyperin-
flation in experimental acute lung injury. Crit Care Med 2004,
32:1018-1027.
24. Downie JM, Nam AJ, Simon BA: Pressure-volume curve does
not predict steady-state lung volume in canine lavage lung
injury. Am J Respir Crit Care Med 2004, 169:957-962.
25. Rouby JJ, Puybasset L, Nieszkowska A, Lu Q: Acute respiratory
distress syndrome: lessons from computed tomography of
the whole lung. Crit Care Med 2003, 31:S285-S295.
26. Brower RG, Morris A, MacIntyre N, Matthay MA, Hayden D,
Thompson T, Clemmer T, Lanken PN, Schoenfeld D: Effects of
recruitment maneuvers in patients with acute lung injury and
acute respiratory distress syndrome ventilated with high pos-
itive end-expiratory pressure. Crit Care Med 2003,
31:2592-2597.
27. Ashbaugh DG, Bigelow DB, Petty TL, Levine BE: Acute respira-
tory distress in adults. Lancet 1967, 2:319-323.
28. Neumann P, Rothen HU, Berglund JE, Valtysson J, Magnusson A,
Hedenstierna G: Positive end-expiratory pressure prevents
atelectasis during general anaesthesia even in the presence
of a high inspired oxygen concentration. Acta Anaesthesiol
Scand 1999, 43:295-301.
29. Hedenstierna G, Tokics L, Strandberg A, Lundquist H, Brismar B:
Correlation of gas exchange impairment to development of
atelectasis during anaesthesia and muscle paralysis. Acta
Anaesthesiol Scand 1986, 30:183-191.
30. Brower RG, Lanken PN, MacIntyre N, Matthay MA, Morris A,
Ancukiewicz M, Schoenfeld D, Thompson BT: Higher versus
lower positive end-expiratory pressures in patients with the
acute respiratory distress syndrome. N Engl J Med 2004,
351:327-336.
31. Gattinoni L, Tognoni G, Pesenti A, Taccone P, Mascheroni D,
Labarta V, Malacrida R, Di Giulio P, Fumagalli R, Pelosi P, Brazzi L,
Latini R: Effect of prone positioning on the survival of patients
with acute respiratory failure. N Engl J Med 2001,
345:568-573.
32. Barnas GM, Green MD, Mackenzie CF, Fletcher SJ, Campbell DN,
Runcie C, Broderick GE: Effect of posture on lung and regional
chest wall mechanics. Anesthesiology 1993, 78:251-259.
33. Maggiore SM, Jonson B, Richard JC, Jaber S, Lemaire F, Brochard
L: Alveolar derecruitment at decremental positive end-expira-
tory pressure levels in acute lung injury: comparison with the
lower inflection point, oxygenation, and compliance. Am J
Respir Crit Care Med 2001, 164:795-801.
34. Vieillard-Baron A, Prin S, Schmitt JM, Augarde R, Page B, Beau-
chet A, Jardin F: Pressure-volume curves in acute respiratory
distress syndrome: clinical demonstration of the influence of
expiratory flow limitation on the initial slope. Am J Respir Crit
Care Med 2002, 165:1107-1112.
35. Jonson B, Svantesson C: Elastic pressure-volume curves: what
information do they convey? Thorax 1999, 54:82-87.
36. Jonson B, Richard JC, Straus C, Mancebo J, Lemaire F, Brochard
L: Pressure-volume curves and compliance in acute lung
injury: evidence of recruitment above the lower inflection
point. Am J Respir Crit Care Med 1999, 159:1172-1178.
37. Henzler D, Orfao S, Rossaint R, Kuhlen R: Modification of a sig-
moidal equation for the pulmonary pressure-volume curve for
asymmetric data. J Appl Physiol 2003, 95:2183-2184.
38. Harris RS, Hess DR, Venegas JG: An objective analysis of the
pressure-volume curve in the acute respiratory distress
syndrome. Am J Respir Crit Care Med 2000, 161:432-439.
39. Amato MB, Barbas CS, Medeiros DM, Magaldi RB, Schettino GP,
Lorenzi FG, Kairalla RA, Deheinzelin D, Munoz C, Oliveira R, et al.:
Effect of a protective-ventilation strategy on mortality in the
acute respiratory distress syndrome. N Engl J Med 1998,
338:347-354.
40. Lichtwarck-Aschoff M, Hedlund AJ, Nordgren KA, Wegenius GA,
Markstrom AM, Guttmann J, Sjostrand UH: Variables used to set
PEEP in the lung lavage model are poorly related. Br J Anaesth
1999, 83:890-897.
41. Richard JC, Brochard L, Vandelet P, Breton L, Maggiore SM, Jon-
son B, Clabault K, Leroy J, Bonmarchand G: Respective effects
of end-expiratory and end-inspiratory pressures on alveolar
recruitment in acute lung injury. Crit Care Med 2003, 31:89-92.
42. Ranieri VM, Eissa NT, Corbeil C, Chasse M, Braidy J, Matar N,
Milic-Emili J: Effects of positive end-expiratory pressure on
alveolar recruitment and gas exchange in patients with the
adult respiratory distress syndrome. Am Rev Respir Dis 1991,
144:544-551.
43. Grasso S, Fanelli V, Cafarelli A, Anaclerio R, Amabile M, Ancona
G, Fiore T: Effects of high versus low positive end-expiratory
pressures in acute respiratory distress syndrome. Am J Respir
Crit Care Med 2005, 171:1002-1008.