Báo cáo khoa học: "Clinical review: Reunification of acid–base physiology" pdf
Bạn đang xem bản rút gọn của tài liệu. Xem và tải ngay bản đầy đủ của tài liệu tại đây (101.08 KB, 8 trang )
500
AG = anion gap; AGc = corrected anion gap; A
TOT
= total weak acids; BE = base excess; PCO
2
= partial carbon dioxide tension; SBE = standard
base excess; SID = strong ion difference; SIG = strong ion gap; Vd = volume of distribution.
Critical Care October 2005 Vol 9 No 5 Kellum
Abstract
Recent advances in acid–base physiology and in the epidemiology
of acid–base disorders have refined our understanding of the basic
control mechanisms that determine blood pH in health and
disease. These refinements have also brought parity between the
newer, quantitative and older, descriptive approaches to acid–
base physiology. This review explores how the new and older
approaches to acid–base physiology can be reconciled and
combined to result in a powerful bedside tool. A case based
tutorial is also provided.
Introduction
During the past 5 years, numerous publications have
examined various aspects of acid–base physiology using
modern quantitative acid–base chemistry. These studies have
refined our understanding of the basic control mechanisms
that determine blood pH in health and disease, and have
described the epidemiology and clinical significance of
acid–base imbalances in far more detail than was previously
possible. Furthermore, these refinements have brought into
parity quantitative and descriptive approaches to acid–base
physiology, and permit translation of the ‘old’ into the ‘new’.
Indeed, these advances have established that the modern
(quantitative) and traditional (descriptive) approaches are, in
fact, easily interchangeable at the level of their most basic
elements, with a little mathematical manipulation. This
‘interchange’ has in turn resulted in an explication of the
limitations of each approach and has revealed how a
combined approach can be used to achieve a more complete
understanding of clinical acid–base physiology.
These new insights have further called into question some
basic clinical interpretations of acid-base physiology while at
the same time supporting the underlying chemistry. For
example, it is now possible to understand and apply the
variables of strong ion difference (SID) and total weak acids
(A
TOT
) entirely within the context of Bronsted–Lowry
acid–base chemistry [1-5]. However, it remains difficult to
reconcile how alterations in plasma pH can be brought about
by direct manipulations of hydrogen or bicarbonate ions, as
the descriptive approaches suggest (although do not
require), when they are dependent variables according to
quantitative acid–base chemistry. Newer approaches such as
ion equilibrium theory [1,2] can perhaps reconcile these
differences by not requiring independent variables, but it is
likely that advances in our understanding of pathophysiology
will favor one interpretation or the other. For example, the
discovery of genetic polymorphisms that alter the function of
chloride channels being associated with renal tubular
acidosis [6] favors the quantitative explanation. Nevertheless,
observations detailed using descriptive approaches are no
less valid. One way to unify acid–base physiology is merely to
acknowledge that descriptive indices such as standard base
excess (SBE) and the Henderson–Hasselbalch equation are
useful for describing and classifying acid–base disorders,
whereas quantitative indices such as SID and A
TOT
are more
useful for quantifying these disorders and for generating
hypotheses regarding mechanisms.
This review explores how acid–base ‘reunification’ is possible
and even desirable, and how a unified approach can be more
powerful than any of its parts. This unified field answers many
stubborn questions and simplifies bedside interpretation to
the point that every practising intensivist should be aware of
its essential components. Finally, a detailed review of a
complex yet typical case is used to reinforce these concepts.
Acid–base reunification
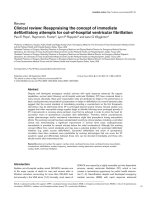
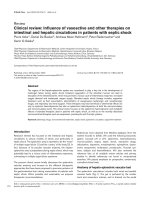
There are three widely used approaches to acid–base
physiology using apparently different variables to assess
changes in acid–base balance (Fig. 1). In fact, each variable
can be derived from a set of master equations and complete
Review
Clinical review: Reunification of acid–base physiology
John A Kellum
The CRISMA (Clinical Research Investigation and Systems Modeling of Acute Illness) Laboratory, Department of Critical Care Medicine, University of
Pittsburgh, Pittsburgh, Pennsylvania, USA
Corresponding author: John A Kellum,
Published online: 5 August 2005 Critical Care 2005, 9:500-507 (DOI 10.1186/cc3789)
This article is online at />© 2005 BioMed Central Ltd
501
Available online />parity can be brought to all three acid–base approaches. This
is because acid–base balance in plasma is based upon
thermodynamic equilibrium equations [2]. The total concen-
tration of proton acceptor sites in a solution (C
B
) is given by
the following equation:
C
B
= C +
Σ
i
C
i
e
–
i
– D (1)
where C is the total concentration of carbonate species
proton acceptor sites (in mmol/l), C
i
is the concentration of
noncarbonate buffer species i (in mmol/l), e
–
i
is the average
number of proton acceptor sites per molecule of species i,
and D is Ricci’s difference function (D = [H
+
] – [OH
–
]). Thus,
Eqn 1 may be regarded as a master equation from which all
other acid–base formulae may be derived [2].
It is no wonder, in terms of describing acid–base
abnormalities and classifying them into various groups, that
the three widely accepted methods yield comparable results
[7]. Importantly, each approach differs only in its assessment
of the metabolic component (i.e. all three treat partial carbon
dioxide tension [P
CO
2
] the same). These three methods
quantify the metabolic component by using the relationship
between HCO
3
–
and PCO
2
(method 1), the SBE (method 2),
or the SID and A
TOT
(method 3). All three yield virtually
identical results when they are used to quantify the acid–base
status of a given blood sample [1,4,8,9], with an increasingly
complex rule set going from method 3 to method 1 [10,11].
In quantitative acid–base chemistry (method 3), a complete
‘rule set’ is provided in the form of equilibrium equations
[12,13], so the approach is easily adapted to modern handheld
computer devices [14] and more sophisticated graphical
interfaces [15]. However, this does not in itself necessarily
make the approach any better [4,5], although it is by definition
more transparent and therefore more easily reproduced. The
difficulty with the quantitative approach comes from the fact
that several variables are needed, and when they are absent
and assumed to be normal the approach becomes essentially
indistinguishable from the more traditional descriptive methods.
Of course, this only applies to quantifying and classifying an
acid–base disorder. The quantitative approach has important
implications for our understanding of mechanisms, leading to
conclusions that are at odds with more traditional thinking (e.g.
viewing renal tubular acidosis as ‘chloride channelopathies’).
However, in the absence of specific experimental data, the
method can only imply causality – it cannot establish it.
Furthermore, all three approaches predict the exact same
changes in all of the relevant variables and, because these
changes occur nearly instantaneously, determining which
variable is causal is extremely difficult. An often used analogy is
that the naked eye can observe the movement of the sun in
reference to the Earth, but without additional observations (via
Galileo’s telescope) or mathematical models (ala Copernicus)
it is impossible to say which body is in motion [16,17]. In the
case of acid–base physiology multiple variables ‘move’, making
the analysis that much more difficult.
In the end, all approaches to acid–base analysis are just
tools. Their usefulness is best evaluated by examining the
predictions that they make and how well they conform to
experimental data. For example, by using only the
Henderson–Hasselbalch equation a linear relationship
between pH and log P
CO
2
should exist, but actual data
demonstrate nonlinear behavior [18]. In order to ‘fit’ the
Henderson–Hasselbalch equation to experimental data,
terms for SID and A
TOT
must be added [2,18].
[SID] – K
a
– [A
TOT
]/[K
a
+ 10
–pH
]
pH = pK
1
’ + log (2)
SP
CO2
Here, K
1
’ is the equilibrium constant for the Henderson–
Hasselbalch equation, K
a
is the weak acid dissociation
constant, and S is the solubility of CO
2
in plasma. Similarly,
one can predict changes in plasma bicarbonate resulting
from addition of sodium bicarbonate using its estimated
volume of distribution (Vd). Under normal conditions the Vd
for bicarbonate in humans has been estimated to be 40–50%
of total body water [19]. However, the calculated Vd for
bicarbonate changes with changes in pH [20], and Vd
changes differently with respiratory versus metabolic
acid–base derangements [21]. Treating bicarbonate as a
dependent variable and predicting the changes with sodium
bicarbonate as a result of the effect on sodium on SID
requires none of these complicating rules and exceptions,
and might therefore be viewed as much simpler.
Updating base excess
As early as the 1940s researchers recognized the limitations
of a purely descriptive approach to acid–base physiology
Figure 1
The continuum of approaches to understanding acid–base physiology.
All three approaches share certain affecter elements and all use
markers and derived variables to describe acid–base imbalance.
A
TOT
, total weak acids; PCO
2
, partial carbon dioxide tension; SBE,
standard base excess; SID, strong ion difference; SIG, strong ion gap.
Henderson-
Hasselbalch
Base Excess
Physical
Chemical
pCO
2
“Fixed acids”
H
+
pCO
2
Buffer Base
pCO
2
SID
A
TOT
HCO
3
-
Anion Gap
SBE SI
G
Markers
& Derived
Variables
Base Excess
Physical
Chemical
pCO
2
Buffer Base
pCO
2
SID
A
TOT
SBE SIG
Base Excess
Physical
Chemical
pCO
2
Buffer Base
pCO
2
SID
A
TOT
SBE SIG
Descriptive Semi-quantitative Quantitative
Affecters
502
Critical Care October 2005 Vol 9 No 5 Kellum
[22]. One obvious limitation is that changes in plasma
bicarbonate concentration, although useful in determining the
direction and therefore the type of acid–base abnormality, are
not capable of quantifying the amount of acid or base that
has been added to the plasma unless P
CO
2
is held constant.
This observation prompted the development of tools to
standardize bicarbonate or to quantify the metabolic
component of an acid–base abnormality. In 1948, Singer and
Hastings [22] proposed the term ‘buffer base’ to define the
sum of HCO
3
–
and the nonvolatile weak acid buffers. A
change in buffer base corresponds to a change in the
metabolic component. The methods for calculating the
change in buffer base were later refined by investigators
[23,24] and refined further by others [25,26] to yield the base
excess (BE) methodology. BE is the quantity of metabolic
acidosis or alkalosis, defined as the amount of acid or base
that must be added to a sample of whole blood in vitro in
order to restore the pH of the sample to 7.40 while the P
CO
2
is held at 40 mmHg [24]. Perhaps the most commonly used
formula for calculating BE is the Van Slyke equation [27,28]:
BE = (HCO
3
–
– 24.4 + [2.3 × Hb + 7.7] × [pH – 7.4]) ×
(1 – 0.023 × Hb) (3)
where HCO
3
–
and hemoglobin (Hb) are expressed in mmol/l.
However, there is great variability in the equations used for
BE. For example, a commonly used commercially available
arterial blood gas machine calculates BE using a 14 variable
equation. In addition, although BE is quite accurate in vitro,
inaccuracy has always been a problem when applied in vivo in
that BE changes slightly with changes in P
CO
2
[29,30]. This
effect is understood to be due to equilibration across the
entire extracellular fluid space (whole blood plus interstitial
fluid). Thus, the BE equation was modified to ‘standardize’ the
effect of hemoglobin in order to improve the accuracy of BE in
vivo. The term ‘standard base excess’ (SBE) has been given to
this variable, which better quantifies the change in metabolic
acid–base status in vivo. Again multiple equations exist:
SBE = 0.9287 × (HCO
3
–
– 24.4 + 14.83 × [pH – 7.4]) (4)
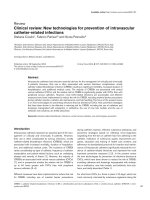
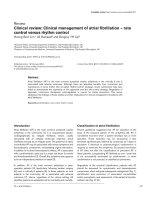
However, Eqn 4 still yields results that are slightly unstable as
P
CO
2
changes (Fig. 2). Furthermore, the equation assumes
normal A
TOT
. When albumin or phosphate is decreased – a
common scenario in the critically ill – Eqn 4 will result in even
more instability (Fig. 2). Recently, Wooten [4,5] developed a
multicompartment model using quantitative techniques and
suggested a correction for SBE that results in a formula for
SBE that agrees much more closely with experimental data in
humans.
Corrected SBE = (HCO
3
–
– 24.4) +
([8.3 × albumin × 0.15] + [0.29 × phosphate × 0.32]) ×
(pH – 7.4) (5)
Albumin is expressed in g/dl and phosphate in mg/dl.
Thus, the techniques previously developed to calculate
parameters that describe physiological acid–base balance in
single compartments have now been extended to
multicompartment systems. Furthermore, the equations for
multicompartment systems have been shown to possess the
same mathematical inter-relationships as those for single
compartments. Wooten also demonstrated that the
multicompartment form of the Van Slyke equation (Eqn 5) is
related in general form to the traditional form of the Van Slyke
equation (Eqn 3), and that with the multicompartment model
modern quantitative acid–base chemistry is brought into the
same context as the BE method [4].
In this way, SBE can be seen as the quantity of strong acid or
base required to restore the SID to baseline, at which pH is
7.40 and P
CO
2
is 40 mmHg. Experimental data have already
borne out this relationship in that the change in SBE is
essentially equal to the change in SID across a vascular bed
(when there is no change in A
TOT
) [8]. If A
TOT
changes then
SBE still quantifies the amount of strong acid or base
required to change the SID to a new equilibrium point at
which pH is 7.40 and P
CO
2
is 40 mmHg. This relationship
between SBE and SID is not surprising. Stewart’s term SID
refers to the absolute difference between completely (or near
completely) dissociated cations and anions. According to the
principle of electrical neutrality, this difference is balanced by
the weak acids and CO
2
such that SID can be defined either
in terms of strong ions or in terms of the weak acids and CO
2
offsetting it. Of note, the SID defined in terms of weak acids
and CO
2
, which has been subsequently termed the effective
SID [31], is identical to the buffer base term coined by Singer
and Hastings [22] over half a century ago. Thus, changes in
SBE also represent changes in SID [8].
Updating the anion gap
Metabolic acid–base disturbances can be brought about by
changes in strong ions or weak ions. These ions can be
Figure 2
Carbon dioxide titration curves. Computer simulation of in vivo CO
2
titration curves for human plasma using the traditional Van Slyke
equation and various levels of A
TOT
(total weak acids) from normal
(17.2) to 25% of normal. Also shown is the titration curve using the
A
TOT
corrected standard base excess (SBEc).
–5
–4
–3
–2
–1
0
1
2
3
4
7.7 7.6 7.5 7.4 7.3 7.2 7.1 7.0
pH
Base Excess
17.2
8.
6
4.
6
SBEc
503
Available online />routinely measured (e.g. Cl
–
) or not (e.g. ketones). The ones
not routinely measured are referred to as ‘unmeasured ions’.
Many years ago it was impractical to measure certain ions
such as lactate, and it remains impractical to measure others
such as sulfate. Thus, the literature contains a confusing array
of information regarding the magnitude of unmeasured ions
(usually anions) and techniques to estimate them.
Among these techniques, the anion gap (AG) is without
question the most durable. For more than 30 years the AG
has been used by clinicians and it has evolved into a major
tool with which to evaluate acid–base disorders [32]. The AG
is calculated, or rather estimated, from the differences
between the routinely measured concentrations of serum
cations (Na
+
and K
+
) and anions (Cl
–
and HCO
3
–
). Normally,
this difference or ‘gap’ is made up by two components. The
major component is A
–
(i.e. the charge contributed by
albumin and to a lesser extent by phosphate). The minor
component is made up by strong ions such as sulfate and
lactate, whose net contributions are normally less than
2 mEq/l. However, there are also unmeasured (by the AG)
cations such as Ca
2+
and Mg
2+
, and these tend to offset the
effects of sulfate and lactate except when either is abnormally
increased. Plasma proteins other than albumin can be either
positively or negatively charged, but on aggregate they tend
to be neutral [31] except in rare cases of abnormal
paraproteins, such as in multiple myeloma. In practice the AG
is calculated as follows:
AG = (Na
+
+ K
+
) – (Cl
–
+ HCO
3
–
) (6)
Because of its low and narrow extracellular concentration, K
+
is often omitted from the calculation. Respective normal
values with relatively wide ranges reported by most
laboratories are 12 ± 4 mEq/l (if K
+
is considered) and
8 ± 4 mEq/l (if K
+
is not considered). The ‘normal AG’ has
decreased in recent years following the introduction of more
accurate methods for measuring Cl
–
concentration [33,34].
However, the various measurement techniques available
mandate that each institution reports its own expected
‘normal AG’.
Some authors have raised doubts about the diagnostic value
of the AG in certain situations [35,36]. Salem and Mujais [35]
found routine reliance on the AG to be ‘fraught with
numerous pitfalls’. The primary problem with the AG is its
reliance on the use of a ‘normal’ range produced by albumin
and to a lesser extent by phosphate, as discussed above.
These constituents may be grossly abnormal in patients with
critical illness, leading to a change in the ‘normal’ range for
these patients. Moreover, because these anions are not
strong anions their charge will be altered by changes in pH.
This has prompted some authors to adjust the ‘normal range’
for the AG by the patient’s albumin and phosphate
concentration. Each 1 g/dl albumin has a charge of 2.8 mEq/l
at pH 7.4 (2.3 mEq/l at 7.0 and 3.0 mEq/l at 7.6), and each
1 mg/dl phosphate has a charge of 0.59 mEq/l at pH 7.4
(0.55 mEq/l at 7.0 and 0.61 mEq/l at 7.6). Thus, in much the
same way that the corrected SBE equation (Eqn 5) updates
BE to allow for changes in A
TOT
, the AG may be corrected to
yield a corrected AG (AGc) [7].
AGc = ([Na
+
+ K
+
] – [Cl
–
+ HCO
3
–
]) –
(2[albumin (g/dl)] + 0.5[phosphate (mg/dl)])
or
AGc = [(Na
+
+ K
+
) – (Cl
–
+ HCO
3
–
)] –
(0.2[albumin (g/l)] + 1.5[phosphate (mmol/l)]) (7)
The choice of formula is determined by which units are
desired. Here the AGc should approximate zero. This is
because the terms for albumin and phosphate approximate
A
–
(the dissociated portion of A
TOT
). When AGc was used to
examine the presence of unmeasured anions in the blood of
critically ill patients, the accuracy improved from 33% with
the routine AG (normal range = 12 mEq/l) to 96% [7]. This
technique should only be used when the pH is less than
7.35, and even then it is only accurate within 5 mEq/l. Note
that some authors have chosen to ‘correct’ the AG by
increasing the calculated value rather than adjusting its
expected range. Here the same (or slightly simplified
equations) are used to increase the AG toward the traditional
range rather than to decrease it toward zero. Either approach
would be acceptable, but if the objective is to quantify
unmeasured anions then the former may seem unnecessarily
cumbersome because it requires the additional step of
subtracting a normal value.
However, the purpose of the AG is to detect the presence of
unmeasured ions (e.g. ketones, salicylate), and AGc will not
consider abnormalities in other ‘measured’ ions such as Mg
2+
or Ca
2+
, and the correction for albumin and phosphate is
merely an approximation. To be more exact, one can calculate
the strong ion gap (SIG) [37,38].
SIG = ([Na
+
+ K
+
+ Ca
2+
+ Mg
2+
] – [Cl
–
+ lactate
–
]) –
(2.46 × 10
–8
× PCO
2
/10
–pH
+ [albumin (g/dl)] ×
[0.123 × pH – 0.631] + [PO
4
–
(mmol/l) ×
(pH – 0.469)]) (8)
Importantly, all the strong ions are expressed in mEq/l and
only the ionized portions of Mg
2+
and Ca
2+
are considered
(to convert total to ionized Mg
2+
, multiply by 0.7). Note also
that we do not consider lactate as unmeasured. Because the
concentration of unmeasured anions is expected to be quite
low (< 2 mEq/l), the SIG is expected to be quite low.
However, some investigators have found elevations in SIG,
particularly in critically ill patients, even when no acid–base
disorder is apparent [39-42]. By contrast, results from
studies in normal animals [38,43] and values derived from
published data in exercising humans [37] put the ‘normal’
SIG near zero. There is even a suggestion that critically ill
patients in different countries might exhibit differences in SIG.
504
In the USA [40,44], Holland [39] and Thailand [45] the SIG
is about 5 mEq/l, whereas studies from England [41] and
Australia [42] report values in excess of 8 mEq/l.
The difference may lie with the use of gelatins in these
countries [46], which are an exogenous source of
unmeasured ions [47]. In this scenario the SIG is likely to be
a mixture of endogenous and exogenous anions. Interestingly,
previous studies that failed to find a correlation between SIG
and mortality were performed in countries that use gelatin
based resuscitation fluids [41,42], whereas studies of
patients not receiving gelatins [40,45,48] or any resuscitation
at all [44] found a positive correlation between SIG and
hospital mortality. Indeed, Kaplan and Kellum [44] recently
reported that preresuscitation SIG predicts mortality in
injured patients better than blood lactate, pH, or injury
severity scores. Similar results were also obtained by
Durward and coworkers [48] in pediatric cardiac surgery
patients. Although that study was done in England, gelatins
were not used. Thus, the predictive value of SIG may exceed
that of the AG, but it may vary from population to population
and even between institutions. As such, estimating the SIG
from the AG, after correcting for albumin and PO
4
, and after
subtracting lactate (i.e. AGc), may be a reasonable substitute
for the long hand calculation [7,39,46].
Together with the updates for SBE discussed above,
conversion between the descriptive approaches to
acid–base balance using HCO
3
–
or SBE and AG and the
quantitative approach using SID and SIG should be fairly
straightforward; indeed, they are (Table 1).
Quantitative acid–base at the bedside
If acid–base analysis can be reunified and BE and AG
updated, then it should be fairly easy to take the quantitative
approach to the bedside – even without a calculator. In fact,
this is the approach that I have been using for several years
but it is now possible to be much more precise, given the
advances of the past few years. To see how this works, let us
consider a complex but all too common case (Table 2). This
patient presented (middle column) with severe metabolic
acidosis, as indicated by the SBE of –20 mEq/l or by the
combination of a low HCO
3
–
and PCO
2
. However, is this a
pure metabolic disorder or is there a respiratory component
as well? Table 3 shows the typical patterns found in patients
with simple acid–base disorders. A metabolic acidosis should
Critical Care October 2005 Vol 9 No 5 Kellum
Table 1
Translator for acid–base variables across traditional and modern approaches
Physical
‘Traditional’ chemical
variable variable Comment
pH pH
P
CO
2
PCO
2
HCO
3
–
Total CO
2
Total CO
2
includes dissolved CO
2
, H
2
CO
3
and CO
3
2–
in addition to HCO
3
–
. However, for practical
purposes, at physiologic pH the two variables are very similar
Buffer base SIDe In the absence of unmeasured anions SIDe = SIDa = SID. However, because this rarely happens,
SIDe = SID = SIDa – SIG (see text for discussion)
SBE SID
present
– For blood plasma in vivo, SBE rather than ABE quantifies the amount of strong acid (or strong base if SBE is
SID
equilibrium
negative) that would be needed to return the SID to its equilibrium point (the point at which pH = 7.4 and
P
CO
2
= 40). Note that change in SBE can brought about by a change in A
–
or SID, but SBE only quantifies
the change in SID required to reach equilibrium. In the case of a change in A
–
, the new equilibrium for SID
will be different (see text). The version of SBE that corrects for abnormalities in A
–
(SBEc) is given in Eqn 5
(see text)
Anion gap A
–
+ X
–
Virtually all of A
–
is composed of albumin and phosphate. A
–
can be approximated by
2(albumin [in g/dl]) + 0.5(phosphate [mg/dl]). The value of X
–
is the actually the difference between all
unmeasured anions and all unmeasured cations Because unmeasured anions are typically greater than
unmeasured cations, the sign of X
–
is positive. If a ‘cation gap’ exists then the convention is to refer to this
as a negative anion gap
Anion gap – A
–
SIG Anion gap – A
–
approximates SIG, except that anion gap does not consider Mg
2+
, Ca
2+
, or lactate. Given
that A
–
+ X
–
= anion gap, it is tempting to equate SIG and X
–
. However, SIG will change if unmeasured weak
acids (A
–
X
) are present as well, so actually SIG = X
–
+ A
–
X
N/A A
TOT
A
TOT
= A
–
+ AH
Note that the translation from traditional to physical chemical variables is not a one to one exchange. Rather, the variable in the traditional column
corresponds to a similar variable in the physical chemical column (see comments for further explanation). Adapted with permission from Kellum
[10]. A
–
, nonvolatile weak acid buffers; ABE, actual base excess; AH, nondissociated weak acid; A
TOT
, total weak acids; PCO
2
, partial carbon
dioxide tension; SBE, standard base excess; SID, strong ion difference; SIDa, apparent strong ion difference; SIDe, effective strong ion difference;
SIG, strong ion gap; X
–
, unmeasured anions – unmeasured cations.
505
be accompanied by a PCO
2
that conforms to both formula
([1.5 × HCO
3
–
] + 8) and (40 + SBE), and indeed the PCO
2
of 20 mmHg fits this expectation. So, we can be assured that
this is a pure metabolic acidosis, but what is the cause?
The first step in determining the likely etiology should be to
determine the type of causative anion. Specifically, is the
metabolic acidosis due to measured or unmeasured anions?
The AG is 20 mEq/l so this is a positive AG acidosis, and
lactate is elevated so this is a lactic acidosis. However, are
unmeasured anions also present? Is there a hyperchloremic
acidosis as well? Could there be metabolic alkalosis?
An advantage of quantitative acid–base physiology is its
ability to determine the size of each effect. Using data
obtained 1 month before the current presentation, one can
see that there was already a metabolic acidosis even then,
and that the SID – whatever value it was – was approximately
8 mEq/l lower than at equilibrium (the point at which pH =
7.4 and P
CO
2
= 40). At that time the 8 mEq/l was accounted
for by approximately 4 mEq/l of unmeasured anion (both AGc
and SIG are approximately 4), and the remaining 4 mEq/l
was, by definition, hyperchloremic. Note that the plasma Cl
–
concentration need not be increased; indeed, in this case the
107 mmol/l is still within the normal range. However, for the
Available online />Table 2
Typical case of metabolic acidosis
Parameter 1 month ago At presentation After resuscitation
Na
+
(mmol/l) 130 130 135
K
+
(mmol/l) 3.5 3.0 2.8
Cl
–
(mmol/l) 107 105 115
HCO
3
–
(mmol/l) 16 8 6
Creatinine (mg/dl [µmol/l]) 2.8 (244) 2.9 (250)
Albumin (g/dl [g/l]) 2.0 (20) 2.3 (23) 1.8 (18)
PO
4
(mg/dl [mmol/l]) 4.5 (1.5) 4.8 (1.6) 4.2 (1.4)
Lactate (mmol/l) 1? 5 3
ABG 7.36/30/70 7.18/20/80 7.06/20/80
SBE (mEq/l) –9 –20 –23
SBEc (mEq/l) –8 –18 –20
AG (mEq/l) 10.5 20 17
AGc (mEq/l) 4.2 8 9.3
SIG (mEq/l) 3.8 9.2 10.3
A 55-year-old female with a history of hypertension and chronic renal insufficiency presents with fever, chills and arterial hypotension (blood
pressure 80/40 mmHg). She is resuscitated with approximately 140 ml/kg of 0.9% saline solution. The lactate value from 1 month ago is unknown
and assumed to be normal. Laboratory values are shown in American units (SI units in parentheses). ABG, arterial blood gas (pH/PCO
2
/PO
2
); AG,
anion gap; AGc, corrected anion gap; SBE, standard base excess; SBEc, corrected standard base excess; SIG, strong ion gap.
Table 3
Acid–base patterns observed in humans
Disorder HCO
3
–
(mEq/l) P
CO
2
(mmHg) SBE (mEq/l)
Metabolic acidosis <22 = (1.5 × HCO
3
–
) + 8 = 40 + SBE < –5
Metabolic alkalosis >26 = (0.7 × HCO
3
–
) + 21 = 40 + (0.6 × SBE) > +5
Acute respiratory acidosis = ([P
CO
2
– 40]/10) + 24 >45 = 0
Chronic respiratory acidosis = ([P
CO
2
– 40]/3) + 24 >45 = 0.4 × (PCO
2
– 40)
Acute respiratory alkalosis = 24 – ([40 – P
CO
2
]/5) <35 = 0
Chronic respiratory alkalosis = 24 – ([40 – P
CO
2
]/2) <35 = 0.4 × (PCO
2
– 40)
Adapted with permission from Kellum [7]. PCO
2
, partial carbon dioxide tension; SBE, standard base excess.
506
Critical Care October 2005 Vol 9 No 5 Kellum
concentration of Na
+
at that time (130 mmol/l), the Cl
–
was
certainly increased. The diagnosis of hyperchloremic acidosis
is made by exclusion (i.e. metabolic acidosis not due to
lactate or unmeasured anions).
This combination of hyperchloremic and SIG acidosis is
common in renal failure [49] and, given that this patient has
significant chronic renal insufficiency, it is likely that this is the
cause. At presentation, however, she now has a SBE that is
roughly 10 mEq/l lower than it was 1 month ago. The
decrease appears to have resulted from lactate (increased by
4 mEq/l) and other anions (SIG increased by 5 mEq/l). It is
tempting to attribute the increase in lactate to shock, but
many other etiologies have been identified for
hyperlactatemia that could be responsible for the increase in
this patient [50]. The increase in SIG could be due to a
variety of factors, including poisons (e.g. salicylate, methanol,
etc.), ketones, and other organic acids such as sulfate [7,11].
Under the appropriate clinical conditions, these diagnoses
should be perused. However, sepsis [38] and shock [44]
also appear to increase SIG through unknown mechanisms,
and this may well be the cause in this case. Furthermore, the
SIG before resuscitation appears to correlate (inversely) with
outcome [44,48].
There does not appear to be any evidence of additional
hyperchloremic acidosis because the change in SBE is
almost completely explained by lactate and SIG. Neither is
there evidence of metabolic alkalosis, which would be
manifest by a SBE that was higher (less negative) than
predicted from the SIG and lactate. These complex
acid–base disorders can only be unmasked with the use of
quantitative techniques or, at least, semiquantitative
techniques using SBE, as illustrated here.
Finally, this patient was resuscitated with a large volume of
saline solution (SID = 0). The net effect of this solution on
blood pH is determined by the opposing effects of decreasing
SID (acidifying) and decreasing A
TOT
(alkalinizing). Because
the strong ions have a somewhat greater impact on pH than
do weak acids (which are weak after all), the net effect is an
acidosis [43,51]. Thus, in the final column of Table 2 we have
an SBEc of –20 mEq/l. This increased acidosis is due to an
increase in Cl
–
relative to Na
+
(approximately 5 mEq/l change)
and an increase in SIG (1 mEq/l). These effects are partially
offset by a decrease in lactate (2 mEq/l) and a decrease in
A
TOT
(approximately equal to a 2 mEq/l decrease). Thus, the
2 mEq/l worsening in SBEc is explained by each of these
components (5 + 1 – 2 – 2 = 2).
Conclusion
Recent advances in whole body acid–base physiology as
well as epidemiology have resulted in a much clearer picture
of metabolic acid–base disturbances in the critically ill and
injured. It is now possible to ‘reunify’ traditional descriptive
approaches to acid–base balance with modern quantitative
techniques. This unified approach is both simple and
transparent and can be easily used at the bedside. It should
also aid in accessing and interpreting the bulk of the clinical
literature. As has already been the trend, newer studies of
acid–base physiology will no doubt take advantage of
quantitative techniques while continuing to report more
traditional variables.
Competing interests
JK has filed a patient disclosure for a software product
related to this field (in general).
References
1. Corey HE: Stewart and beyond: New models of acid-base
balance. Kidney Int 2003, 64:777-787
2. Corey HE: Fundamental principles of acid–base physiology.
Crit Care 2005, 9:184-192.
3. Wooten EW: Analytic claculation of physiological acid-base
parameters in plasma. J Appl Physiol 1999, 86:326-334.
4. Wooten EW: Calculation of physiological acid-base parame-
ters in multicompartment systems with application to human
blood. J Appl Physiol 2003, 95:2333-2344.
5. Wooten EW: Quantitative acid-base physiology using the
Stewart model. Crit Care 2004, 8:448-452.
6. Shayakul C, Alper SL: Defects in processing and trafficking of
the AE1 Cl-/HCO3- exchanger associated with inherited
distal renal tubular acidosis. Clin Exp Nephrol 2004, 8:1-11
7. Kellum JA: Determinants of blood pH in health and disease.
Crit Care 2000, 4:6-14.
8. Kellum JA, Bellomo R, Kramer DJ, Pinsky MR: Splanchnic buffer-
ing of metabolic acid during early endotoxemia. J Crit Care
1997, 12:7-12.
9. Schlichtig R, Grogono AW, Severinghaus JW: Human PaCO
2
and standard base excess compensation for acid-base imbal-
ance. Crit Care Med 1998, 26:1173-1179.
10. Kellum JA: Making strong ion difference the “Euro” for bedside
acid-base analysis. In Yearbook of Intensive Care and Emer-
gency Medicine. Edited by Vincent JL. Berlin: Springer-Verlag;
2005:675-685.
11. Kellum JA: Determinants of plasma acid-base balance. Crit
Care Clin 2005, 21:329-346.
12. Stewart P: Modern quantitative acid-base chemistry. Can J
Physiol Pharmacol 1983, 61:1444-1461.
13. Stewart PA: How to Understand Acid-base: A Quantitative Acid-
base Primer for Biology and Medicine, 1st ed. New York: Else-
vier; 1981.
14. Kellum JA. Acid base pHorum. [ />cation/resources/phorum.html]
15. Lloyd P: Strong ion calculator. [ />lloyd1/FileSharing8.html]
16. Kellum JA: Acid-base physiology in the post-Copernican era.
Curr Opin Crit Care 1999, 5:429-435.
17. Magder S: Pathophysiology of metabolic acid-base distur-
bances in patients with critical illness. In Critical Care Nephrol-
ogy. Edited by Ronco C, Bellomo R. Dordrecht, The Netherlands:
Kluwer Academic Publishers; 1997:279-296.
18. Constable PD: A simplified strong ion model for acid-base
equilibria: Application to horse plasma. J Appl Physiol 1997,
83:297-311.
19. Fernandez PC, Cohen RM, Feldman GM: The concept of bicar-
bonate distribution space: the crucial role of body buffers.
Kidney Int 1989, 36:747-752.
20. Garella S, Dana CL, Chazan JA: Severity of metabolic acidosis
as a determinant of bicarbonate requirements. N Engl J Med
1973, 289:121-126.
21. Androgue HJ, Brensilver J, Cohen JJ, Madias NE: Influence of
steady-state alterations in acid-base equilibrium on the fate
of administered bicarbonate in the dog. J Clin Invest 1983, 71:
867-883.
22. Singer RB, Hastings AB: An improved clinical method for the
estimation of disturbances of the acid-base balance of human
blood. Medicine (Baltimore) 1948, 27:223-242.
507
Available online />23. Astrup P, Jorgensen K, Siggaard-Andersen O: Acid-base metab-
olism: New approach. Lancet 1960, 1:1035-1039.
24. Siggaard-Andersen O: The pH-log PCO2 blood acid-base
nomogram revised. Scand J Clin Lab Invest 1962, 14:598-604.
25. Grogono AW, Byles PH, Hawke W: An in vivo representation of
acid-base balance. Lancet 1976, 1:499-500.
26. Severinghaus JW: Acid-base balance nomogram – a Boston-
Copenhagen détente. Anesthesiology 1976, 45:539-541.
27. Siggaard-Andersen O: The Acid-base Status of the Blood, 4th
ed. Baltimore, MD: William and Wilkins; 1974,
28. Siggaard-Andersen O: The Van Slyke equation. Scand J Clin
Lab Invest 1977, 146:15-20.
29. Brackett NC, Cohen JJ, Schwartz WB: Carbon dioxide titration
curve of normal man. N Engl J Med 1965, 272:6-12.
30. Prys-Roberts C, Kelman GR, Nunn JF: Determinants of the in
vivo carbon dioxide titration curve in anesthetized man. Br J
Anesth 1966, 38:500-550.
31. Figge J, Mydosh T, Fencl V: Serum proteins and acid-base
equilibria: a follow-up. J Lab Clin Med 1992, 120:713-719.
32. Narins RG, Emmett M: Simple and mixed acid-base disorders:
A practical approach. Medicine (Baltimore) 1980, 59:161-187.
33. Sadjadi SA: A new range for the anion gap. Ann Intern Med
1995, 123:807-808.
34. Winter SD, Pearson R, Gabow PG, Schultz A, Lepoff RB: The fall
of the serum anion gap. Arch Intern Med 1990, 150:3113-3115.
35. Salem MM, Mujais SK: Gaps in the anion gap. Arch Intern Med
1992, 152:1625-1629.
36. Gilfix BM, Bique M, Magder S: A physical chemical approach to
the analysis of acid-base balance in the clinical setting. J Crit
Care 1993, 8:187-197.
37. Kellum JA, Kramer DJ, Pinsky MR: Strong ion gap: a methodology
for exploring unexplained anions. J Crit Care 1995, 10:51-55.
38. Kellum JA, Bellomo R, Kramer DJ, Pinsky MR: Hepatic anion flux
during acute endotoxemia. J Appl Physiol 1995, 78:2212-2217.
39. Moviat M, van Haren F, van der Hoeven H: Conventional or
physicochemical approach in intensive care unit patients with
metabolic acidosis. Crit Care 2003, 7:R41-R45.
40. Balasubramanyan N, Havens PL, Hoffman GM: Unmeasured
anions identified by the Fencl-Stewart method predict mortal-
ity better than base excess, anion gap, and lactate in patients
in the pediatric intensive care unit. Crit Care Med 1999, 27:
1577-1581.
41. Cusack RJ, Rhodes A, Lochhead P, Jordan B, Perry S, Ball JAS,
Grounds RM, Bennett ED: The strong ion gap does not have
prognostic value in critically ill patients in a mixed medical/
surgical adult ICU. Intensive Care Med 2002, 28:864-869.
42. Rocktaschel J, Morimatsu H, Uchino S, Bellomo R: Unmeasured
anions in critically ill patients: can they predict mortality? Crit
Care Med 2003, 31:2131-2136.
43. Kellum JA, Bellomo R, Kramer DJ, Pinsky MR: Etiology of meta-
bolic acidosis during saline resuscitation in endotoxemia.
Shock 1998, 9:364-368.
44. Kaplan L, Kellum JA: Initial pH, base deficit, lactate, anion gap,
strong ion difference, and strong ion gap predict outcome
from major vascular injury. Crit Care Med 2004, 32:1120-1124.
45. Dondorp AM, Chau TT, Phu NH, Mai NT, Loc PP, Chuong LV,
Sinh DX, Taylor A, Hien TT, White NJ, Day NP: Unidentified
acids of strong prognostic significance in severe malaria. Crit
Care Med 2004, 32:1683-1688.
46. Kellum JA: Closing the gap on unmeasured anions. Crit Care
2003, 7:219-220.
47. Hayhoe M, Bellomo R, Liu G, McNicol L, Buxton B: The aetiology
and pathogenesis of cardiopulmonary bypass-associated
metabolic acidosis using polygeline pump prime. Intensive
Care Med 1999, 25:680-685.
48. Durward A, Tibby SM, Skellett S, Austin C, Anderson D, Murdoch
IA: The strong ion gap predicts mortality in children following
cardiopulmonary bypass surgery. Pediatr Crit Care Med 2005,
6:281-285.
49. Rocktaschel J, Morimatsu H, Uchino S, Goldsmith D, Poustie S,
Story D, Gutteridge G, Bellomo R: Acid-base status of critically
ill patients with acute renal failure: analysis based on Stewart-
Figge methodology. Crit Care 2003, 7:R60-R66.
50. Kellum JA, Kramer DJ, Lee K, Mankad S, Bellomo R, Pinsky MR:
Release of lactate by the lung in acute lung injury. Chest
1997, 111:1301-1305.
51. Morgan TJ, Venkatesh B, Hall J: Crystalloid strong ion differ-
ence determines metabolic acid-base change during in vitro
hemodilution. Crit Care Med 2002, 30:157-160.