Báo cáo khoa học: " Application of a population-based severity scoring system to individual patients results in frequent misclassification" doc
Bạn đang xem bản rút gọn của tài liệu. Xem và tải ngay bản đầy đủ của tài liệu tại đây (412.73 KB, 8 trang )
Open Access
Available online />R522
Vol 9 No 5
Research
Application of a population-based severity scoring system to
individual patients results in frequent misclassification
Frank V Booth
1
, Mary Short
2
, Andrew F Shorr
3
, Nancy Arkins
4
, Becky Bates
5
, Rebecca L Qualy
6
and Howard Levy
7
1
Medical Fellow, Eli Lilly and Company, Indianapolis, IN, USA
2
Associate Clinical Research Scientist, Eli Lilly and Company, Indianapolis, IN, USA
3
Associate Director of Pulmonary Critical Care Medicine, Pulmonary and Critical Care Medicine, Washington Hospital Center, Washington, DC, USA
and Associate Professor of Medicine, Georgetown University, Washington, DC, USA
4
Senior Clinical Development Associate, Eli Lilly and Company, Indianapolis, IN, USA
5
Associate Senior Statistician, Eli Lilly and Company, Indianapolis, IN, USA
6
Senior Scientific Communication Associate, Eli Lilly and Company, Indianapolis, IN, USA
7
Medical Director, Eli Lilly and Company, Indianapolis, IN, USA+
Corresponding author: Frank V Booth,
Received: 6 May 2005 Revisions requested: 15 Jun 2005 Revisions received: 1 Jul 2005 Accepted: 12 Jul 2005 Published: 9 Aug 2005
Critical Care 2005, 9:R522-R529 (DOI 10.1186/cc3790)
This article is online at: />© 2005 Booth et al.; licensee BioMed Central Ltd.
This is an Open Access article distributed under the terms of the Creative Commons Attribution License ( />2.0), which permits unrestricted use, distribution, and reproduction in any medium, provided the original work is properly cited.
Abstract
Introduction APACHE II (AP2) was developed to allow a
systematic examination of intensive care unit outcomes in a risk
adjusted manner. AP2 has been widely adopted in clinical trials
to assure broad consistency amongst different groups.
Although errors in calculating the true AP2 score may not be
reducible below 15%, the self-canceling effect of random errors
reduces the importance of such errors when applied to large
populations. It has been suggested that a threshold AP2 score
be used in clinical decision making for individual patients. This
study reports the AP2 scoring errors of researchers involved in
a large sepsis trial and models the consequences of such an
error rate for individual severe sepsis patients.
Methods Fifty-six researchers with explicit training in data
abstraction and completion of the AP2 score received scenarios
consisting of composites of real patient histories. Descriptive
statistics were calculated for each scenario. The standard
deviations were calculated compared with an adjudicated
score. Intraclass correlations for inter-observer reliability were
performed using Shrout-Fleiss methodology. Theoretical
distribution curves were calculated for a broad range of AP2
scores using standard deviations of 6, 9 and 12. For each curve,
the misclassification rate was determined using an AP2 score
cut-off of ≥25. The percentage of misclassifications for each
true AP2 score was then applied to the corresponding AP2
score obtained from the PROGRESS severe sepsis registry.
Results The error rate for the total AP2 score was 86%
(individual variables were in the range 10% to 87%). Intraclass
correlation for the inter-observer reliability was 0.51. Of the
patients from the PROGRESS registry. 50% had AP2 scores in
the range 17 to 28. Within this interquartile range, 70% to 85%
of all misclassified patients would reside.
Conclusion It is more likely that an individual patient will be
scored incorrectly than correctly. The data obtained from the
scenarios indicated that as the true AP2 score approached an
arbitrary cut-off point of 25, the observed misclassification rate
increased. Integrating our study of AP2 score errors with the
published literature leads us to conclude that the AP2 is an
inappropriate sole tool for resource allocation decisions for
individual patients.
Introduction
The Acute Physiology and Chronic Health Evaluation II
(APACHE II) scoring system was originally developed as a tool
for comparing the outcomes of acute disease in critically ill
patients across multiple intensive care units in a therapy-inde-
pendent fashion [1]. Although relatively few critical care units
have adopted this system or its successor, APACHE III, for
this purpose, APACHE II has found widespread application in
clinical trials as a tool both for stratification of patient popula-
tions and as a means of demonstrating acceptable baseline
APACHE II = Acute Physiology and Chronic Health Evaluation II.
Critical Care Vol 9 No 5 Booth et al.
R523
balance amongst subgroups within a given trial. In large
groups of patients, it has repeatedly been demonstrated that
there is excellent correlation between APACHE II score and
risk of death. The actual mortality risk predicted by this scoring
system varies considerably with the underlying diagnosis and
from country to country. The developers of APACHE II have
emphasized that an accurate classification of the underlying
disease state is essential for the accuracy of the predictive
model [1].
The total APACHE II score is derived by summing points from
three distinct categories: acute physiologic derangements (12
individual elements); age points; and points for the presence
of certain specific chronic health conditions or medical situa-
tions. Within the acute physiologic score, three elements
require additional decisions or preparatory calculation: the
Glasgow coma score; an assessment of pulmonary function;
and a decision if an abnormal value of creatinine represents
acute or chronic renal failure. The difficulties of reliably deter-
mining Glasgow Coma Score have been well documented. In
assessing pulmonary function, depending on the fraction of
inspired oxygen (F
i
O
2
), either the arterial partial oxygen pres-
sure (pO
2
) or the alveolar-arterial oxygen gradient (A-a DO
2
)
must be used. The calculation of the latter requires the suc-
cessful application of the alveolar gas equation, which in turn
requires knowledge of average local atmospheric pressure.
These numerous and complex data manipulations required to
calculate the APACHE II score introduce many opportunities
for error in the determination of an individual patient's points
total. The combination of many elements into a composite
score means that there are literally thousands of data permu-
tations, which may be recorded to produce an identical
APACHE II score.
This retrospective study reports the APACHE II scoring error
rates for three case scenarios calculated by Clinical Research
Associates and Research Coordinators involved in a large ran-
domized placebo-controlled critical care clinical trial. We
examined the effects of these scoring error rates on the ability
to correctly classify an individual into either having an
APACHE II score above or below a cut-off score of 25. In addi-
tion, we used a large database of patients with severe sepsis
to estimate the distribution of reported APACHE II scores.
Combining this known distribution of APACHE II scores and
our estimated misclassification rates, we estimated the overall
frequency of misclassification of individual severe sepsis
patients into categories of having an APACHE II score above
or below 25.
Methods
Study participants
Fifty-six individuals (clinical research associates (n = 17) and
study coordinators (n = 39), associated with the ADDRESS
clinical trial) returned completed case scenarios used in this
study. Demographic data on these individuals were not
obtained. All received explicit training in data abstraction and
recording for the ADDRESS trial, a multi-institutional investiga-
tion of drotrecogin alfa (activated) in severe sepsis. Study pro-
cedures for this trial required that APACHE II score be
obtained at baseline, either from the medical record if this cal-
culation was part of the clinical routine at the specific institu-
tion or as a study-specific determination. The study
coordinators came from individual participant sites in the
ADDRESS trial and were either employees or associates of
the principal investigators at those sites. The clinical research
associates were either employees of Eli Lilly and Company or
of a contract research organization engaged by Lilly to assist
in the conduct of the ADDRESS trial. The case scenarios,
instructions and scoring sheets for APACHE II were distrib-
uted to the participants at the beginning of a two-day study ini-
tiation meeting and were returned at its conclusion.
Participants completed these forms individually. No con-
straints were applied on the time allowed for completion. Par-
ticipants were given the option of returning the score sheets
anonymously or with their names included (for the purpose of
receiving feedback). Almost without exception, score sheets
were returned bearing the participant's name, but were subse-
quently obliterated and replaced with an anonymous identifier
for the purposes of data analysis for this study.
Case scenarios
Three individual case scenarios were developed using com-
posites of real patient histories and laboratory values. Each
scenario consisted of several elements but all contained at a
minimum: a multi-page critical-care vital signs flow sheet (with
multiple and frequent observations of pulse rate, blood pres-
sure, respiratory rate, components of the Glasgow coma
score, etc.); and a laboratory values report in the form of a
spreadsheet, typically covering a 48 h period and including 18
routine chemistries, cardiac enzymes, arterial and venous
blood gas values as well as routine hematology results. The
third element of the scenario was a narrative summary of the
patient's clinical course. In many cases this summary con-
tained items of relevance to the calculation of an APACHE II
score, such as times of landmark events, and physiologic val-
ues observed in the pre-hospital or emergency room environ-
ment. The participants were given a standardized APACHE II
scoring sheet and instruction set.
Adjudicated APACHE II score
Two of the authors (MS and FVMcLB) independently scored
each clinical scenario on two separate occasions approxi-
mately two weeks apart. A consensus-forming session was
then held at which every individual contributing element of the
APACHE II score was reviewed, agreed upon and an adjudi-
cated point value determined. For one of the scenarios
(APACHE II score = 22) the agreed aggregate point value was
identical to the value calculated by the two observers inde-
pendently. For the other two, an adjustment of a single point
Available online />R524
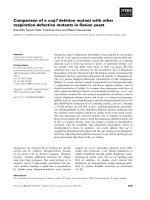
Figure 1
Results of the scoring exerciseResults of the scoring exercise. The results of the scoring exercise completed by researchers involved in a large randomized placebo-controlled crit-
ical care trial illustrating individual scores, standard deviations and inter-quartile ranges of case scenarios with adjudicated total APACHE II scores of
44, 22 and 19.
1
Correct classification is determined by the adjudicated score being either APACHE II ≥25 or APACHE II <25.
2
Standard deviation
is calculated using the adjudicated APACHE II score in place of the mean APACHE II score.
Critical Care Vol 9 No 5 Booth et al.
R525
was agreed upon. These consensus values were then used as
the adjudicated values against which the scores of the study
participants were measured.
Statistical methodology
Descriptive statistics (mean, median, inter-quartile range) were
calculated for each scenario. The standard deviations were
calculated using the adjudicated APACHE II value in place of
the mean reported APACHE II score.
Intraclass correlations for inter-observer reliability were per-
formed using Shrout-Fleiss methodology [2]. The intraclass
correlation used in this study assumed the same observers
scored the three scenarios, although each scenario was a ran-
dom subset of all possible observers. In the second phase of
this study, it was assumed that for any given population of
patients with an identical true APACHE II score, the distribu-
tion of possible APACHE II scores would be approximately
normal. Theoretical distribution curves were calculated for
each true APACHE II score using standard deviations of 6, 9
and 12. For each distribution curve, the misclassification rate
was determined in the following manner. If the true score was
<25, misclassification was represented by the area of the dis-
tribution curve above or equal to 25. If the true score was ≥25,
misclassification was represented by the area of the distribu-
tion curve below 25.
A large sample of APACHE II scores (n = 5,253) was obtained
from the PROGRESS registry, a collaborative web-based reg-
istry of severe sepsis patients admitted to over sixty intensive
care units worldwide [3]. The percentage of misclassifications
for each true APACHE II score estimated in the second phase
of this study was applied to the corresponding scores in this
large sample of APACHE II scores. An overall misclassification
rate was estimated by summing the misclassifications for each
APACHE II score from this sample.
Results
Not every participant completed every case scenario; the com-
pletion rate was 159/168 (94.6%). Fifteen participants
returned composite scores only. The three different scenarios
had widely differing adjudicated APACHE II scores. The sce-
nario with an adjudicated score of 44 was most frequently
scored incorrectly (52/56, 92.9% incorrect). The accuracy of
scoring was better for the other two scenarios whose adjudi-
cated scores were markedly lower (score = 22: 45/52, 86.5
% incorrect; score = 19: 41/43, 77.4% incorrect). In only two
of the numerically correct total scores did the participant arrive
at their answers by a balanced combination of errors.
In contrast to the scenario with a score of 44 in which all but
one of the erroneous scores underestimated the true
APACHE II score, the distribution of the erroneous scores
assumed a more normal random distribution for scenarios with
scores of 19 and 22. The intraclass correlation for the inter-
observer reliability was 0.51, 95% CI (0.22–0.98). The results
of the scoring exercise, individual scores, standard deviations
and interquartile ranges are shown in Fig. 1.
Table 1 lists the error rate for each component of the APACHE
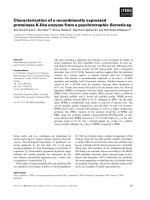
II score. Fig. 2 shows the theoretical distribution curves of five
true values of APACHE II scores. The areas shaded show the
proportion of scores that would result in a misclassification
using an APACHE II score cut-off of 25 or greater. The value
of 25 was chosen because it has been suggested that this
value may be used to identify a patient at high risk of death
from severe sepsis. The effect of varying the assumed stand-
ard deviation is also shown. The proportion of misclassification
increases as the true score approaches the cut-off score of
25. The highest rate of misclassification occurs when the true
score equals the cut-off score.
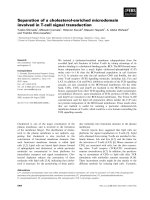
Fig. 3 shows the relative frequency of APACHE II scores
observed in a population of severe sepsis patients
(PROGRESS Registry). The lightly shaded areas in Fig. 3
show the estimated distribution of misclassification rates of
individuals with severe sepsis into groups of scores <25 and
≥25 based on the estimated misclassification rates from the
theoretical distribution curves. Using this distribution of
APACHE II scores from the PROGRESS registry, 50% of
severe sepsis patients have APACHE II scores ranging from
Table 1
Error rates of combined case study data for each component of
the APACHE II score
Acute physiologic score (A) Error rates
Temperature (rectal/core) 48%
Mean arterial pressure 59%
Heart rate (ventricular response) 46%
Respiratory rate (non-ventilated
or ventilated)
45%
Oxygenation 52%
Arterial pH 38%
Serum sodium 29%
Serum potassium 26%
Serum creatinine 43%
Hematocrit 33%
White blood count 49%
Glasgow Coma Scale 69%
Total acute physiology score (A) 87%
Age points (B) 10%
Chronic health points (C) 34%
Total APACHE II score (A+B+C) 86%
Available online />R526
17 to 28. Within this interquartile range will reside 70% to
85% of all misclassified patients (depending on the underlying
standard deviation of the APACHE II scores).
Discussion
Our observations concerning the accuracy and inter-observer
variability of deriving APACHE II scores in a simulated clinical
setting are concordant with those of Polderman et al. [4] and
Chen et al. [5], although the absolute magnitude of the errors
we report is larger. Fig. 1 shows the differing distributions of
erroneously calculated scores. The scenario with a score of 44
has a mean and median that substantially underestimate the
adjudicated APACHE II score, whereas the distribution of
errors in the other two scenarios resulted in a mean and
median within three APACHE II points of the adjudicated
score. This would be considered statistically indistinguishable
from the adjudicated value and acceptable from a scientific
sampling point of view when comparing population intensive
care unit outcomes, or the success of randomizing patients
into subgroups with comparable severity.
Furthermore, it should be noted that in our study, Glasgow
coma scores as recorded in the flow sheets were assumed to
be accurate. In nursing practice, errors in reporting of Glas-
gow coma scores, especially for the intubated patient, are well
documented [6]. APACHE II methodology requires that
scores for creatinine intervals be doubled for acute renal fail-
ure. Overall, creatinine points were assessed incorrectly 43%
of the time. In one of the scenarios, however, all the creatinine
values were within normal limits. Thus, on the score sheets
where the creatinine score should have been doubled, this
step was omitted on 64 of a possible 72 (89%) occasions,
making omission of this step in practice the most frequent
error seen.
In this simulation the practitioners were provided with a sum-
mary clinical abstract, which was assumed to contain all the
relevant clinical and time-line information. In the clinical envi-
ronment such information is frequently intimately interwoven
with extraneous confusing and irrelevant matter within a com-
plex clinical chart. This likely increases the possibility that an
important point of information may be overlooked. Table 1
demonstrates that even invariable information such as age was
incorrectly abstracted or assigned to the incorrect interval that
determines the score for that parameter, and that for many
parameters an incorrect value was more likely to be assigned
than a correct value. In selecting the range of standard devia-
tion used for the illustrative theoretical curves (Fig. 2), we
Figure 2
Theoretical distributions of APACHE II scores with varying SDsTheoretical distributions of APACHE II scores with varying SDs. A set of theoretical distributions of reported APACHE II scores based on standard
deviations of 6 and 12 (which were what we observed in the case scenario data.) For the purposes of comparison, a set of curves using an interme-
diate standard deviation of 9 is also shown. In every curve, the shaded area illustrates the theoretical probability of misclassification based on a cut-
off score of ≥25.
Critical Care Vol 9 No 5 Booth et al.
R527
relied on values observed in the case scenarios (standard
deviations of 6 and 12), and arbitrarily included a standard
deviation of 9.
In reviewing the technical literature of APACHE II, two distinct
approaches are seen: the overall performance of the score as
an outcome predictor for groups of patients; and the perform-
ance of small groups of individuals in achieving accuracy and
reproducibility of the actual APACHE II score. With regard to
the much more frequent reporting of overall performance of
the score as an outcome predictor for groups of patients, all of
these types of studies have the underlying assumption that
there is a sufficiently large patient sample size to ensure that
any effect of individual error in determining the APACHE II
score is trivial in comparison to the underlying trend of the
group as a whole. In this guise the tool has been used to
predict the outcome of classes of patients as varied as those
with acute pancreatitis to patients with acute community
acquired pneumonia. The original authors of the APACHE II
system emphasized that although the APACHE II score was
highly correlated with risk of death, an individual score could
not be translated into a specific risk of death without taking
into account the underlying diagnosis [1]. Thus in a large
group of patients, all with an APACHE II score of 22 and the
same clinical diagnosis, for example pneumonia, the risk of
death would be very similar. However, the risk of death would
not necessarily be the same as another group of patients also
with an APACHE II score of 22 who had a different underlying
diagnosis, for example, ascending cholangitis. A specific
example of this was cited in the original paper [1]. Despite the
different weighting given to the presence of chronic health
conditions in the emergency surgical patient, there was still a
substantial difference in observed mortality between medical
and surgical patients. APACHE II seems to perform less well
in surgical patients [7]. These cited limitations clearly show
that applying a single APACHE II score cut-off to determine
high risk of death to all classes of patients is less than optimal.
The second type of review has focused on the performance of
small groups of individuals in achieving accuracy and repro-
ducibility of the actual APACHE II. As Rowley and Fielding [6]
have shown, inter-rater reliability alone is insufficient grounds
for confidence in the accuracy of real-world APACHE II
scores. In studies where the accuracy of an individual
APACHE II determination is the main focus of attention, the
number of cases that can be studied is necessarily limited
given the intensive effort required to determine what the 'gold
standard' value really is. We are not aware of any studies that
attempt to examine the consequences of random or system-
atic errors on the performances of the APACHE II predictive
model.
Although the absolute rate of erroneous APACHE II score
determination that we have reported appears to be higher than
that reported either by Polderman et al. [4] or Chen et al. [5],
Figure 3
Distribution of reported APACHE II scores in the PROGRESS registryDistribution of reported APACHE II scores in the PROGRESS registry.
The darker shading (outer envelope) of these plots represents the
observed distribution of APACHE II scores of 5,253 severe sepsis
patients in the PROGRESS registry. The lighter shading (inner enve-
lope) is calculated by applying the probability of misclassification for
each individual APACHE II score based on assumed standard deviation
(SD) of (from top to bottom) 6, 9 and 12 and on an APACHE II cut-off
score ≥25.
Available online />R528
this may be largely attributable to the greater severity of
physiologic derangements used in our simulations. Thus, the
mean and median APACHE II score in Polderman's repeat
scoring exercise was 14.3 (± 4.4) and 13.9 before rigorous
training and 18.9 (± 2.4) and 16.2 after training. They do not
provide adjudicated or 'gold standard' values for the individual
patients they studied, so that strict comparisons of accuracy
as opposed to inter-rater agreement cannot be made. The sim-
ulations we used had APACHE II scores of 19, 22 and 44. The
opportunity for error rises almost geometrically with the
number of deranged physiologic variables, which likely
explains the higher standard deviation we observed in the sim-
ulations with the higher APACHE II scores. The overall intra-
class correlation which we report (0.51) lies between the
worst individual component value reported by Chen et al. [5]
(for Glasgow Coma Score at 0.315) and the best (for age at
0.976). We did not perform intra-class correlations for individ-
ual elements of the APACHE II score. Despite the intrinsic
variability noted by Chen et al. [5], when groups of patients
were compared (as was intended by the designers of the orig-
inal tool) the correlation was excellent.
The inter-rater reliability noted in this investigation (0.51) can,
at best, be described as only fair. From a research perspective
this underscores the potential bias in any critical care study
relying on the APACHE II score either for entry into a trial or for
analysis of baseline severity of illness. Moreover, if in the future
novel therapies are to be targeted based on such a criterion,
many patients eligible for a therapy may be excluded whereas
others may be treated inappropriately. That we studied only
trained researchers reinforces this point, as it seems reasona-
ble to conclude that less specifically trained personnel or
clinicians will likely make more errors in the computation of the
APACHE II score. Future research in critical care might
include multiple measures of severity of illness to address this
limitation
Recently, it has been suggested that the APACHE II score
may be a useful tool to determine if a patient has a sufficient
risk of death to warrant treatment with drotrecogin alfa (acti-
vated). For a population of severe sepsis patients enrolled in
the PROWESS trial [8], the APACHE II score was the strong-
est indicator for distinguishing patients with a response to the
drug from the group that did not show a positive response [8].
Explicitly, the current US package insert for drotrecogin alfa
(activated) proposes an APACHE II score of 25 or greater as
a way to determine if a patient is at high risk of death [9]. Even
if it is assumed that APACHE II methodology is perfect for
resolving the arbitrary distinction between high risk of death
and not at high risk of death, the error rate in determining the
APACHE II score, which others have reported and which we
have confirmed, will ensure that significant numbers of
patients will be misclassified (i.e. they will be assigned to one
side of a 25 point threshold when their true score lies on the
other). There is a fundamental practical difference between
using a scoring system such as APACHE II for examining like-
lihood of death, and using it to determine if a severe sepsis
patient lies above or below an arbitrary threshold. In any given
intensive care unit population; the majority of survivors are
clustered at the low end of the APACHE II score range.
Deaths are concentrated at the high end. If, in a population of
patients, the observed mortality is plotted against APACHE II
score, at the low end of the range the curve is quite flat. A
change of score from 4 to 8 makes little difference to mortality;
the vast majority still survive. Likewise, at the upper end of the
range, above a score of about 40, most patients die, and
increasing the score by two or three points changes the mor-
tality little. In the mid-range of the curve, however, the mortality
versus APACHE II score is very steep. A change of one or two
points makes a large difference in the observed change in mor-
tality. Thus, when using a cut-off point that happens to lie in the
steepest region of the curve, the significance of scoring errors
is maximized. The closer a patient's true APACHE II score
approaches the cut-off point of 25, the higher the misclassifi-
cation rate (this trend is illustrated in Fig. 2). Unfortunately, a
cut-off value of 25 sits uncomfortably close to the median
APACHE II score of 22, seen in severe sepsis patients
admitted to intensive care units included in the PROGRESS
registry (Fig. 3). The chance of misclassification for a patient
lying within the inter-quartile range (17 to 28) is estimated to
be as high as 38%. This set of patients represents the popu-
lation of severe sepsis patients admitted to the intensive care
unit for whom the outcome is most in doubt. Because the
APACHE II scoring error rate estimates are based on a normal
distribution around the true APACHE II score, these misclas-
sification rates are conservative in nature, as the maximum mis-
classification rate can only be 50%. The real world
distributions of scoring errors, such as seen in the scenario
with APACHE II score of 22, suggest that occasionally the
misclassification rate can exceed 50%. If such a score is to be
used in a medical decision making process, the likely error rate
should be clearly understood, and serious attention should be
paid to maximizing the expertise and accuracy of those
responsible for the scoring process.
Conclusion
It is far more likely that an individual patient will be scored
incorrectly than correctly, even by a group of individuals
trained in scoring and chart abstraction. Even the scenario
with an adjudicated APACHE II score that placed it many
points distant from an arbitrary cut-off point of 25 was misclas-
sified at an unacceptably high rate. Observed misclassification
rate for the scenario with an adjudicated score within 3 points
of the cut-off was over 50%. Integrating our study of APACHE
II score errors with the published literature leads us to con-
clude that the APACHE II is an inappropriate sole tool for
resource allocation decisions for individual patients.
Critical Care Vol 9 No 5 Booth et al.
R529
Competing interests
FVMcLB, MS, NA, BB, RLQ and HL are full-time employees
and shareholders of Eli Lilly and Company. AFS has been a
paid consultant and speaker for Eli Lilly and Company.
Authors' contributions
All the authors have contributed to the composition, revision
and review of the manuscript and have read and approved the
final version. In addition, FVMcLB and MS conceived of the
idea for this manuscript, BB performed the statistical analysis,
RLQ edited the document and BB participated in obtaining
the original PROWESS data.
References
1. Knaus WA, Draper EA, Wagner DP, Zimmerman JE: APACHE II: a
severity of disease classification system. Crit Care Med 1985,
13:818-829.
2. Shrout PE, Fleiss JL: Intraclass correlations: uses in assessing
rater reliability. Psychological Bulletin 1979, 86:420-429.
3. Beale R, Reinhart K, Silva E, Dobb G, Sarwat S, Garg R, Vincent
JL: Comparison of PROGRESS Severe Sepsis Registry
patients to INDEPTH Integrated Severe Sepsis Clinical Trial
Database placebo patients. Chest Meeting Abstracts; Chest
2004, 126:864S. Abstract #496
4. Polderman KH, Thijs LG, Girbes AR: Interobserver variability in
the use of APACHE II scores. Lancet 1999, 353:380.
5. Chen LM, Martin CM, Morrison TL, Sibbald WJ: Interobserver
variability in data collection of the APACHE II score in teaching
and community hospitals. Crit Care Med 1999, 27:1999-2004.
6. Rowley G, Fielding K: Reliability and accuracy of the Glasgow
Coma Scale with experienced and inexperienced users. Lan-
cet 1991, 337:535-538.
7. Cerra FB, Negro F, Abrams J: APACHE II score does not predict
multiple organ failure or mortality in postoperative surgical
patients. Arch Surg 1990, 125:519-522.
8. Bernard GR, Vincent J-L, Laterre P-F, LaRosa SP, Dhainaut J-F,
Lopez-Rodriguez A, Steingrub JS, Garber GE, Helterbrand JD, Ely
EW, et al.: Efficacy and safety of recombinant human activated
protein C for severe sepsis. N Engl J Med 2001, 344:699-709.
9. Drotrecogin Alfa (activated) Product Label [ />us/xigris.pdf]
Key messages
• There are typically errors in execution of a complex scor-
ing scheme such as APACHE II.
• These errors do not have a significant effect when
applied to patient populations of a sufficient size.
• If a cut-off APACHE II score in the middle range of criti-
cally ill patients is used for making decisions about indi-
vidual patients, an error rate that may be considered
acceptable for use with sufficiently large patient popula-
tions will produce a very high rate of misclassification in
those individuals so classified.