Báo cáo khoa học: "Mortality prediction using SAPS II: an update for French intensive care units" doc
Bạn đang xem bản rút gọn của tài liệu. Xem và tải ngay bản đầy đủ của tài liệu tại đây (257.78 KB, 8 trang )
Open Access
Available online />R645
Vol 9 No 6
Research
Mortality prediction using SAPS II: an update for French intensive
care units
Jean Roger Le Gall
1
, Anke Neumann
2
, François Hemery
3
, Jean Pierre Bleriot
4
,
Jean Pierre Fulgencio
5
, Bernard Garrigues
6
, Christian Gouzes
7
, Eric Lepage
8
, Pierre Moine
9
and
Daniel Villers
10
1
Professor, head of the unit of Medical intensive, Hôpital Saint Louis, Paris, France
2
Statistician, Délégation à l'Information Médicale et Epidémiologie, AP-HP, Paris, France
3
Statistician, center of Biostatistique Médicale, Hôpital Henri Mondor, Créteil, France
4
Delegate to the Ministère de la Santé, Paris, France
5
Department of Anesthésie Réanimation, Hôpital Tenon, Paris, France
6
Professor, head of the unit of multidisciplinary internsive care, Centre hospitalier du Pays d'Aix, Aix en Provence, France
7
Epidemiologist, Information Médicale, Hôpital de Nimes, Nimes, France
8
Professor, Head of the Délégation à l'Information Médicale et Epidémiologie, AP-HP, Paris, and of the center of Biostatistique Médicale, Hôpital Henri
Mondor, Créteil, France
9
Department of Anesthesiology, University of Colorado Health Science Center, Denver, Colorado, USA
10
Professor, Head of the unit of Medical intensive care, Hôpital de l'Hotel Dieu, Nantes, France
Corresponding author: Jean Roger Le Gall,
Received: 2 Jun 2005 Revisions requested: 22 Jun 2005 Revisions received: 13 Aug 2005 Accepted: 8 Sep 2005 Published: 6 Oct 2005
Critical Care 2005, 9:R645-R652 (DOI 10.1186/cc3821)
This article is online at: />© 2005 Le Gall et al.; licensee BioMed Central Ltd.
This is an Open Access article distributed under the terms of the Creative Commons Attribution License ( />2.0), which permits unrestricted use, distribution, and reproduction in any medium, provided the original work is properly cited.
Abstract
Introduction The standardized mortality ratio (SMR) is
commonly used for benchmarking intensive care units (ICUs).
Available mortality prediction models are outdated and must be
adapted to current populations of interest. The objective of this
study was to improve the Simplified Acute Physiology Score
(SAPS) II for mortality prediction in ICUs, thereby improving
SMR estimates.
Method A retrospective data base study was conducted in
patients hospitalized in 106 French ICUs between 1 January
1998 and 31 December 1999. A total of 77,490 evaluable
admissions were split into a training set and a validation set.
Calibration and discrimination were determined for the original
SAPS II, a customized SAPS II and an expanded SAPS II
developed in the training set by adding six admission variables:
age, sex, length of pre-ICU hospital stay, patient location before
ICU, clinical category and whether drug overdose was present.
The training set was used for internal validation and the
validation set for external validation.
Results With the original SAPS II calibration was poor, with
marked underestimation of observed mortality, whereas
discrimination was good (area under the receiver operating
characteristic curve 0.858). Customization improved calibration
but had poor uniformity of fit; discrimination was unchanged.
The expanded SAPS II exhibited good calibration, good
uniformity of fit and better discrimination (area under the receiver
operating characteristic curve 0.879). The SMR in the validation
set was 1.007 (confidence interval 0.985–1.028). Some ICUs
had better and others worse performance with the expanded
SAPS II than with the customized SAPS II.
Conclusion The original SAPS II model did not perform
sufficiently well to be useful for benchmarking in France.
Customization improved the statistical qualities of the model but
gave poor uniformity of fit. Adding simple variables to create an
expanded SAPS II model led to better calibration, discrimination
and uniformity of fit, producing a tool suitable for benchmarking.
Introduction
The standardized mortality ratio (SMR) is commonly used to
assess the performance of intensive care units (ICUs) by com-
paring the observed hospital mortality with the mortality pre-
dicted by statistical models [1,2]. This approach is valid only
when it is used with models characterized by excellent
APACHE = Acute Physiology and Chronic Health Evaluation; CI = confidence interval; ICU = intensive care unit; MPM = Mortality Probability Model;
ROC = receiver operating characteristic; SAPS = Simplified Acute Physiology Score; SMR = standardized mortality ratio.
Critical Care Vol 9 No 6 Le Gall et al.
R646
calibration and discrimination [3]. Calibration reflects the
agreement between individual probabilities and actual out-
comes, whereas discrimination is the model's ability to sepa-
rate patients who die from those who survive. Available
models, such as that using the Simplified Acute Physiology
Score (SAPS) II [4], are outdated [5] and must be adapted to
current ICU populations [6,7].
We developed an expanded version of the SAPS II score, and
we compared the performance of this new mortality prediction
model with the performances of the original SAPS II and a cus-
tomized SAPS II in a large population of ICU patients. Our
study hypothesis was that expanding the SAPS II by adding
routinely collected variables would improve mortality predic-
tion without increasing the burden of data collection, thus pro-
ducing a tool suitable for ICU benchmarking.
To expand the SAPS II, we chose variables that were easy to
collect, measured on the first ICU day and routinely entered
into the French national healthcare database. Furthermore, we
opted not to use diagnoses; this is because ICU patients often
have several diagnoses and because we wanted to develop a
model suitable for evaluating ICU performance in patients with
specific diagnoses. We made an exception of drug overdose
Table 1
Demographic data
Characteristics All patients (n = 77,490) Training set (n = 38,745) Validation set (n = 38,745) P
Age (years; mean ± standard deviation) 56.71 ± 18.91 56.70 ± 19.00 56.72 ± 18.83 0.9422
Age (%)
<40 years 22.20 22.35 22.05
40–59 years 27.95 27.77 28.13
60–69 years 18.47 18.40 18.54
70–79 years 21.68 21.65 21.71
>79 years 9.69 9.82 9.57
Men (%) 59.31 59.06 59.56 0.1581
Medical patients (%) 73.49 73.46 73.53 0.8261
Patient origin (%)
Emergency room or mobile emergency unit 49.94 49.75 50.13 0.1345
Ward in same hospital 39.91 39.89 39.94
Other hospital 10.15 10.36 9.93
Length of hospital stay before ICU admission (%)
<24 hours 67.75 67.76 67.73
1 day 12.37 12.56 12.18
2 days 4.67 4.57 4.77
3–9 days 9.5 9.59 9.42
>9 days 5.71 5.52 5.9
Medicine overdose (%) 11.86 11.94 11.79 0.5122
Original SAPS II score
Maximum 162.00 159.00 162.00 0.5817
Median 32.00 32.00 32.00
Minimum 1 1 1
ICU mortality (%) 17.99 17.95 18.03 0.7647
Hospital mortality (%) 21.48 21.39 21.58 0.5289
P value obtained by the Wilcoxon test for quantitative variables and the χ
2
test for qualitative variables. ICU, intensive care unit; SAPS, Simplified
Acute Physiology Score.
Available online />R647
because this diagnosis is common in some ICUs (up to 40%
of admissions) and has a very low SMR (0.21) [8], and so a
large number of drug overdose cases may result in overestima-
tion of unit performance. In addition, the diagnosis of drug
overdose is easily established at ICU admission.
Materials and methods
We used the data entered between 1 January 1998 and 31
December 1999 into the national healthcare database, which
compiles standardized data on all patients admitted to health-
care facilities in France. Among the 106 ICUs that agreed to
participate (listed in the Appendix), there were 34 medical
ICUs (32%), 18 surgical ICUs (17%) and 54 medical/surgical
ICUs (51%). Forty-six ICUs (43%) were in teaching hospitals.
Data collection
We developed specific software in order to extract study data
from the French national healthcare database. The data
entered in the database (Table 1) include the following: SAPS
II score, age and sex, clinical category (medical patient or not),
the patient's location before ICU admission, hospital length of
stay before ICU admission, and whether the patient was admit-
ted for a drug overdose as defined by ICD-10-CM (Interna-
tional Classification of Diseases, 10th revision, Clinical
Modification) codes from T360 to T509.
Mortality prediction models evaluated in the study
Three mortality prediction models were compared: the original
SAPS II model, a customized SAPS II model and an expanded
SAPS II model. All three models are based on SAPS II [4].
They use logistic regression, with the probability P of hospital
mortality being calculated as follows:
P = exp(logit)/(1+exp [logit])
Where the logit varies with the model. In the original SAPS II
model [4], the logit was chosen as:
Logit = α
0
+ α
1
× (SAPS II) + α
2
× log(SAPS II + 1)
Where α
0
, α
1
and α
2
are the model parameters. Fitting this
model to the data [4] gave the following:
Logit
(a)
= -7.7631 + 0.0737 × (SAPS II) + 0.9971 ×
log(SAPS II + 1)
Customization is a simple procedure that adapts a model to
specific patient populations [9]. There are two ways to cus-
tomize a model. First level customization is customization of
the score itself. The second level is customization of each item
of the score. This latter was not performed here because it
would require data that were not routinely available.
For the present study we developed a customized version of
the SAPS II model for patients admitted to ICUs in France in
1998 and 1999. To this end, we used the logit of the original
SAPS II model and we estimated α
0
, α
1
, and α
2
from data from
the present study.
Finally, we developed an expanded version of SAPS II by add-
ing six variables that are potentially associated with mortality
(Table 2). We transformed the continuous variables (i.e. age
and hospital length of stay before ICU admission) into five-cat-
egory variables. The expanded model was built using the orig-
inal SAPS II approach [4]. First, we fitted a multiple logistic
regression model built from the original SAPS II score and the
additional variables. We used the coefficients thus obtained to
define a new score, which we called the 'expanded SAPS II'.
For each patient, the expanded SAPS II was the sum of the
Table 2
Expanded SAPS II scoring system sheet
Variable Points
Original SAPS II score 0.0742 × SAPS II
Age
<40 years 0
40–59 years 0.1639
60–69 years 0.2739
70–79 years 0.3690
>79 years 0.6645
Sex
Male 0.2083
Female 0
Length of hospital stay before ICU admission
<24 hours 0
1 day 0.0986
2 days 0.1944
3–9 days 0.5284
>9 days 0.9323
Patient's location before ICU
Emergency room or mobile emergency unit 0
Ward in same hospital 0.2606
Other hospital 0.3381
Clinical category
Medical patient 0.6555
Other 0
Intoxication
No 1.6693
Yes 0
Logit = -14.4761 + 0.0844 × score + 6.6158 × log(score + 1). The
expanded Simplified Acute Physiology Score (SAPS) II score is the
sum of the points for a given patient. ICU, intensive care unit.
Critical Care Vol 9 No 6 Le Gall et al.
R648
SAPS II score multiplied by the SAPS II coefficient, and the
coefficients of the additional variables. Finally, we fitted a logis-
tic regression model using the following:
Logit = β
0
+ β
1
× (expanded SAPS II) + β
2
× log([expanded
SAPS II] + 1)
Where β
0
, β
1
and β
2
are the model parameters.
Model validation
To evaluate calibration, we measured the differences between
observed and predicted mortality by using the Hosmer–Leme-
show test and by analyzing the uniformity of fit across several
variables. According to the Hosmer–Lemeshow test [10],
patients are first sorted by increasing mortality probability and
then grouped together into 10 subgroups of patients. A low P
value for the Hosmer–Lemeshow test indicates poor calibra-
tion across these groups. A P value greater than 0.1 indicates
good calibration. Uniformity of fit compares observed and pre-
dicted mortality within groups of patients defined by a variable,
for example patient sex or time in the hospital before ICU
admission. We evaluated uniformity of fit for all variables in the
expanded SAPS II (Table 2).
We evaluated discrimination based on the area under the
receiver operating characteristic (ROC) curve [11]. With this
method, a larger area indicates better discrimination. To com-
pare the areas under the ROC curves for two different models
calculated from the same validation set, we used the test
developed by Hanley and Haijan-Tilaki [12], which is available
online [13].
Because the usefulness of a mortality prediction model is
largely dependent on its ability to adapt to different popula-
tions, evaluations should ideally be conducted in samples that
differ from that used to develop the model. Therefore, we ran-
domly split our data set into a training set and a validation set,
both equal to half of the total sample size. We developed the
mortality prediction models using the training set and then
tested them using the validation set for external model valida-
tion. In addition, we used an internal validation procedure
involving K-fold cross-validation on the training set itself [14].
To this end, we split the training set into K parts of similar sizes.
Each part was used to validate the model fitted to the other
parts (K - 1). This allowed us to evaluate not only average
model performance but also performance variation due to var-
iability in the data sets used for model fit and validation,
respectively. This latter aspect of model validation is not cap-
tured when using a single data set. We used K = 5, as recom-
mended by others [14].
Standardized mortality ratio
The SMR is calculated as the ratio of observed hospital mor-
tality over predicted hospital mortality, which is the sum of indi-
vidual mortality probabilities. An approximate 95% confidence
interval (CI) for the SMR was calculated by using the method
proposed by Breslow and Day [15].
Results
The 106 ICUs included in the study provided data for 107,652
consecutive first admissions. We successively excluded
admissions with invalid SAPS II scores, burn patients,
coronary patients and cardiac surgery patients, as well as
those younger than 18 years. This left 77,490 (72%) patients.
Among the 106 ICUs, 22 (21%) failed to provide the SAPS II
score for more than 20% of admissions (some collected
SAPS I rather than SAPS II). The main characteristics of the
study patients are reported in Table 1. The patient mean (±
standard deviation) age of the patients was 56.7 ± 18.9 years.
There was a predominance of males (59%) and of medical
patients (73%). Drug overdose was observed for 12% of
admissions, but the range was wide, from 0% to 40% of
reported cases. The mean SAPS II score was 36.1 ± 21.2.
Overall ICU mortality was 18.0% and overall hospital mortality
was 21.5%.
The two mortality prediction models derived from the
original SAPS II model
The customized SAPS II model was characterized by the fol-
lowing logit:
Table 3
Calibration and discrimination of the models
Model Internal validation (fivefold cross-validation on the training set) External validation on the validation set
P value of Hosmer–Lemeshow test Area under the ROC curve Hosmer–Lemeshow test Area under the
ROC curve
Mean Standard
deviation
Mean Standard
deviation
Test statistic C P value
Original SAPS II 0.001 0.001 0.8591 0.0058 1162.9 <0.0001 0.8575
Customized SAPS II 0.6280 0.1422 0.8562 0.0058 6.41 0.7794 0.8575
Expanded SAPS II 0.2754 0.3832 0.8797 0.0054 6.04 0.8116 0.8787
ROC, receiver operating characteristic; SAPS, Simplified Acute Physiology Score.
Available online />R649
Logit
(b)
= -8.1834 + 0.0467 × SAPS II + 1.3287 × log(SAPS
II + 1).
The expanded model was fitted to the data, as shown in Table
2. The logit of the expanded model was as follows:
Logit
(c)
= -14.4761 + 0.0844 × (expanded SAPS II) + 6.6158
× log(expanded SAPS II + 1).
Validation of the three mortality prediction models
Table 3 summarizes the model validation results for all three
models, and Table 4 shows their uniformity of fit across various
patient subgroups.
The calibration of the original SAPS II model was poor
because it strongly over-predicted mortality. SMR values
exhibited wide variations across patient subgroups (Table 4);
for instance, they varied from 0.62 to 0.98 across the age
range, from 0.76 to 1.22 across the range of hospital lengths
of stay before ICU admission, and from 0.21 to 0.90 in
patients with and without drug overdose. The SMR on the val-
idation set was 0.841 (95% CI 0.823–0.859). Discrimination,
in contrast, was good, with an area under the ROC curve of
0.858 (Table 3, external validation).
With the customized SAPS II model calibration was better,
with a P value of 0.78 by the Hosmer–Lemeshow test (Table
3, external validation). No improvement in uniformity of fit was
noted as compared with the original SAPS II model, with the
only exception being the clinical category. However, SMR val-
ues varied around the target value 1. The SMR on the valida-
tion set was 1.009 (95% CI 0.987–1.031). The area under the
ROC curve was the same as for the original SAPS II model.
The expanded SAPS II model exhibited excellent calibration,
with Hosmer–Lemeshow test P values of 0.81 on the valida-
tion set and 0.28 in the internal validation procedure. Uniform-
ity of fit was clearly improved. For none of the variables
included in the expanded SAPS II model was the SMR value
for patient subgroups significantly different from 1. The SMR
on the validation set was 1.007 (95% CI 0.985–1.028). The
area under the ROC curve was 0.879 – a value significantly
greater than the areas obtained with the other two models (P
< 0.0001 using the Hanley test).
Comparison of standardized mortality ratios across
study intensive care units
First, for each mortality prediction model we compared the
SMRs for the 97 ICUs that contributed a sufficient number of
patients. The original SAPS II model yielded SMR values
between 0.40 and 1.54. Of the 97 ICUs, 43 had values
smaller than 1. The SMR values given by the customized
SAPS II model varied between 0.48 and 1.89; 11 units had
values smaller than 1. The expanded SAPS II model produced
SMR values between 0.45 and 1.67; nine units had values
smaller than 1. The results for the 16 ICUs with the largest
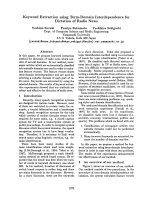
number of patients are summarized in Fig. 1.
When we evaluated differences between the customized and
expanded SAPS II model, we found that seven ICUs had
SMRs significantly different from 1 according to the custom-
ized SAPS II model but not according to the expanded SAPS
II model (e.g. ICU A in Fig. 1). Conversely, three other ICUs
had SMRs significantly different from 1 according to the
expanded SAPS II model but not the customized SAPS II
model (e.g. ICU N in Fig. 1).
Table 4
Uniformity of fit of the three SAPS II models in the validation
sample
Variable Value SMR
Original Customized Expanded
Age
<40 years 0.62* 0.74* 1.05
40–59 years 0.77* 0.92* 1.02
60–69 years 0.86* 1.03 1.00
70–79 years 0.90* 1.09* 1.00
>79 years 0.98 1.18* 0.99
Sex
Male 0.88* 1.05* 1.00
Female 0.79* 0.95* 1.02
Length of inhospital stay before
ICU admission
<24 hours 0.76* 0.91* 1.00
1 day 0.89* 1.05 1.04
2 days 0.93 1.12* 1.02
3–9 days 1.07* 1.28* 1.01
>9 days 1.22* 1.46* 1.01
Patient's location before ICU
From outside 0.71* 0.86* 1.00
From the wards 0.99 1.19* 1.02
From another hospital 0.89* 1.07* 0.99
Clinical category
Medical patient 0.85* 1.02 1.04
Other 0.80* 0.96 1.00
Intoxication
No 0.90* 1.08* 1.01
Yes 0.21* 0.26* 1.04
*The 95% confidence interval does not include 1. ICU, intensive care
unit; SAPS, Simplified Acute Physiology Score.
Critical Care Vol 9 No 6 Le Gall et al.
R650
Discussion
Since the first reports of scoring systems for evaluating dis-
ease severity in ICU patients, many studies conducted in
widely diverse ICUs and countries have highlighted the limita-
tions of these systems for evaluating databases different from
the ones in which they were developed. In addition, published
scoring systems were developed many years ago (nearly 20
years for Acute Physiology and Chronic Health Evaluation
[APACHE] II [16] and 10 for SAPS II [4] and APACHE III
[17]).
To improve the performance of available scoring systems, two
methods have been used. Customization has been investi-
gated, for instance, by Moreno and Apolone [6] and by Metnitz
and coworkers [7]. Le Gall and coworkers [9] customized
SAPS II and MPM II for patients with early severe sepsis.
Moreno and Apolone [6] compared two customization strate-
gies, one using the original MPM II logit as an independent var-
iable (first level customization) and the other using all of the
original variables (second level customization). They found that
second level customization was more effective in improving
the overall goodness of fit of MPM II [18] and suggested that
this method is preferable over first level customization. Adding
variables to the scoring system is the other method used to
improve performance [19].
Models that predict mortality accurately and that perform well
in various ICU populations are essential to benchmarking.
Glance and coworkers [5] recently investigated whether the
identity of ICU quality outliers varied with the scoring system
used for SMR calculation. They found that the APACHE II,
SAPS II and MPM II exhibited only fair to moderate agreement
in identifying quality outliers. They concluded that existing
models were of limited usefulness for benchmarking.
The present study focused on SAPS II, which is routinely col-
lected in France in all ICUs. We started the study in 2000, and
so only data from 1988 and 1999 were available. Because it
would have been rather difficult and time consuming to extract
data from hundreds of hospitals that did not have the same
software for data collection, we had to develop specific soft-
ware to extract the primary data. The second version of the
software was found to be efficient, the first version being
bugged and not allowing proper analysis. Since 2003 there
has been a national database, and we are now able to bench-
mark units easily using expanded SAPS II. Nevertheless, we
must always seek prior permission from the units to analyze
their data anonymously. On the other hand, SAPS III is now
published [20,21], and one of the authors of the present report
(JRLG) participated in the creation of SAPS III. The SAPS III
appears very promising, and is more recent and sophisticated
than SAPS II. Nevertheless, for historical comparisons the
expanded SAPS II can easily be obtained from existing
databases.
We expanded SAPS II by adding other robust and simple data
that are routinely available. Apart from drug overdose, we did
not include diagnoses in the model because ICU benchmark-
ing for a specific diagnosis (such as acute respiratory distress
syndrome, severe pancreatitis, peritonitis, chronic obstructive
pulmonary disease, or pneumonitis) cannot be achieved using
a model in which that diagnosis is included. Nevertheless, we
made an exception for drug overdose for several reasons.
First, drug overdose is a simple diagnosis that is established
on the first ICU day; although data collection in the French
national healthcare database allows reporting of drug over-
dose at any time during the ICU stay, in practice ICU patients
with drug overdose are admitted for this reason. Second, the
percentage of patients with drug overdose was high in the
overall database (12%) but varied widely across ICUs (from
0% to 40%). Finally, the SMR for drug overdose is very low
(0.21 with the original SAPS II and 0.25 with the customized
SAPS II), which may artificially improve the SMR in ICUs with
large numbers of drug overdose cases. Introducing drug
overdose into the model gives a mean SMR close to 1 for this
diagnosis.
The exclusive use of data entered into the French healthcare
database allowed us to include a large number of ICU stays
and to develop a mortality prediction model suitable for bench-
marking, without additional data collection. To benefit from
these fundamental advantages, we did not use second level
customization of the SAPS II because the components for this
procedure are not routinely available. Also, we did not include
organ failures because their timing is not routinely recorded in
the database.
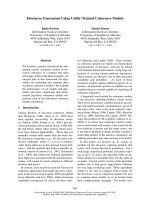
Figure 1
ICU performance as assessed using the three SAPS II modelsICU performance as assessed using the three SAPS II models. Shown
are standardized mortality ratio (SMR) values for 16 units with more
than 300 patients, using either the original, the expanded, or the cus-
tomized Simplified Acute Physiology Score (SAPS) II. A–P indicate dif-
ferent intensive care units (ICUs).
Available online />R651
All three SAPS II models produced fairly satisfactory areas
under the ROC curve (range 0.858–0.879). Nevertheless,
discrimination was significantly better with the expanded
SAPS II model than with the other two models. There were
much greater differences in calibration across the three mod-
els. The original SAPS II model markedly overestimated mor-
tality and yielded poor uniformity of fit. Customization improved
calibration, yielding a P value of 0.78 using the Hosmer–Leme-
show test, but it did not improve uniformity of fit. Good uni-
formity of fit was obtained using the expanded SAPS II model.
With this model, the SMR values for patient subgroups were
not significantly different from 1.
In the present study, the expanded SAPS II model performed
much better than the original SAPS II model and significantly
better than the customized SAPS II model, in particular in
terms of uniformity of fit. All required variables are collected
consistently over time and across ICUs, and can be extracted
from existing databases using dedicated abstracting software.
Comparisons across ICUs of SMRs obtained using the three
models revealed large differences. With the original SAPS II
model, 43 of 97 ICUs (44%) had SMR values significantly
smaller than 1. Because the original model cannot be used for
benchmarking, we focused our comparison on the customized
and expanded models. SMRs ranged from 0.48 to 1.89 with
the customized model and from 0.45 to 1.67 with the
expanded model. There were 10 ICUs with SMR values signif-
icantly different from 1 with the customized SAPS II model but
not with the expanded SAPS II model or vice versa, indicating
that use of a customized model for benchmarking might be
misleading.
In our study, the quality of data was not perfect. Data were not
collected specifically for the study but were taken from stand-
ardized reports. The completeness of data in the reports was
evaluated elsewhere [22], with special attention given to
SAPS II score. The SAPS II score was reported for 80% of
stays. This is because some administrative units included
intermediate units that only monitored patients [22]. In these
patients collection of the SAPS II score is not mandatory. In
addition, a formal quality control analysis of the French data-
base has been published [23], showing mainly that there was
an underestimation of comorbid conditions, which are not part
of the expanded SAPS II. Strengths of our study include the
large number of patients and the use of a real-life data source.
Conclusion
The original SAPS II model is not suitable for ICU benchmark-
ing, and neither is customization of the SAPS II entirely satis-
factory. We were unable to customize its components, which
probably would have been more satisfactory. The expanded
SAPS II model obtained by adding simple data that are rou-
tinely recorded in French national healthcare database may be
a good compromise between immediate, nationwide applica-
bility and adequate model performance. Discrimination, cali-
bration and uniformity of fit – three properties that we believe
are essential for benchmarking – were far better with the
expanded SAPS II model. For some units, the expanded SAPS
II model exhibited good or poor performance not detected by
the customized SAPS II model.
Although SMR is one aspect of an ICU's performance, we
must remind practitioners and administrative managers that
there are other aspects of performance, namely patient and
family satisfaction, nurse turnover and burnout, costs and
organizational issues.
Competing interests
The authors declare that they have no competing interests.
Authors' contributions
JR conducted the study and drafted the manuscript. AN per-
formed statistical analysis. FH collected and managed the
data. JPB, JPF, BG, CG, EL, PM and DV conceived the study
in terms of its design and coordination, and participated in
data analysis. DV also conducted the study and helped to draft
the manuscript. All authors read and approved the final
manuscript.
Acknowledgements
This study was supported by National Health Program For Clinical
Research Grant AOM 98 119. We are indebted to A Wolfe, MD, and V
Teboul for helping to prepare the manuscript. ICUs participating in the
study are listed in the Appendix.
References
1. Le Gall JR, Loirat P: Can we evaluate the performance of an
intensive care unit? Curr Opin Crit Care 1995, 1:219-220.
2. Ridley S: Severity of illness scoring systems and performance
appraisal. Anaesthesia 1998, 53:1185-1194.
Key messages
• The original SAPS II mortality prediction model is out-
dated and must be adapted to current ICU populations.
• The original SAPS II may be used to score severity of ill-
ness in ICU patients, but it is necessary to use the
expanded SAPS II to calculate the SMR or to measure
the performance of ICUs.
• Adding simple data routinely collected to the original
SAPS II led to better calibration, discrimination and uni-
formity of fit of the model.
• The stastistical qualities of the expanded SAPS II are
much better than those of the original and the custom-
ized SAPS II.
• Above all, the expanded SAPS II is easy to obtain from
the existing databases. It is a simple system that may be
used to measure precisely the performance of units and
to compare performance over time.
Critical Care Vol 9 No 6 Le Gall et al.
R652
3. Lemeshow S, Le Gall JR: Modeling the severity of illness of ICU
patients. A system update. JAMA 1994, 272:1049-1055.
4. Le Gall JR, Lemeshow S, Saulnier F: A new Simplified Acute
Physiologic Score (SAPS II) based on an European/North
American multicenter study. JAMA 1993, 270:2957-2963. Cor-
rection: JAMA 1994, 271:1321.
5. Glance LG, Osler TM, Dick A: Rating the quality of intensive
care units: is it a function of the intensive care unit scoring
system? Crit Care Med 2002, 30:1976-1982.
6. Moreno R, Apolone G: Impact of different customization strate-
gies in the performance of a general severity score. Crit Care
Med 1997, 25:2001-2008.
7. Metnitz PG, Lang T, Vesely H, Valentin A, Le Gall JR: Ratios of
observed to expected mortality are affected by difference in
case mix and quality of care. Intensive Care Med 2000,
26:1466-1472.
8. Watson WA, Litovitz TL, Klein-Schwartz W, Rodgers GC Jr, You-
niss J, Reid N, Rouse WG, Rembert RS, Borys D: 2003 annual
report of the American Association of Poison Control Centers
Toxic Exposure Surveillance System. Am J Emerg Med 2004,
22:335-404.
9. Le Gall JR, Lemeshow S, Leleu G, Klar J, Huillard J, Rue M, Teres
D, Artigas A: Customized probability models for early severe
sepsis in adult intensive care patients. Intensive Care Unit
Scoring Group. JAMA 1995, 273:644-650.
10. Hosmer DW, Lemeshow S: Applied Logistic Regression 2nd edi-
tion. New York, NY: John Wiley & Sons; 1989.
11. Hanley JA, McNeil BJ: The meaning and use of the area under
a receiver operating characteristic (ROC) curve. Radiology
1982, 143:29-36.
12. Hanley JA, Haijan-Tilaki KO: Sampling variability of nonparamet-
ric estimates of the areas under receiver operating character-
istic curves: an update. Acad Radiol 1997, 4:49-58.
13. Software, etc. [J Hanley] [ />miology/hanley/software]
14. Hastie T, Tibshirani R, Friedman J: The Elements of Statistical
Learning: Data Mining, Inference, and Prediction New York, NY:
Springer-Verlag; 2001.
15. Breslow NE, Day NE: Statistical Methods in Cancer Research.
The Design and Analysis of Cohort Studies Volume II. Lyon,
France: International Agency for Research on Cancer; 1987.
16. Knaus WA, Draper EA, Wagner DP, Zimmerman JE: APACHE II: a
severity of disease classification system. Crit Care Med 1985,
13:818-829.
17. Knaus WA, Wagner DP, Draper EA, Zimmerman JE, Bergner M,
Bastos PG, Sirio CA, Murphy DJ, Lotring T, Damiano A, et al.: The
APACHE III prognostic system. Risk prediction of hospital
mortality for critically ill hospitalized adults. Chest 1991,
100:1619-1636.
18. Lemeshow S, Terres D, Klar J, Avrunin JS, Gehlbach SH, Rapoport
J: Mortality Probability Models (MPH II) based on an interna-
tional cohort of intensive care unit patients. JAMA 1993,
270:2478-2486.
19. Knaus WA, Harrell FE, Fisher CJ Jr, Wagner DP, Opal SM, Sadoff
JC, Draper EA, Walawander CA, Conboy K, Grasela TH: The clin-
ical evaluation of new drugs for sepsis. A prospective study
design based on survival analysis. JAMA 1993,
270:1233-1240.
20. Metnitz PhGH, Moreno RP, Almeida E, Jordan B, Bauer P, Abi-
zanda-Campos R, Iapichino G, Edbrooke D, Capuzzo M, Le Gall
JR, on behalf of the SAPS 3 investigators: SAPS 3: from evalua-
tion of the patient to evaluation of the intensive care unit. Part
1: objectives, methods and cohort description. Intensive Care
Med 2005 in press.
21. Moreno RP, Metnitz PhGH, Almeida E, Jordan B, Bauer P, Abi-
zanda-Campos R, Iapichino G, Edbrooke D, Capuzzo M, Le Gall
JR, on behalf of the SAPS 3 investigators: SAPS 3: from evalua-
tion of the patient to evaluation of the intensive care unit. Part
2: objectives, methods and cohort description. Intensive Care
Med 2005 in press.
22. Moine P, Hémery F, Blériot JP, Fulgencio JP, Garrigues B, Gouzes
C, Le Gall JR, Lepage E, Villers D: [Completeness of ICU activity
reports sent to French healthcare authorities]. Ann Fr Anesth
Réanim 2004, 23:15-20.
23. Holstein J, Taright N, Lepage E, Razafimamonjy J, Duboc D, Feld-
man L, Hittinger L, Lavergne T, Chatellier G: [Quality of medical
database to valorize the DRG model by ISA cost indicators].
Rev Epidemiol Santé Publique 2002, 50:593-603.